
|
|||||
|
 | |
| |
| |
| |
| |
| |
|
Gene: PNPLA4 |
Gene summary for PNPLA4 |
| Gene information | Species | Human | Gene symbol | PNPLA4 | Gene ID | 8228 |
| Gene name | patatin like phospholipase domain containing 4 | |
| Gene Alias | DXS1283E | |
| Cytomap | Xp22.31 | |
| Gene Type | protein-coding | GO ID | GO:0001523 | UniProtAcc | A0A024RBU8 |
Top |
Malignant transformation analysis |
| Identification of the aberrant gene expression in precancerous and cancerous lesions by comparing the gene expression of stem-like cells in diseased tissues with normal stem cells |
| Entrez ID | Symbol | Replicates | Species | Organ | Tissue | Adj P-value | Log2FC | Malignancy |
| 8228 | PNPLA4 | LZE4T | Human | Esophagus | ESCC | 2.40e-05 | 3.16e-01 | 0.0811 |
| 8228 | PNPLA4 | LZE7T | Human | Esophagus | ESCC | 1.06e-09 | 4.85e-01 | 0.0667 |
| 8228 | PNPLA4 | LZE8T | Human | Esophagus | ESCC | 2.78e-10 | 5.79e-01 | 0.067 |
| 8228 | PNPLA4 | LZE20T | Human | Esophagus | ESCC | 5.68e-05 | 2.17e-01 | 0.0662 |
| 8228 | PNPLA4 | LZE24T | Human | Esophagus | ESCC | 2.80e-04 | 1.75e-01 | 0.0596 |
| 8228 | PNPLA4 | LZE6T | Human | Esophagus | ESCC | 1.05e-12 | 1.10e+00 | 0.0845 |
| 8228 | PNPLA4 | P2T-E | Human | Esophagus | ESCC | 2.18e-25 | 5.25e-01 | 0.1177 |
| 8228 | PNPLA4 | P4T-E | Human | Esophagus | ESCC | 5.58e-21 | 7.13e-01 | 0.1323 |
| 8228 | PNPLA4 | P5T-E | Human | Esophagus | ESCC | 1.25e-15 | 2.24e-01 | 0.1327 |
| 8228 | PNPLA4 | P8T-E | Human | Esophagus | ESCC | 5.50e-27 | 5.50e-01 | 0.0889 |
| 8228 | PNPLA4 | P9T-E | Human | Esophagus | ESCC | 1.27e-10 | 1.76e-01 | 0.1131 |
| 8228 | PNPLA4 | P10T-E | Human | Esophagus | ESCC | 1.73e-16 | 3.13e-01 | 0.116 |
| 8228 | PNPLA4 | P11T-E | Human | Esophagus | ESCC | 7.12e-07 | 2.58e-01 | 0.1426 |
| 8228 | PNPLA4 | P12T-E | Human | Esophagus | ESCC | 2.49e-35 | 7.10e-01 | 0.1122 |
| 8228 | PNPLA4 | P15T-E | Human | Esophagus | ESCC | 7.83e-13 | 3.12e-01 | 0.1149 |
| 8228 | PNPLA4 | P16T-E | Human | Esophagus | ESCC | 3.07e-35 | 5.67e-01 | 0.1153 |
| 8228 | PNPLA4 | P20T-E | Human | Esophagus | ESCC | 4.15e-09 | 3.31e-01 | 0.1124 |
| 8228 | PNPLA4 | P21T-E | Human | Esophagus | ESCC | 6.13e-16 | 2.10e-01 | 0.1617 |
| 8228 | PNPLA4 | P22T-E | Human | Esophagus | ESCC | 3.45e-15 | 2.19e-01 | 0.1236 |
| 8228 | PNPLA4 | P23T-E | Human | Esophagus | ESCC | 1.27e-21 | 6.64e-01 | 0.108 |
| Page: 1 2 3 4 5 |
| Tissue | Expression Dynamics | Abbreviation |
| Esophagus |  | ESCC: Esophageal squamous cell carcinoma |
| HGIN: High-grade intraepithelial neoplasias | ||
| LGIN: Low-grade intraepithelial neoplasias | ||
| Liver | 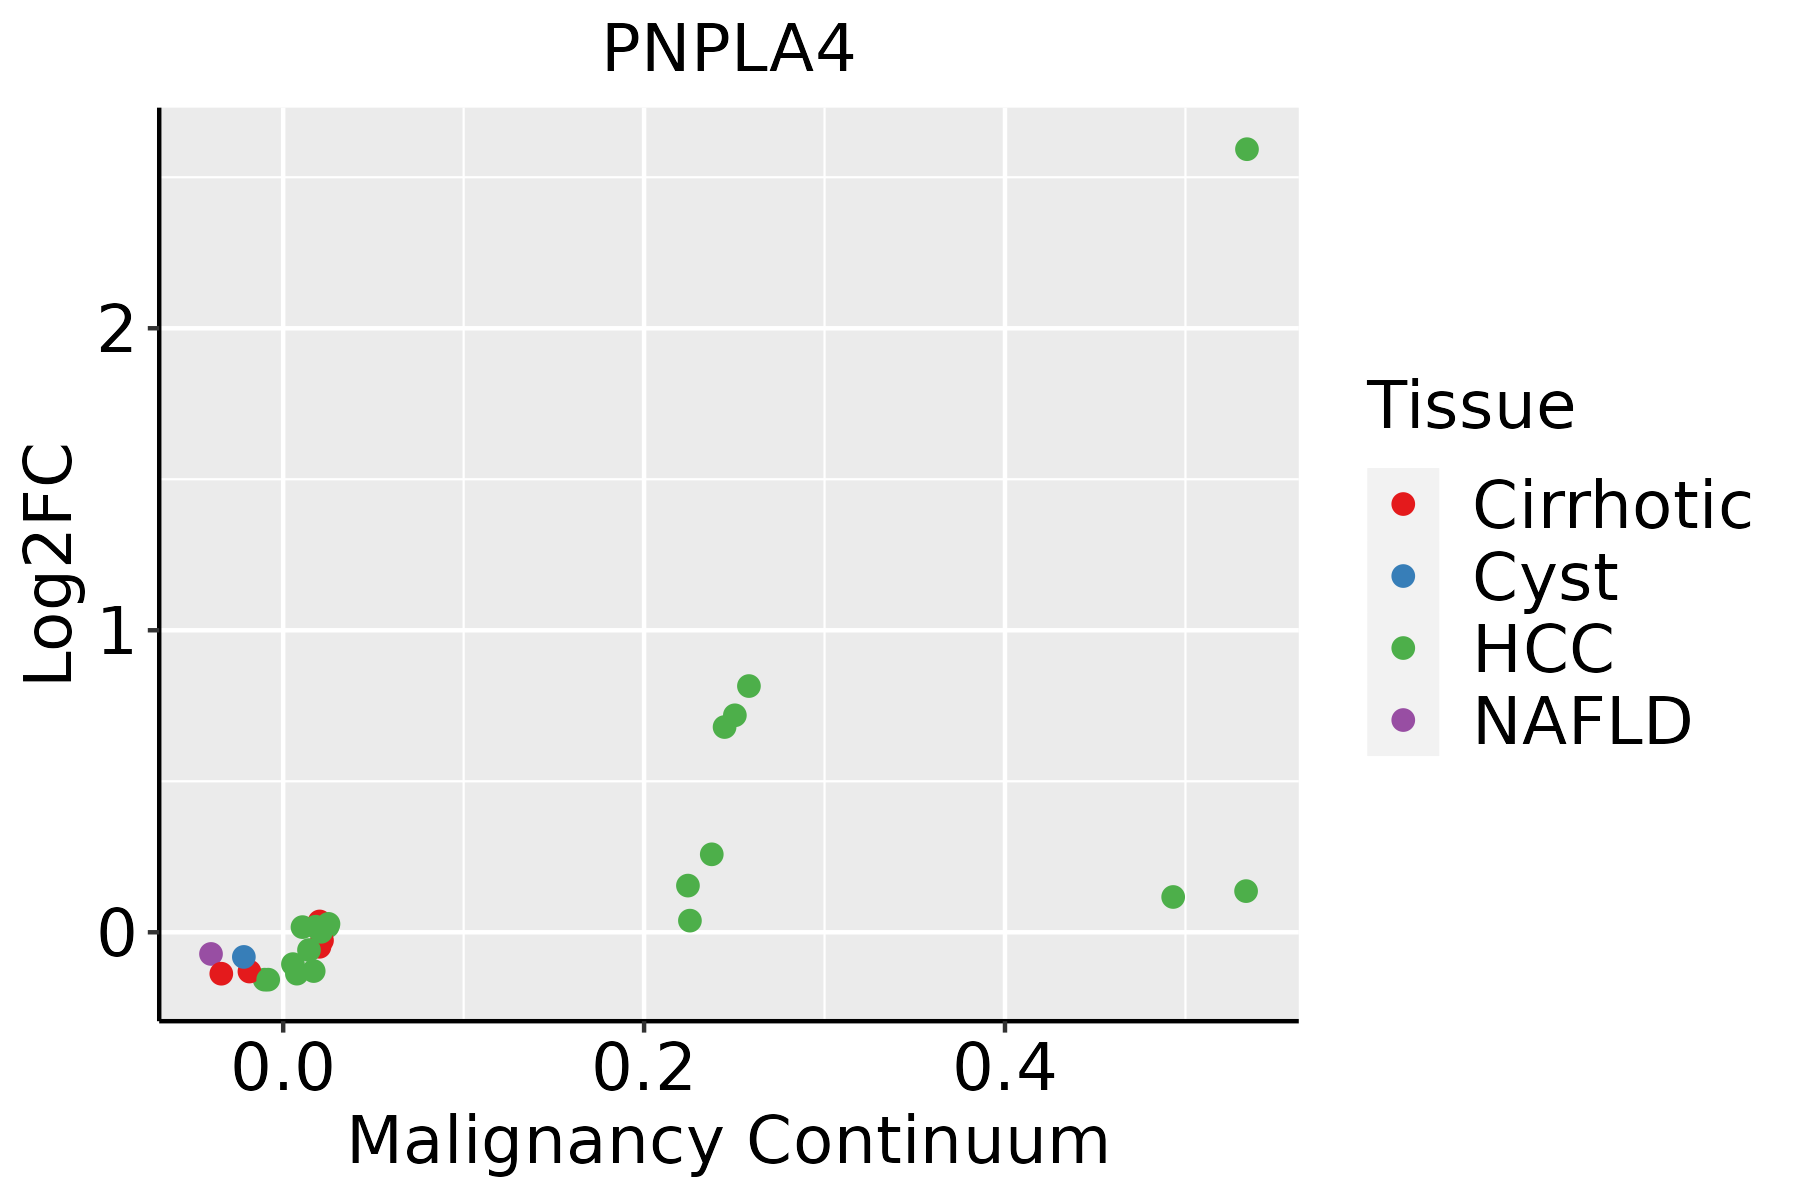 | HCC: Hepatocellular carcinoma |
| NAFLD: Non-alcoholic fatty liver disease | ||
| Oral Cavity | 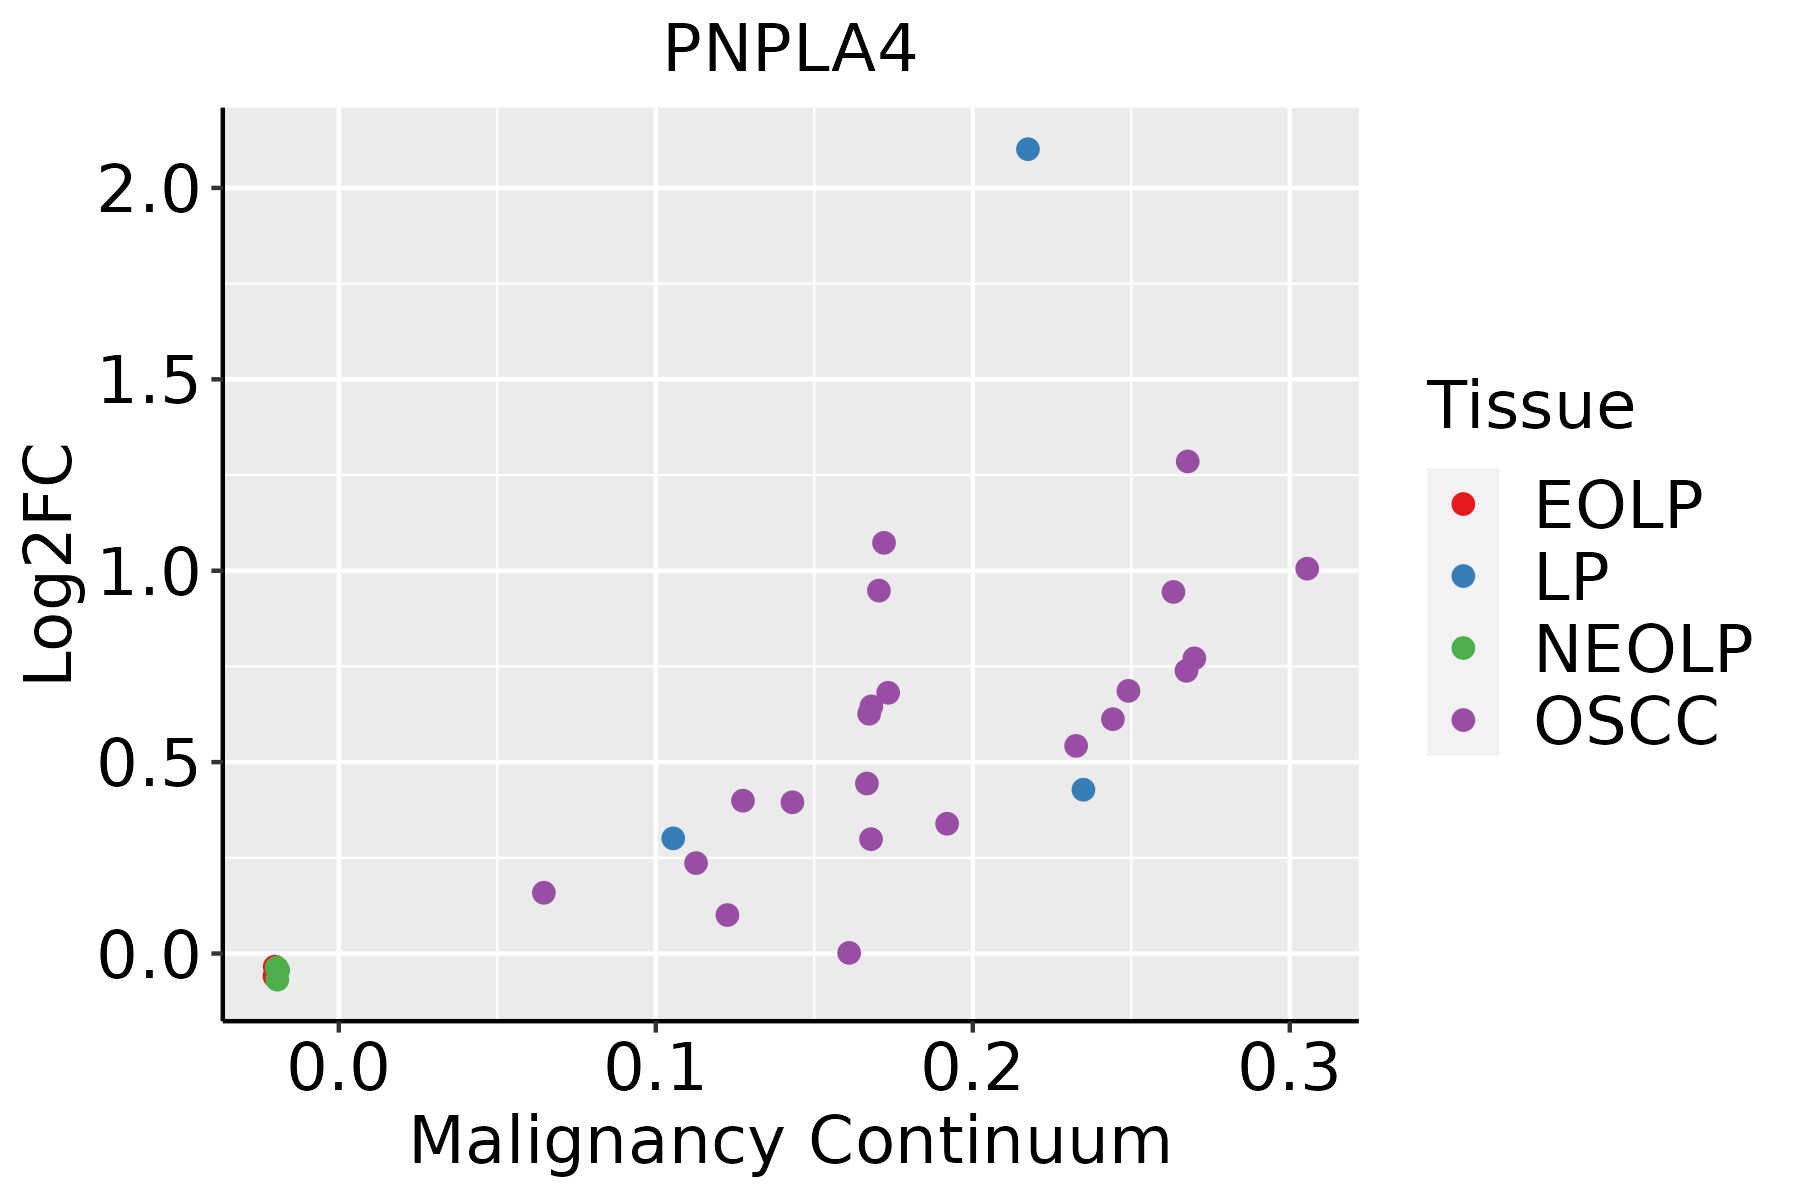 | EOLP: Erosive Oral lichen planus |
| LP: leukoplakia | ||
| NEOLP: Non-erosive oral lichen planus | ||
| OSCC: Oral squamous cell carcinoma | ||
| Skin |  | AK: Actinic keratosis |
| cSCC: Cutaneous squamous cell carcinoma | ||
| SCCIS:squamous cell carcinoma in situ |
| ∗log2FC in expression of this searched gene in stem-like cells from each diseased tissue sample relative to stem-like cells in normal samples in each tissue plotted against the malignancy continuum. Samples are colored based on if they are from different disease stage. |
Top |
Malignant transformation related pathway analysis |
| Find out the enriched GO biological processes and KEGG pathways involved in transition from healthy to precancer to cancer |
| Tissue | Disease Stage | Enriched GO biological Processes |
| Colorectum | AD |  |
| Colorectum | SER |  |
| Colorectum | MSS |  |
| Colorectum | MSI-H |  |
| Colorectum | FAP |  |
| ∗Top 15 enriched GO BP terms are showed in the bar plot of each disease state in each tissue. Each row represents a significant GO biological process which is colored according to the -log10(p.adjust). |
| Page: 1 2 3 4 5 6 7 8 9 |
| GO ID | Tissue | Disease Stage | Description | Gene Ratio | Bg Ratio | pvalue | p.adjust | Count |
| GO:00060668 | Esophagus | ESCC | alcohol metabolic process | 202/8552 | 353/18723 | 7.32e-06 | 7.26e-05 | 202 |
| GO:00464864 | Esophagus | ESCC | glycerolipid metabolic process | 211/8552 | 392/18723 | 6.51e-04 | 3.46e-03 | 211 |
| GO:00442427 | Esophagus | ESCC | cellular lipid catabolic process | 121/8552 | 214/18723 | 8.63e-04 | 4.43e-03 | 121 |
| GO:00160427 | Esophagus | ESCC | lipid catabolic process | 168/8552 | 320/18723 | 7.97e-03 | 2.84e-02 | 168 |
| GO:000606621 | Liver | HCC | alcohol metabolic process | 208/7958 | 353/18723 | 2.80e-10 | 9.50e-09 | 208 |
| GO:004424222 | Liver | HCC | cellular lipid catabolic process | 134/7958 | 214/18723 | 2.07e-09 | 5.79e-08 | 134 |
| GO:00550882 | Liver | HCC | lipid homeostasis | 103/7958 | 167/18723 | 4.27e-07 | 7.18e-06 | 103 |
| GO:004648611 | Liver | HCC | glycerolipid metabolic process | 215/7958 | 392/18723 | 4.54e-07 | 7.49e-06 | 215 |
| GO:001604221 | Liver | HCC | lipid catabolic process | 175/7958 | 320/18723 | 6.50e-06 | 7.88e-05 | 175 |
| GO:00066412 | Liver | HCC | triglyceride metabolic process | 59/7958 | 100/18723 | 6.35e-04 | 3.93e-03 | 59 |
| GO:000663911 | Liver | HCC | acylglycerol metabolic process | 72/7958 | 128/18723 | 1.16e-03 | 6.54e-03 | 72 |
| GO:000663811 | Liver | HCC | neutral lipid metabolic process | 72/7958 | 129/18723 | 1.54e-03 | 8.14e-03 | 72 |
| GO:000672011 | Liver | HCC | isoprenoid metabolic process | 65/7958 | 116/18723 | 2.23e-03 | 1.11e-02 | 65 |
| GO:003430812 | Liver | HCC | primary alcohol metabolic process | 55/7958 | 102/18723 | 1.30e-02 | 4.67e-02 | 55 |
| GO:00060667 | Oral cavity | OSCC | alcohol metabolic process | 179/7305 | 353/18723 | 4.54e-06 | 5.21e-05 | 179 |
| GO:00442426 | Oral cavity | OSCC | cellular lipid catabolic process | 104/7305 | 214/18723 | 2.61e-03 | 1.15e-02 | 104 |
| GO:00067203 | Oral cavity | OSCC | isoprenoid metabolic process | 59/7305 | 116/18723 | 6.18e-03 | 2.33e-02 | 59 |
| GO:000606613 | Oral cavity | LP | alcohol metabolic process | 111/4623 | 353/18723 | 2.24e-03 | 1.62e-02 | 111 |
| GO:004424213 | Oral cavity | LP | cellular lipid catabolic process | 70/4623 | 214/18723 | 4.82e-03 | 3.05e-02 | 70 |
| Page: 1 |
| Pathway ID | Tissue | Disease Stage | Description | Gene Ratio | Bg Ratio | pvalue | p.adjust | qvalue | Count |
| Page: 1 |
Top |
Cell-cell communication analysis |
| Identification of potential cell-cell interactions between two cell types and their ligand-receptor pairs for different disease states |
| Ligand | Receptor | LRpair | Pathway | Tissue | Disease Stage |
| Page: 1 |
Top |
Single-cell gene regulatory network inference analysis |
| Find out the significant the regulons (TFs) and the target genes of each regulon across cell types for different disease states |
| TF | Cell Type | Tissue | Disease Stage | Target Gene | RSS | Regulon Activity |
| ∗The dot plots of a searched regulon are shown for all cell subpopulations in each disease state of each tissue based on the regulon specific score inferred using pySCENIC and by calculating the average expression. |
| Page: 1 |
Top |
Somatic mutation of malignant transformation related genes |
| Annotation of somatic variants for genes involved in malignant transformation |
| Hugo Symbol | Variant Class | Variant Classification | dbSNP RS | HGVSc | HGVSp | HGVSp Short | SWISSPROT | BIOTYPE | SIFT | PolyPhen | Tumor Sample Barcode | Tissue | Histology | Sex | Age | Stage | Therapy Types | Drugs | Outcome |
| PNPLA4 | SNV | Missense_Mutation | c.680N>A | p.Ser227Asn | p.S227N | P41247 | protein_coding | tolerated(0.43) | benign(0) | TCGA-AR-A0TW-01 | Breast | breast invasive carcinoma | Female | <65 | III/IV | Chemotherapy | doxorubicin | PD | |
| PNPLA4 | SNV | Missense_Mutation | c.679N>T | p.Ser227Cys | p.S227C | P41247 | protein_coding | deleterious(0.03) | benign(0.379) | TCGA-AR-A0TW-01 | Breast | breast invasive carcinoma | Female | <65 | III/IV | Chemotherapy | doxorubicin | PD | |
| PNPLA4 | SNV | Missense_Mutation | rs767773321 | c.188N>G | p.Asn63Ser | p.N63S | P41247 | protein_coding | tolerated(0.73) | benign(0) | TCGA-GI-A2C9-01 | Breast | breast invasive carcinoma | Female | <65 | I/II | Unspecific | SD | |
| PNPLA4 | insertion | Frame_Shift_Ins | novel | c.182_183insTTATCAAACTGTGAAACCTATGCCTGGAATACTC | p.Glu61AspfsTer14 | p.E61Dfs*14 | P41247 | protein_coding | TCGA-A8-A082-01 | Breast | breast invasive carcinoma | Female | <65 | I/II | Chemotherapy | 5-fluorouracil | CR | ||
| PNPLA4 | insertion | Frame_Shift_Ins | novel | c.300_301insGCCGCAGCCCAGTACC | p.Pro101AlafsTer42 | p.P101Afs*42 | P41247 | protein_coding | TCGA-AN-A0FX-01 | Breast | breast invasive carcinoma | Female | <65 | I/II | Unknown | Unknown | SD | ||
| PNPLA4 | insertion | Frame_Shift_Ins | novel | c.298_299insA | p.Pro100HisfsTer38 | p.P100Hfs*38 | P41247 | protein_coding | TCGA-AN-A0FX-01 | Breast | breast invasive carcinoma | Female | <65 | I/II | Unknown | Unknown | SD | ||
| PNPLA4 | SNV | Missense_Mutation | c.491N>T | p.Gly164Val | p.G164V | P41247 | protein_coding | deleterious(0) | probably_damaging(0.995) | TCGA-2W-A8YY-01 | Cervix | cervical & endocervical cancer | Female | <65 | I/II | Chemotherapy | cisplatin | CR | |
| PNPLA4 | SNV | Missense_Mutation | novel | c.437N>T | p.Pro146Leu | p.P146L | P41247 | protein_coding | deleterious(0) | probably_damaging(0.999) | TCGA-2W-A8YY-01 | Cervix | cervical & endocervical cancer | Female | <65 | I/II | Chemotherapy | cisplatin | CR |
| PNPLA4 | SNV | Missense_Mutation | rs775251646 | c.329N>A | p.Arg110Gln | p.R110Q | P41247 | protein_coding | deleterious(0) | possibly_damaging(0.876) | TCGA-EA-A3HS-01 | Cervix | cervical & endocervical cancer | Female | <65 | I/II | Unknown | Unknown | SD |
| PNPLA4 | SNV | Missense_Mutation | c.203N>T | p.Lys68Met | p.K68M | P41247 | protein_coding | deleterious(0.03) | possibly_damaging(0.799) | TCGA-AA-3672-01 | Colorectum | colon adenocarcinoma | Female | >=65 | III/IV | Unknown | Unknown | SD |
| Page: 1 2 3 4 |
Top |
Related drugs of malignant transformation related genes |
| Identification of chemicals and drugs interact with genes involved in malignant transfromation |
| (DGIdb 4.0) |
| Entrez ID | Symbol | Category | Interaction Types | Drug Claim Name | Drug Name | PMIDs |
| Page: 1 |

Copyright 2023-Present -The University of Texas Health Science Center at Houston |