
|
|||||
|
 | |
| |
| |
| |
| |
| |
|
Gene: PNPLA1 |
Gene summary for PNPLA1 |
| Gene information | Species | Human | Gene symbol | PNPLA1 | Gene ID | 285848 |
| Gene name | patatin like phospholipase domain containing 1 | |
| Gene Alias | ARCI10 | |
| Cytomap | 6p21.31 | |
| Gene Type | protein-coding | GO ID | GO:0006629 | UniProtAcc | Q8N8W4 |
Top |
Malignant transformation analysis |
| Identification of the aberrant gene expression in precancerous and cancerous lesions by comparing the gene expression of stem-like cells in diseased tissues with normal stem cells |
| Entrez ID | Symbol | Replicates | Species | Organ | Tissue | Adj P-value | Log2FC | Malignancy |
| 285848 | PNPLA1 | HCC1 | Human | Liver | HCC | 5.10e-04 | 4.65e-01 | 0.5336 |
| 285848 | PNPLA1 | HCC2 | Human | Liver | HCC | 4.15e-09 | 6.49e-01 | 0.5341 |
| 285848 | PNPLA1 | HCC5 | Human | Liver | HCC | 1.57e-04 | 5.85e-01 | 0.4932 |
| Page: 1 |
| Tissue | Expression Dynamics | Abbreviation |
| Liver | 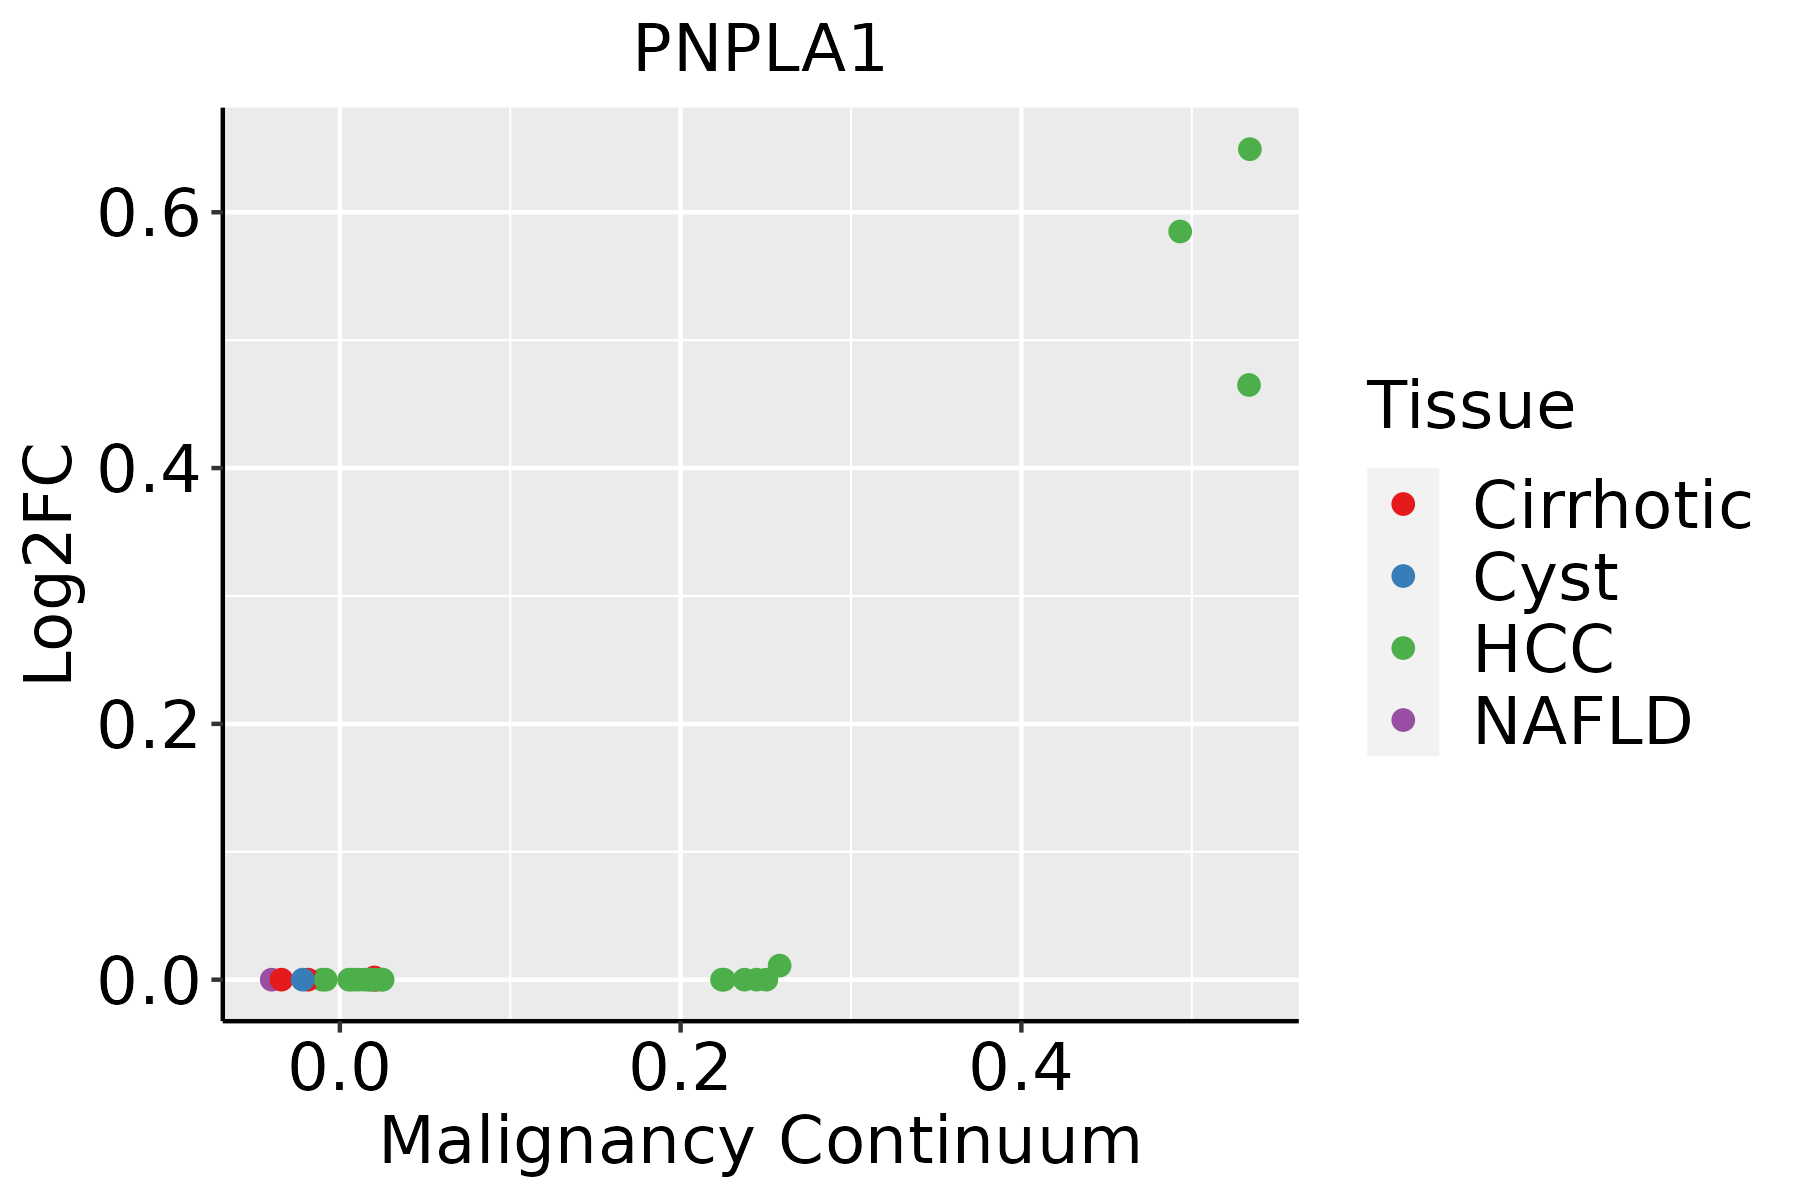 | HCC: Hepatocellular carcinoma |
| NAFLD: Non-alcoholic fatty liver disease |
| ∗log2FC in expression of this searched gene in stem-like cells from each diseased tissue sample relative to stem-like cells in normal samples in each tissue plotted against the malignancy continuum. Samples are colored based on if they are from different disease stage. |
Top |
Malignant transformation related pathway analysis |
| Find out the enriched GO biological processes and KEGG pathways involved in transition from healthy to precancer to cancer |
| Tissue | Disease Stage | Enriched GO biological Processes |
| Colorectum | AD |  |
| Colorectum | SER |  |
| Colorectum | MSS |  |
| Colorectum | MSI-H |  |
| Colorectum | FAP |  |
| ∗Top 15 enriched GO BP terms are showed in the bar plot of each disease state in each tissue. Each row represents a significant GO biological process which is colored according to the -log10(p.adjust). |
| Page: 1 2 3 4 5 6 7 8 9 |
| GO ID | Tissue | Disease Stage | Description | Gene Ratio | Bg Ratio | pvalue | p.adjust | Count |
| GO:004424222 | Liver | HCC | cellular lipid catabolic process | 134/7958 | 214/18723 | 2.07e-09 | 5.79e-08 | 134 |
| GO:00550882 | Liver | HCC | lipid homeostasis | 103/7958 | 167/18723 | 4.27e-07 | 7.18e-06 | 103 |
| GO:004648611 | Liver | HCC | glycerolipid metabolic process | 215/7958 | 392/18723 | 4.54e-07 | 7.49e-06 | 215 |
| GO:001604221 | Liver | HCC | lipid catabolic process | 175/7958 | 320/18723 | 6.50e-06 | 7.88e-05 | 175 |
| GO:00066431 | Liver | HCC | membrane lipid metabolic process | 115/7958 | 203/18723 | 3.17e-05 | 3.22e-04 | 115 |
| GO:00066412 | Liver | HCC | triglyceride metabolic process | 59/7958 | 100/18723 | 6.35e-04 | 3.93e-03 | 59 |
| GO:000663911 | Liver | HCC | acylglycerol metabolic process | 72/7958 | 128/18723 | 1.16e-03 | 6.54e-03 | 72 |
| GO:0006665 | Liver | HCC | sphingolipid metabolic process | 85/7958 | 155/18723 | 1.27e-03 | 6.92e-03 | 85 |
| GO:000663811 | Liver | HCC | neutral lipid metabolic process | 72/7958 | 129/18723 | 1.54e-03 | 8.14e-03 | 72 |
| GO:0046467 | Liver | HCC | membrane lipid biosynthetic process | 78/7958 | 142/18723 | 1.85e-03 | 9.46e-03 | 78 |
| Page: 1 |
| Pathway ID | Tissue | Disease Stage | Description | Gene Ratio | Bg Ratio | pvalue | p.adjust | qvalue | Count |
| Page: 1 |
Top |
Cell-cell communication analysis |
| Identification of potential cell-cell interactions between two cell types and their ligand-receptor pairs for different disease states |
| Ligand | Receptor | LRpair | Pathway | Tissue | Disease Stage |
| Page: 1 |
Top |
Single-cell gene regulatory network inference analysis |
| Find out the significant the regulons (TFs) and the target genes of each regulon across cell types for different disease states |
| TF | Cell Type | Tissue | Disease Stage | Target Gene | RSS | Regulon Activity |
| ∗The dot plots of a searched regulon are shown for all cell subpopulations in each disease state of each tissue based on the regulon specific score inferred using pySCENIC and by calculating the average expression. |
| Page: 1 |
Top |
Somatic mutation of malignant transformation related genes |
| Annotation of somatic variants for genes involved in malignant transformation |
| Hugo Symbol | Variant Class | Variant Classification | dbSNP RS | HGVSc | HGVSp | HGVSp Short | SWISSPROT | BIOTYPE | SIFT | PolyPhen | Tumor Sample Barcode | Tissue | Histology | Sex | Age | Stage | Therapy Types | Drugs | Outcome |
| PNPLA1 | SNV | Missense_Mutation | novel | c.78N>G | p.Phe26Leu | p.F26L | Q8N8W4 | protein_coding | tolerated(0.15) | benign(0.015) | TCGA-5L-AAT1-01 | Breast | breast invasive carcinoma | Female | <65 | III/IV | Hormone Therapy | letrozol | SD |
| PNPLA1 | SNV | Missense_Mutation | novel | c.841A>G | p.Ile281Val | p.I281V | Q8N8W4 | protein_coding | deleterious(0.01) | benign(0.058) | TCGA-AC-A8OS-01 | Breast | breast invasive carcinoma | Female | >=65 | I/II | Unknown | Unknown | SD |
| PNPLA1 | SNV | Missense_Mutation | c.353G>C | p.Gly118Ala | p.G118A | Q8N8W4 | protein_coding | deleterious(0) | probably_damaging(0.924) | TCGA-GI-A2C9-01 | Breast | breast invasive carcinoma | Female | <65 | I/II | Unspecific | SD | ||
| PNPLA1 | insertion | Frame_Shift_Ins | novel | c.397_398insCACCTCCTCCTCATGATTCACCGGCCCAAGGCCAGCACCCCTTCCC | p.Val133AlafsTer29 | p.V133Afs*29 | Q8N8W4 | protein_coding | TCGA-A2-A0CT-01 | Breast | breast invasive carcinoma | Female | >=65 | I/II | Chemotherapy | cytoxan | SD | ||
| PNPLA1 | insertion | Frame_Shift_Ins | novel | c.1220_1221insACAGTTTCTCAGACTTTTCTTATTCTTGTGTGTGTGT | p.Ser408GlnfsTer100 | p.S408Qfs*100 | Q8N8W4 | protein_coding | TCGA-AO-A0J9-01 | Breast | breast invasive carcinoma | Female | <65 | III/IV | Chemotherapy | cyclophosphamide | PD | ||
| PNPLA1 | SNV | Missense_Mutation | c.581N>A | p.Ser194Asn | p.S194N | Q8N8W4 | protein_coding | deleterious(0) | possibly_damaging(0.642) | TCGA-AA-3710-01 | Colorectum | colon adenocarcinoma | Female | >=65 | I/II | Unknown | Unknown | SD | |
| PNPLA1 | SNV | Missense_Mutation | c.1421N>A | p.Ala474Asp | p.A474D | Q8N8W4 | protein_coding | deleterious_low_confidence(0.04) | benign(0.051) | TCGA-AA-A022-01 | Colorectum | colon adenocarcinoma | Female | >=65 | I/II | Unknown | Unknown | SD | |
| PNPLA1 | SNV | Missense_Mutation | novel | c.1136N>G | p.Lys379Arg | p.K379R | Q8N8W4 | protein_coding | tolerated_low_confidence(0.76) | benign(0.007) | TCGA-AZ-4315-01 | Colorectum | colon adenocarcinoma | Male | <65 | I/II | Unknown | Unknown | SD |
| PNPLA1 | SNV | Missense_Mutation | rs754166062 | c.898N>T | p.Arg300Trp | p.R300W | Q8N8W4 | protein_coding | deleterious(0) | benign(0.251) | TCGA-CA-6718-01 | Colorectum | colon adenocarcinoma | Male | <65 | I/II | Unknown | Unknown | PD |
| PNPLA1 | SNV | Missense_Mutation | rs746320168 | c.637N>G | p.Met213Val | p.M213V | Q8N8W4 | protein_coding | tolerated(0.36) | benign(0.003) | TCGA-G4-6302-01 | Colorectum | colon adenocarcinoma | Female | >=65 | I/II | Unknown | Unknown | SD |
| Page: 1 2 3 4 5 6 7 |
Top |
Related drugs of malignant transformation related genes |
| Identification of chemicals and drugs interact with genes involved in malignant transfromation |
| (DGIdb 4.0) |
| Entrez ID | Symbol | Category | Interaction Types | Drug Claim Name | Drug Name | PMIDs |
| Page: 1 |

Copyright 2023-Present -The University of Texas Health Science Center at Houston |