
|
|||||
|
 | |
| |
| |
| |
| |
| |
|
Gene: PNP |
Gene summary for PNP |
| Gene information | Species | Human | Gene symbol | PNP | Gene ID | 4860 |
| Gene name | purine nucleoside phosphorylase | |
| Gene Alias | NP | |
| Cytomap | 14q11.2 | |
| Gene Type | protein-coding | GO ID | GO:0000255 | UniProtAcc | P00491 |
Top |
Malignant transformation analysis |
| Identification of the aberrant gene expression in precancerous and cancerous lesions by comparing the gene expression of stem-like cells in diseased tissues with normal stem cells |
| Entrez ID | Symbol | Replicates | Species | Organ | Tissue | Adj P-value | Log2FC | Malignancy |
| 4860 | PNP | LZE5T | Human | Esophagus | ESCC | 2.61e-04 | -2.12e-01 | 0.0514 |
| 4860 | PNP | LZE7T | Human | Esophagus | ESCC | 1.30e-04 | 4.39e-02 | 0.0667 |
| 4860 | PNP | LZE8T | Human | Esophagus | ESCC | 3.72e-02 | -1.81e-01 | 0.067 |
| 4860 | PNP | LZE20T | Human | Esophagus | ESCC | 4.33e-05 | -6.62e-02 | 0.0662 |
| 4860 | PNP | LZE22D1 | Human | Esophagus | HGIN | 8.91e-05 | -3.66e-01 | 0.0595 |
| 4860 | PNP | P2T-E | Human | Esophagus | ESCC | 3.23e-05 | 3.00e-01 | 0.1177 |
| 4860 | PNP | P4T-E | Human | Esophagus | ESCC | 2.76e-14 | 9.17e-01 | 0.1323 |
| 4860 | PNP | P5T-E | Human | Esophagus | ESCC | 7.78e-13 | 6.22e-01 | 0.1327 |
| 4860 | PNP | P8T-E | Human | Esophagus | ESCC | 2.62e-05 | -7.14e-02 | 0.0889 |
| 4860 | PNP | P10T-E | Human | Esophagus | ESCC | 8.64e-04 | -2.14e-01 | 0.116 |
| 4860 | PNP | P11T-E | Human | Esophagus | ESCC | 2.32e-08 | 1.17e+00 | 0.1426 |
| 4860 | PNP | P12T-E | Human | Esophagus | ESCC | 1.55e-04 | 2.69e-01 | 0.1122 |
| 4860 | PNP | P15T-E | Human | Esophagus | ESCC | 7.28e-14 | 7.41e-01 | 0.1149 |
| 4860 | PNP | P16T-E | Human | Esophagus | ESCC | 3.18e-05 | 7.02e-02 | 0.1153 |
| 4860 | PNP | P21T-E | Human | Esophagus | ESCC | 3.63e-14 | 4.45e-01 | 0.1617 |
| 4860 | PNP | P22T-E | Human | Esophagus | ESCC | 7.28e-03 | 1.98e-01 | 0.1236 |
| 4860 | PNP | P23T-E | Human | Esophagus | ESCC | 5.50e-03 | 3.36e-01 | 0.108 |
| 4860 | PNP | P24T-E | Human | Esophagus | ESCC | 4.31e-03 | 2.39e-01 | 0.1287 |
| 4860 | PNP | P26T-E | Human | Esophagus | ESCC | 1.67e-07 | 4.57e-01 | 0.1276 |
| 4860 | PNP | P27T-E | Human | Esophagus | ESCC | 1.88e-11 | 5.75e-01 | 0.1055 |
| Page: 1 2 3 4 5 |
| Tissue | Expression Dynamics | Abbreviation |
| Esophagus | 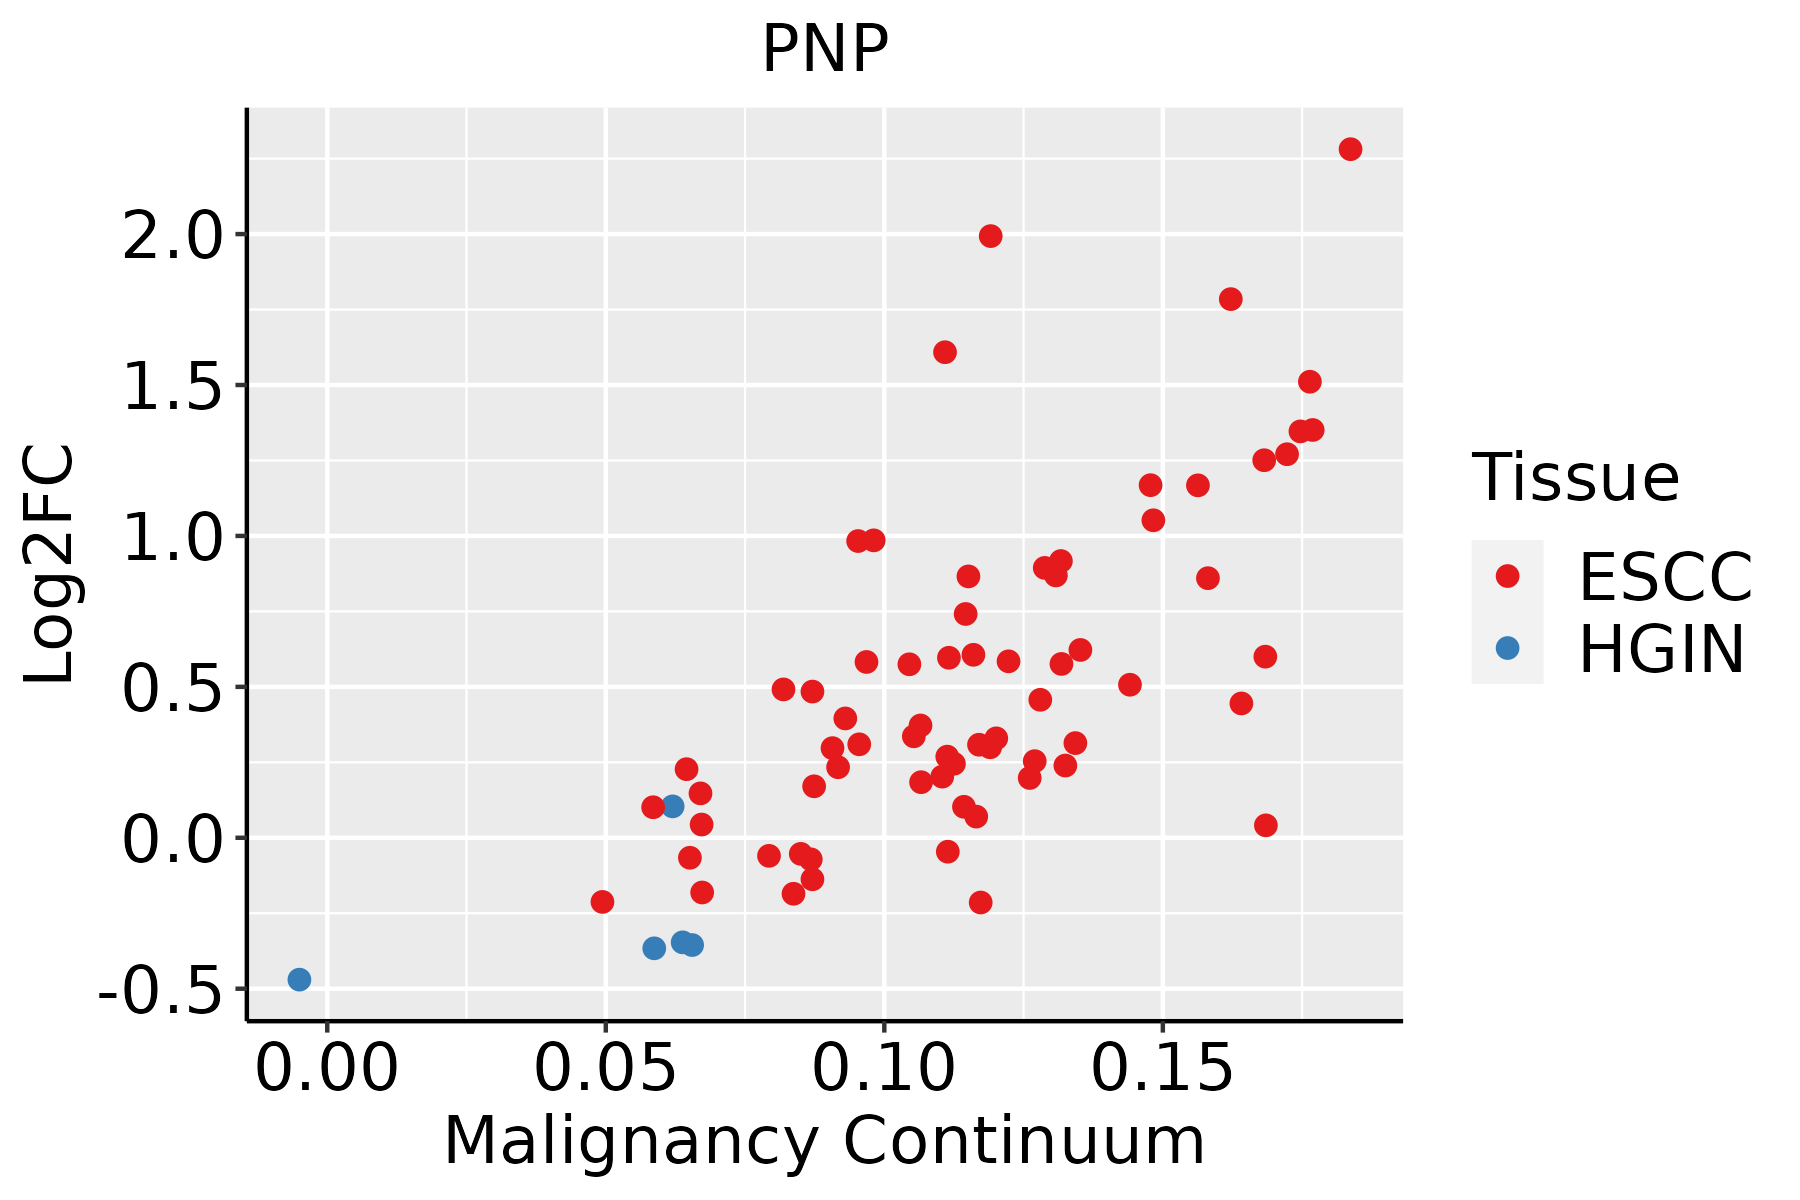 | ESCC: Esophageal squamous cell carcinoma |
| HGIN: High-grade intraepithelial neoplasias | ||
| LGIN: Low-grade intraepithelial neoplasias | ||
| Liver |  | HCC: Hepatocellular carcinoma |
| NAFLD: Non-alcoholic fatty liver disease | ||
| Oral Cavity |  | EOLP: Erosive Oral lichen planus |
| LP: leukoplakia | ||
| NEOLP: Non-erosive oral lichen planus | ||
| OSCC: Oral squamous cell carcinoma | ||
| Prostate | 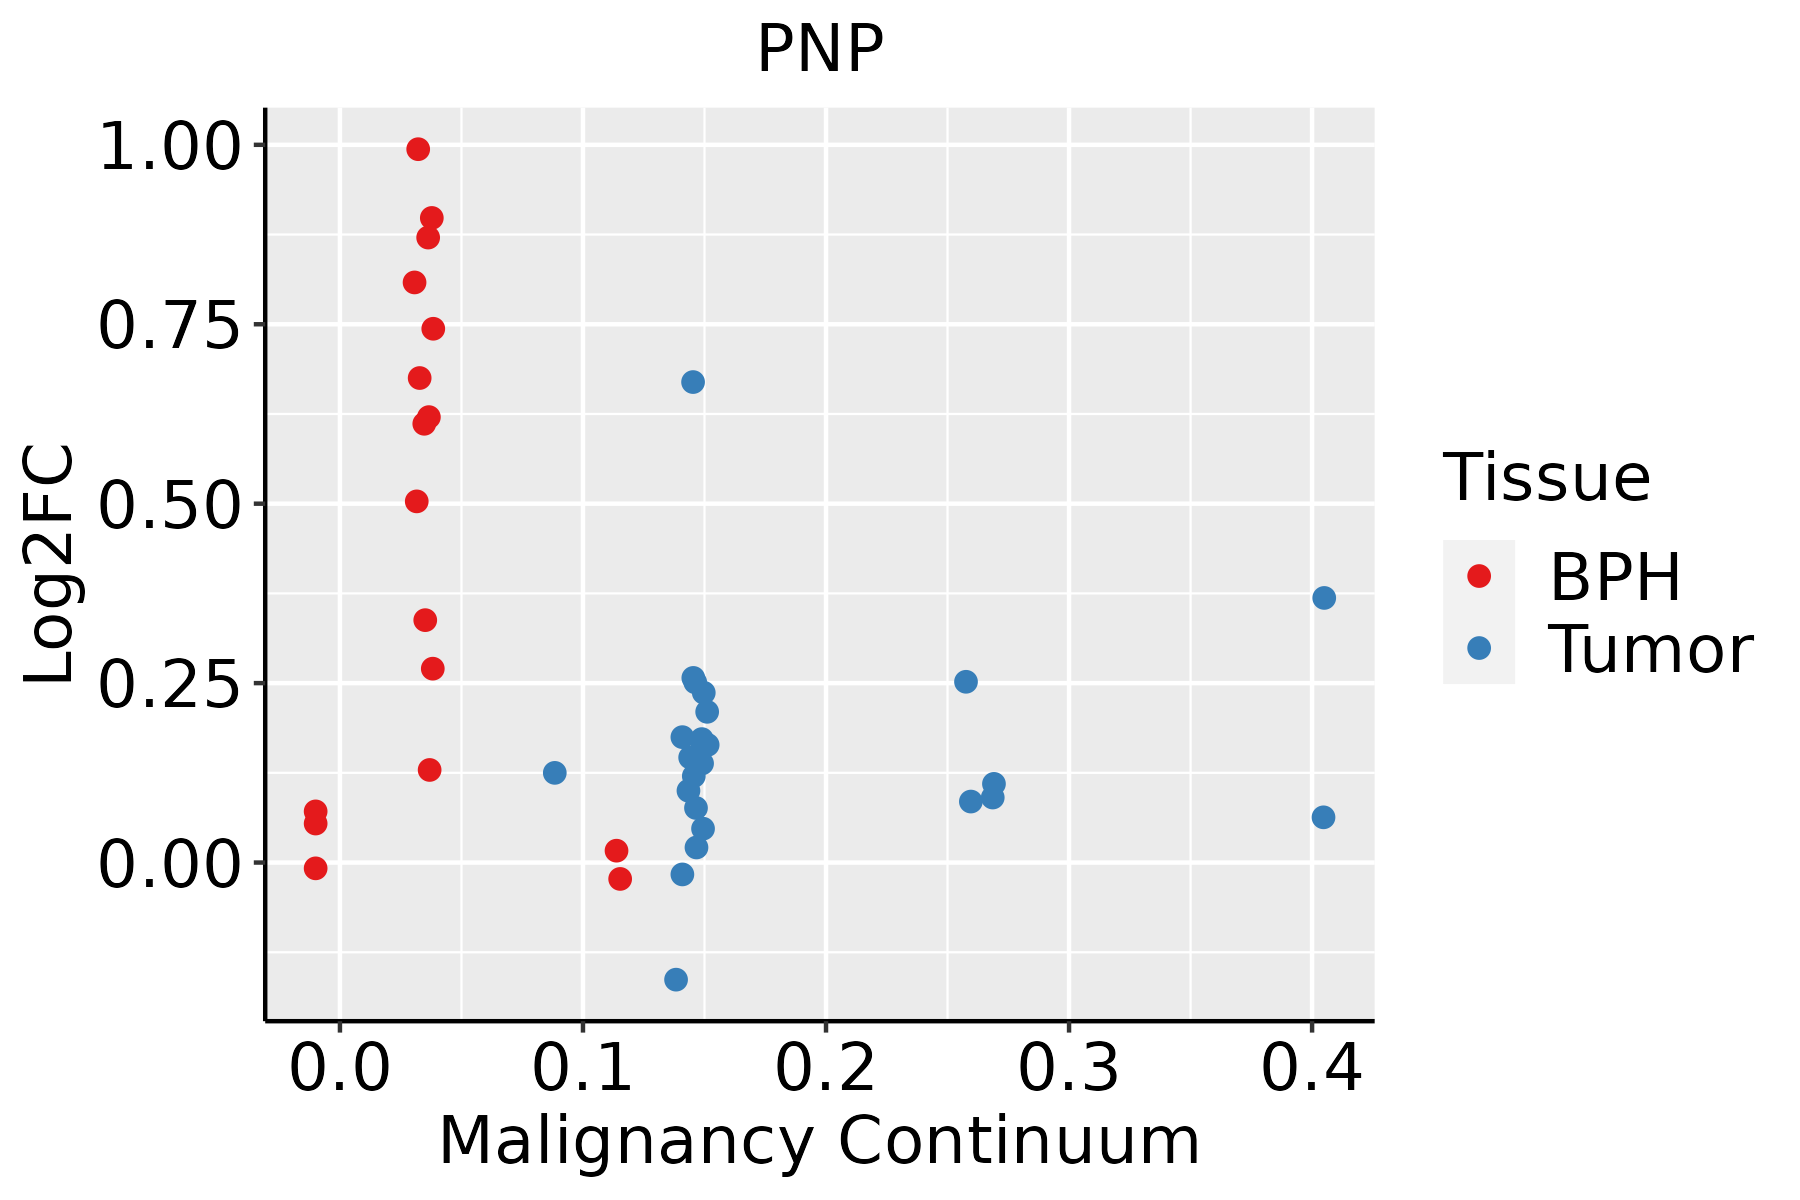 | BPH: Benign Prostatic Hyperplasia |
| Skin | 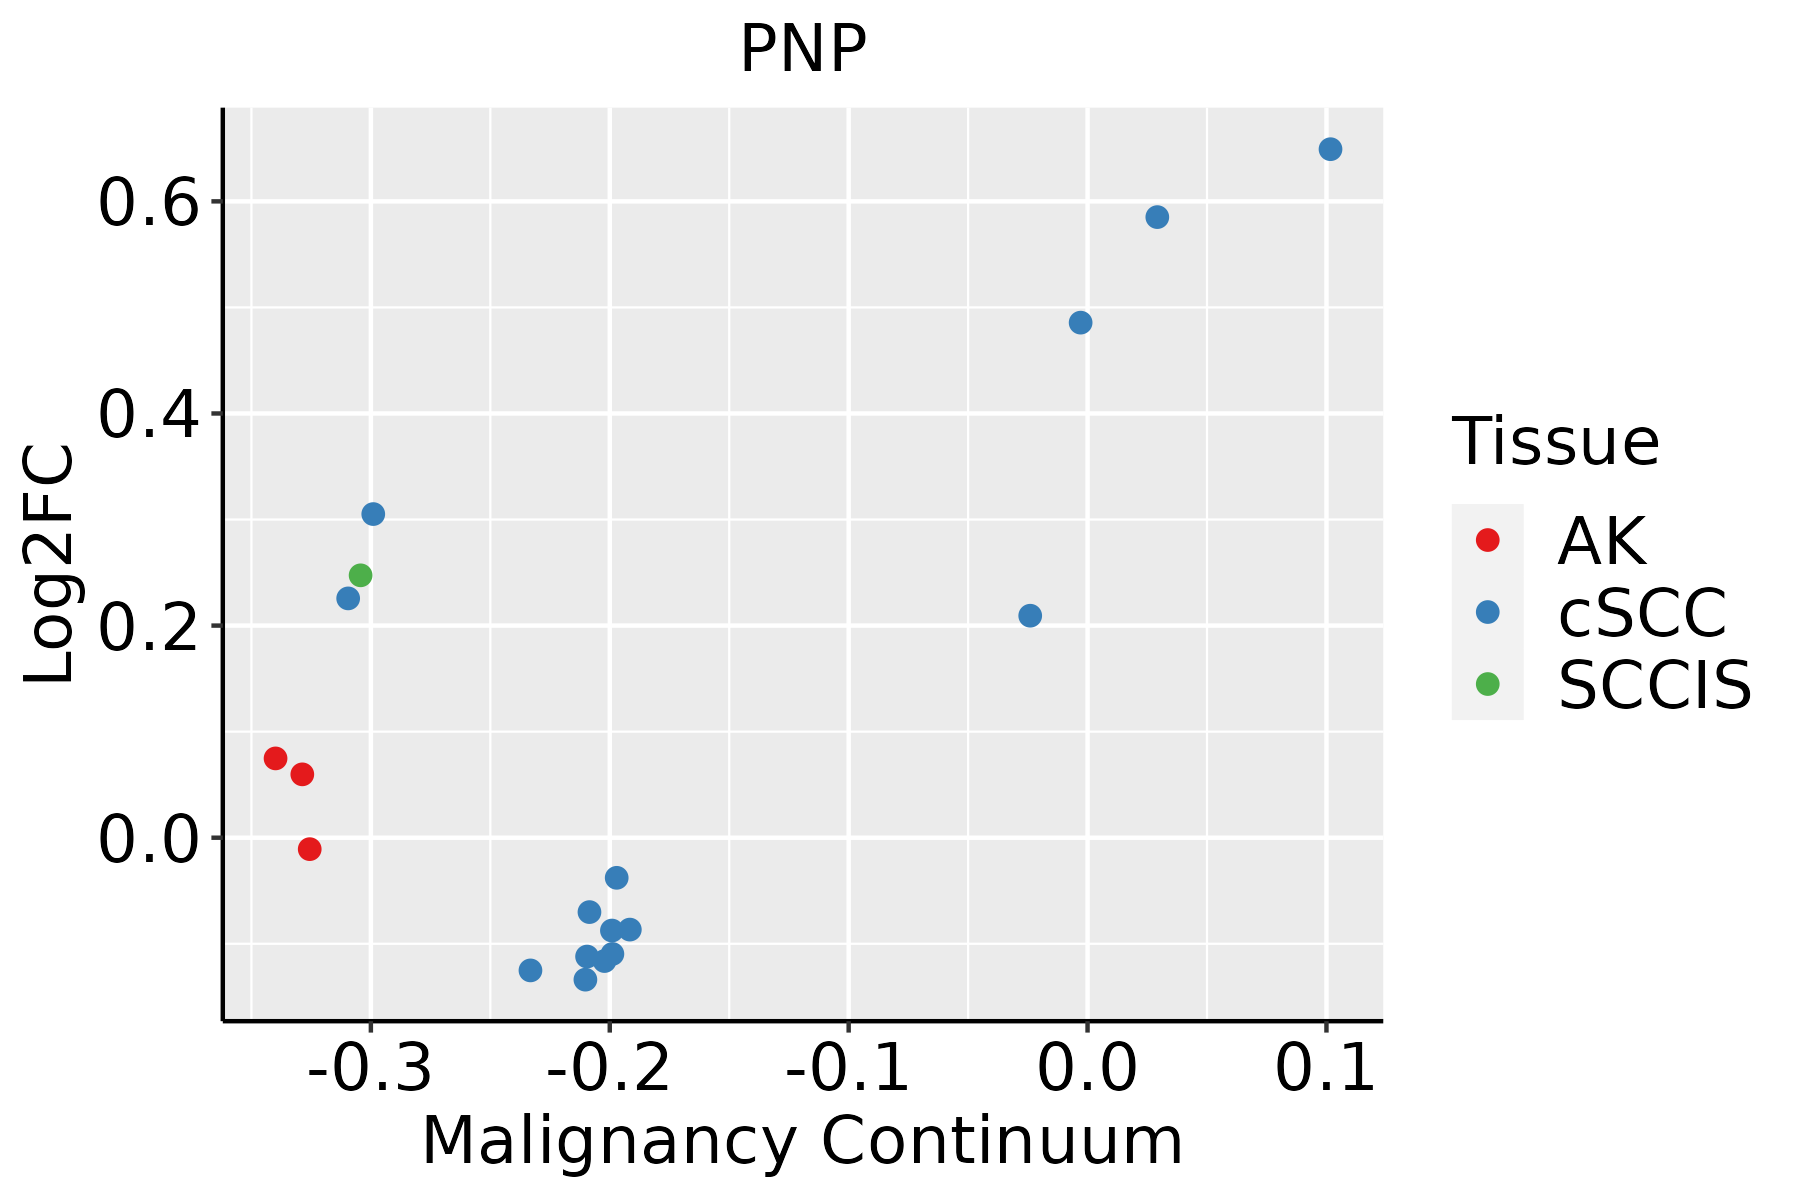 | AK: Actinic keratosis |
| cSCC: Cutaneous squamous cell carcinoma | ||
| SCCIS:squamous cell carcinoma in situ |
| ∗log2FC in expression of this searched gene in stem-like cells from each diseased tissue sample relative to stem-like cells in normal samples in each tissue plotted against the malignancy continuum. Samples are colored based on if they are from different disease stage. |
Top |
Malignant transformation related pathway analysis |
| Find out the enriched GO biological processes and KEGG pathways involved in transition from healthy to precancer to cancer |
| Tissue | Disease Stage | Enriched GO biological Processes |
| Colorectum | AD |  |
| Colorectum | SER |  |
| Colorectum | MSS |  |
| Colorectum | MSI-H |  |
| Colorectum | FAP |  |
| ∗Top 15 enriched GO BP terms are showed in the bar plot of each disease state in each tissue. Each row represents a significant GO biological process which is colored according to the -log10(p.adjust). |
| Page: 1 2 3 4 5 6 7 8 9 |
| GO ID | Tissue | Disease Stage | Description | Gene Ratio | Bg Ratio | pvalue | p.adjust | Count |
| GO:0009896 | Colorectum | AD | positive regulation of catabolic process | 180/3918 | 492/18723 | 4.33e-16 | 1.94e-13 | 180 |
| GO:0031331 | Colorectum | AD | positive regulation of cellular catabolic process | 156/3918 | 427/18723 | 4.68e-14 | 1.05e-11 | 156 |
| GO:0006066 | Colorectum | AD | alcohol metabolic process | 106/3918 | 353/18723 | 3.02e-05 | 5.57e-04 | 106 |
| GO:0016042 | Colorectum | AD | lipid catabolic process | 97/3918 | 320/18723 | 4.31e-05 | 7.56e-04 | 97 |
| GO:0044242 | Colorectum | AD | cellular lipid catabolic process | 66/3918 | 214/18723 | 3.96e-04 | 4.50e-03 | 66 |
| GO:0034308 | Colorectum | AD | primary alcohol metabolic process | 35/3918 | 102/18723 | 1.16e-03 | 1.05e-02 | 35 |
| GO:0010876 | Colorectum | AD | lipid localization | 120/3918 | 448/18723 | 1.59e-03 | 1.33e-02 | 120 |
| GO:0045017 | Colorectum | AD | glycerolipid biosynthetic process | 69/3918 | 252/18723 | 8.33e-03 | 4.88e-02 | 69 |
| GO:00098961 | Colorectum | SER | positive regulation of catabolic process | 132/2897 | 492/18723 | 4.16e-11 | 6.72e-09 | 132 |
| GO:00313311 | Colorectum | SER | positive regulation of cellular catabolic process | 114/2897 | 427/18723 | 1.22e-09 | 1.27e-07 | 114 |
| GO:00160421 | Colorectum | SER | lipid catabolic process | 77/2897 | 320/18723 | 3.52e-05 | 9.18e-04 | 77 |
| GO:00060661 | Colorectum | SER | alcohol metabolic process | 79/2897 | 353/18723 | 3.50e-04 | 5.50e-03 | 79 |
| GO:00442421 | Colorectum | SER | cellular lipid catabolic process | 51/2897 | 214/18723 | 8.60e-04 | 1.05e-02 | 51 |
| GO:0046486 | Colorectum | SER | glycerolipid metabolic process | 82/2897 | 392/18723 | 2.26e-03 | 2.17e-02 | 82 |
| GO:00450171 | Colorectum | SER | glycerolipid biosynthetic process | 55/2897 | 252/18723 | 4.47e-03 | 3.56e-02 | 55 |
| GO:00343081 | Colorectum | SER | primary alcohol metabolic process | 26/2897 | 102/18723 | 5.87e-03 | 4.29e-02 | 26 |
| GO:00098962 | Colorectum | MSS | positive regulation of catabolic process | 163/3467 | 492/18723 | 3.10e-15 | 9.22e-13 | 163 |
| GO:00313312 | Colorectum | MSS | positive regulation of cellular catabolic process | 140/3467 | 427/18723 | 7.02e-13 | 1.33e-10 | 140 |
| GO:00060662 | Colorectum | MSS | alcohol metabolic process | 92/3467 | 353/18723 | 2.57e-04 | 3.46e-03 | 92 |
| GO:00108761 | Colorectum | MSS | lipid localization | 104/3467 | 448/18723 | 6.76e-03 | 4.38e-02 | 104 |
| Page: 1 2 3 4 5 6 7 8 9 10 11 12 13 14 15 16 17 18 19 20 21 22 23 24 25 26 27 28 29 30 31 32 33 34 35 36 37 38 39 40 41 42 43 44 45 46 47 48 49 50 51 52 53 54 |
| Pathway ID | Tissue | Disease Stage | Description | Gene Ratio | Bg Ratio | pvalue | p.adjust | qvalue | Count |
| hsa012325 | Esophagus | ESCC | Nucleotide metabolism | 59/4205 | 85/8465 | 1.67e-04 | 6.58e-04 | 3.37e-04 | 59 |
| hsa0123212 | Esophagus | ESCC | Nucleotide metabolism | 59/4205 | 85/8465 | 1.67e-04 | 6.58e-04 | 3.37e-04 | 59 |
| hsa01232 | Liver | Cirrhotic | Nucleotide metabolism | 39/2530 | 85/8465 | 1.27e-03 | 6.73e-03 | 4.15e-03 | 39 |
| hsa012321 | Liver | Cirrhotic | Nucleotide metabolism | 39/2530 | 85/8465 | 1.27e-03 | 6.73e-03 | 4.15e-03 | 39 |
| hsa012322 | Liver | HCC | Nucleotide metabolism | 59/4020 | 85/8465 | 3.30e-05 | 1.88e-04 | 1.04e-04 | 59 |
| hsa012323 | Liver | HCC | Nucleotide metabolism | 59/4020 | 85/8465 | 3.30e-05 | 1.88e-04 | 1.04e-04 | 59 |
| hsa012324 | Oral cavity | OSCC | Nucleotide metabolism | 54/3704 | 85/8465 | 1.78e-04 | 5.95e-04 | 3.03e-04 | 54 |
| hsa0123211 | Oral cavity | OSCC | Nucleotide metabolism | 54/3704 | 85/8465 | 1.78e-04 | 5.95e-04 | 3.03e-04 | 54 |
| Page: 1 |
Top |
Cell-cell communication analysis |
| Identification of potential cell-cell interactions between two cell types and their ligand-receptor pairs for different disease states |
| Ligand | Receptor | LRpair | Pathway | Tissue | Disease Stage |
| Page: 1 |
Top |
Single-cell gene regulatory network inference analysis |
| Find out the significant the regulons (TFs) and the target genes of each regulon across cell types for different disease states |
| TF | Cell Type | Tissue | Disease Stage | Target Gene | RSS | Regulon Activity |
| ∗The dot plots of a searched regulon are shown for all cell subpopulations in each disease state of each tissue based on the regulon specific score inferred using pySCENIC and by calculating the average expression. |
| Page: 1 |
Top |
Somatic mutation of malignant transformation related genes |
| Annotation of somatic variants for genes involved in malignant transformation |
| Hugo Symbol | Variant Class | Variant Classification | dbSNP RS | HGVSc | HGVSp | HGVSp Short | SWISSPROT | BIOTYPE | SIFT | PolyPhen | Tumor Sample Barcode | Tissue | Histology | Sex | Age | Stage | Therapy Types | Drugs | Outcome |
| PNP | SNV | Missense_Mutation | novel | c.416N>T | p.Pro139Leu | p.P139L | P00491 | protein_coding | tolerated(0.53) | benign(0.298) | TCGA-BH-A0HQ-01 | Breast | breast invasive carcinoma | Female | <65 | I/II | Hormone Therapy | arimidex | SD |
| PNP | insertion | Nonsense_Mutation | novel | c.801_802insCCCCTTGTTCAGTAGCCTCTTCTTTAAGAA | p.Ala267_Ala268insProLeuValGlnTerProLeuLeuTerGlu | p.A267_A268insPLVQ*PLL*E | P00491 | protein_coding | TCGA-AN-A03X-01 | Breast | breast invasive carcinoma | Female | >=65 | I/II | Unknown | Unknown | SD | ||
| PNP | deletion | Frame_Shift_Del | novel | c.134delN | p.Gln46ArgfsTer28 | p.Q46Rfs*28 | P00491 | protein_coding | TCGA-EW-A2FV-01 | Breast | breast invasive carcinoma | Female | <65 | III/IV | Chemotherapy | docetaxel | SD | ||
| PNP | SNV | Missense_Mutation | novel | c.611C>T | p.Ala204Val | p.A204V | P00491 | protein_coding | deleterious(0) | benign(0.158) | TCGA-AA-3845-01 | Colorectum | colon adenocarcinoma | Female | >=65 | I/II | Unknown | Unknown | PD |
| PNP | SNV | Missense_Mutation | rs150531909 | c.482N>T | p.Ala161Val | p.A161V | P00491 | protein_coding | tolerated(0.07) | benign(0.183) | TCGA-AD-A5EJ-01 | Colorectum | colon adenocarcinoma | Female | >=65 | I/II | Unknown | Unknown | SD |
| PNP | SNV | Missense_Mutation | c.839N>T | p.Ala280Val | p.A280V | P00491 | protein_coding | tolerated(0.16) | benign(0.012) | TCGA-NH-A5IV-01 | Colorectum | colon adenocarcinoma | Female | >=65 | I/II | Unknown | Unknown | SD | |
| PNP | SNV | Missense_Mutation | rs755640590 | c.646N>A | p.Ala216Thr | p.A216T | P00491 | protein_coding | deleterious(0.05) | probably_damaging(0.914) | TCGA-F5-6814-01 | Colorectum | rectum adenocarcinoma | Male | <65 | I/II | Unknown | Unknown | SD |
| PNP | SNV | Missense_Mutation | novel | c.71N>A | p.Arg24Gln | p.R24Q | P00491 | protein_coding | tolerated(0.06) | benign(0.021) | TCGA-AP-A1DV-01 | Endometrium | uterine corpus endometrioid carcinoma | Female | <65 | I/II | Unknown | Unknown | SD |
| PNP | SNV | Missense_Mutation | rs769652649 | c.472N>T | p.Arg158Cys | p.R158C | P00491 | protein_coding | deleterious(0) | possibly_damaging(0.792) | TCGA-AP-A1DV-01 | Endometrium | uterine corpus endometrioid carcinoma | Female | <65 | I/II | Unknown | Unknown | SD |
| PNP | SNV | Missense_Mutation | novel | c.819N>T | p.Gln273His | p.Q273H | P00491 | protein_coding | deleterious(0.03) | benign(0.003) | TCGA-AX-A06F-01 | Endometrium | uterine corpus endometrioid carcinoma | Female | <65 | III/IV | Chemotherapy | carboplatin | SD |
| Page: 1 2 3 |
Top |
Related drugs of malignant transformation related genes |
| Identification of chemicals and drugs interact with genes involved in malignant transfromation |
| (DGIdb 4.0) |
| Entrez ID | Symbol | Category | Interaction Types | Drug Claim Name | Drug Name | PMIDs |
| 4860 | PNP | ENZYME, DRUGGABLE GENOME | inhibitor | CHEMBL550755 | FORODESINE HYDROCHLORIDE | |
| 4860 | PNP | ENZYME, DRUGGABLE GENOME | Guanosine | GUANOSINE | ||
| 4860 | PNP | ENZYME, DRUGGABLE GENOME | ULODESINE | ULODESINE | ||
| 4860 | PNP | ENZYME, DRUGGABLE GENOME | FORODESINE | FORODESINE | ||
| 4860 | PNP | ENZYME, DRUGGABLE GENOME | BCX-3408 | ULODESINE | ||
| 4860 | PNP | ENZYME, DRUGGABLE GENOME | 2'3'-Dideoxyinosine | |||
| 4860 | PNP | ENZYME, DRUGGABLE GENOME | FORODESINE HYDROCHLORIDE | FORODESINE HYDROCHLORIDE | 19386496,19386498 | |
| 4860 | PNP | ENZYME, DRUGGABLE GENOME | Peldesine | PELDESINE | ||
| 4860 | PNP | ENZYME, DRUGGABLE GENOME | inhibitor | 252166484 | FORODESINE | |
| 4860 | PNP | ENZYME, DRUGGABLE GENOME | Forodesine | FORODESINE |
| Page: 1 |

Copyright 2023-Present -The University of Texas Health Science Center at Houston |