
|
|||||
|
 | |
| |
| |
| |
| |
| |
|
Gene: PNMT |
Gene summary for PNMT |
| Gene information | Species | Human | Gene symbol | PNMT | Gene ID | 5409 |
| Gene name | phenylethanolamine N-methyltransferase | |
| Gene Alias | PENT | |
| Cytomap | 17q12 | |
| Gene Type | protein-coding | GO ID | GO:0006576 | UniProtAcc | P11086 |
Top |
Malignant transformation analysis |
| Identification of the aberrant gene expression in precancerous and cancerous lesions by comparing the gene expression of stem-like cells in diseased tissues with normal stem cells |
| Entrez ID | Symbol | Replicates | Species | Organ | Tissue | Adj P-value | Log2FC | Malignancy |
| 5409 | PNMT | GSM4909290 | Human | Breast | IDC | 1.50e-18 | 6.45e-01 | 0.2096 |
| 5409 | PNMT | GSM4909293 | Human | Breast | IDC | 4.61e-07 | 3.48e-01 | 0.1581 |
| 5409 | PNMT | GSM4909294 | Human | Breast | IDC | 9.45e-27 | 1.05e+00 | 0.2022 |
| 5409 | PNMT | NCCBC5 | Human | Breast | DCIS | 1.49e-03 | 3.76e-01 | 0.2046 |
| 5409 | PNMT | P2 | Human | Breast | IDC | 2.32e-07 | 4.23e-01 | 0.21 |
| 5409 | PNMT | S014 | Human | Liver | HCC | 3.33e-15 | 1.13e+00 | 0.2254 |
| 5409 | PNMT | S015 | Human | Liver | HCC | 2.91e-14 | 1.11e+00 | 0.2375 |
| 5409 | PNMT | S016 | Human | Liver | HCC | 1.30e-26 | 1.23e+00 | 0.2243 |
| Page: 1 |
| Tissue | Expression Dynamics | Abbreviation |
| Breast | 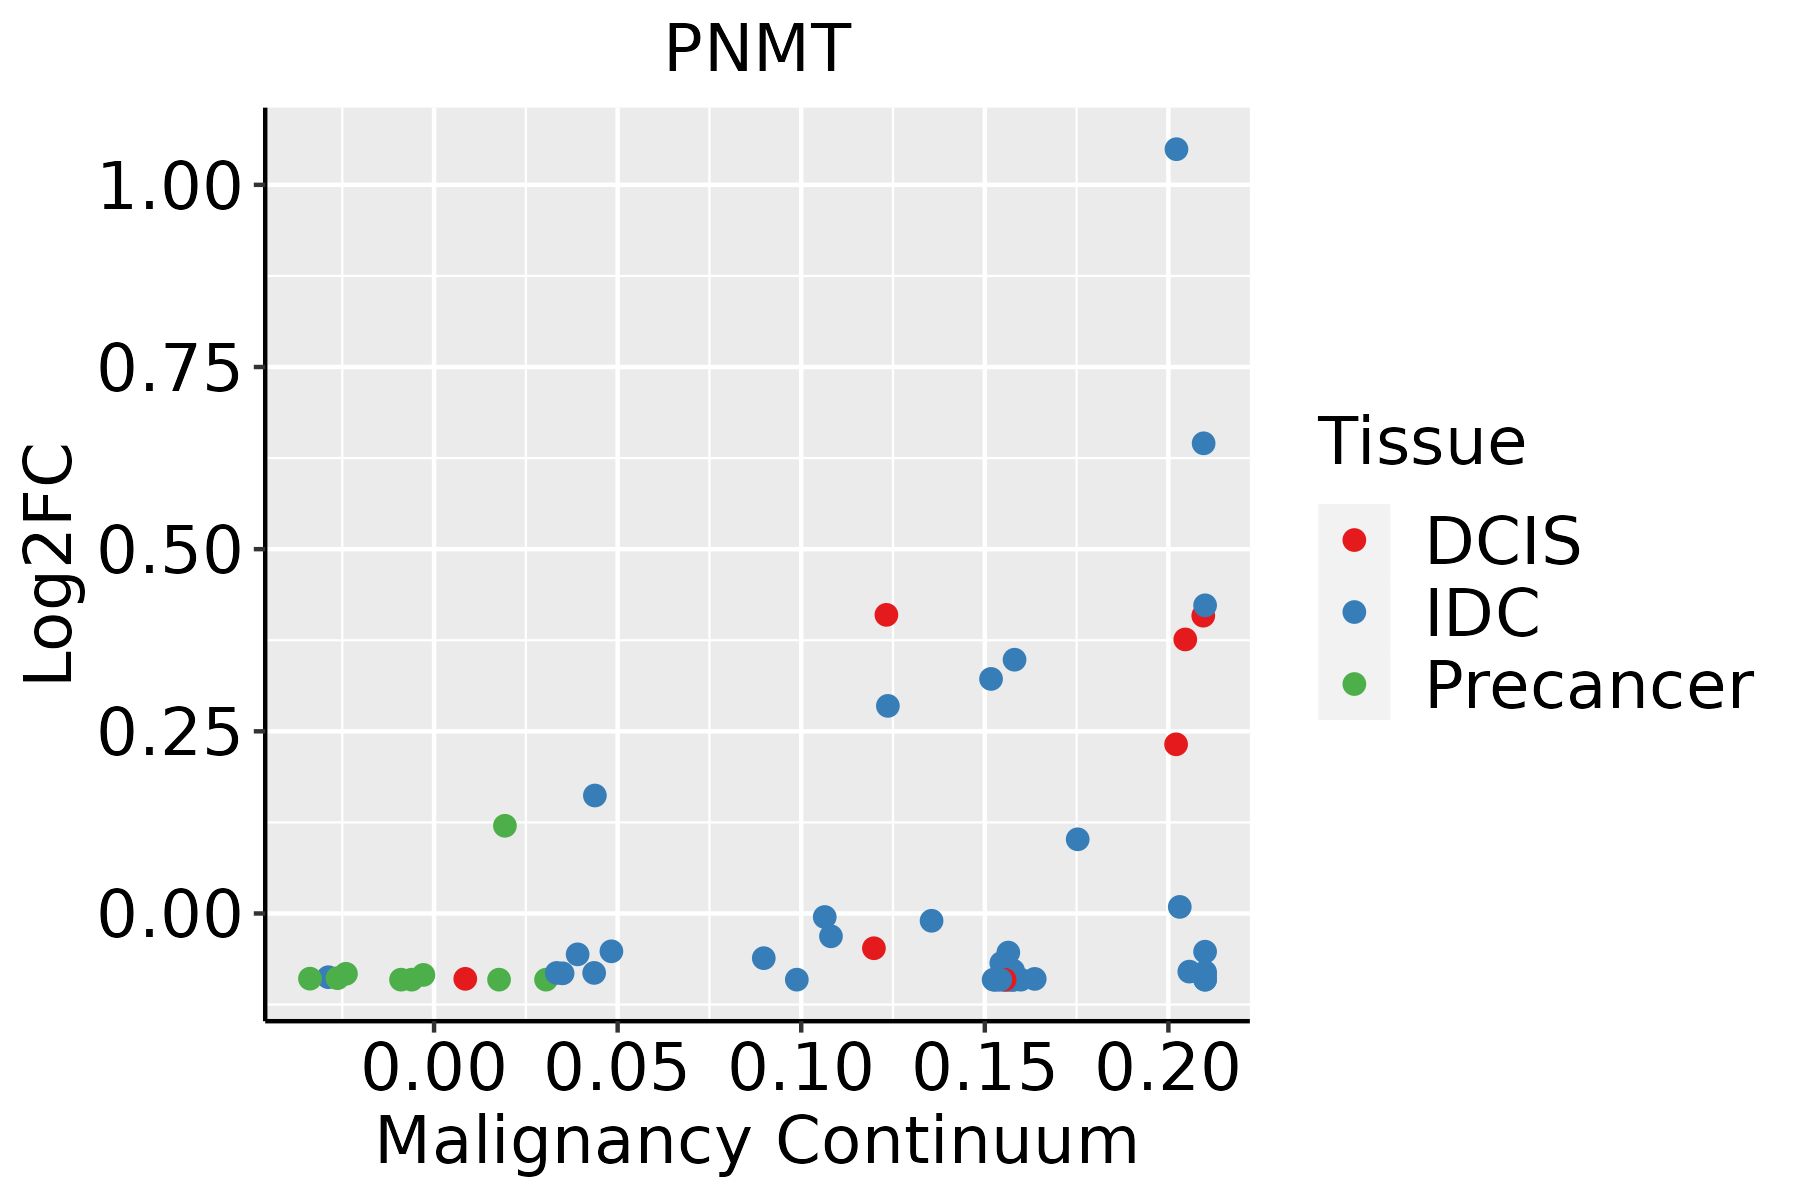 | IDC: Invasive ductal carcinoma |
| DCIS: Ductal carcinoma in situ | ||
| Precancer(BRCA1-mut): Precancerous lesion from BRCA1 mutation carriers | ||
| Liver | 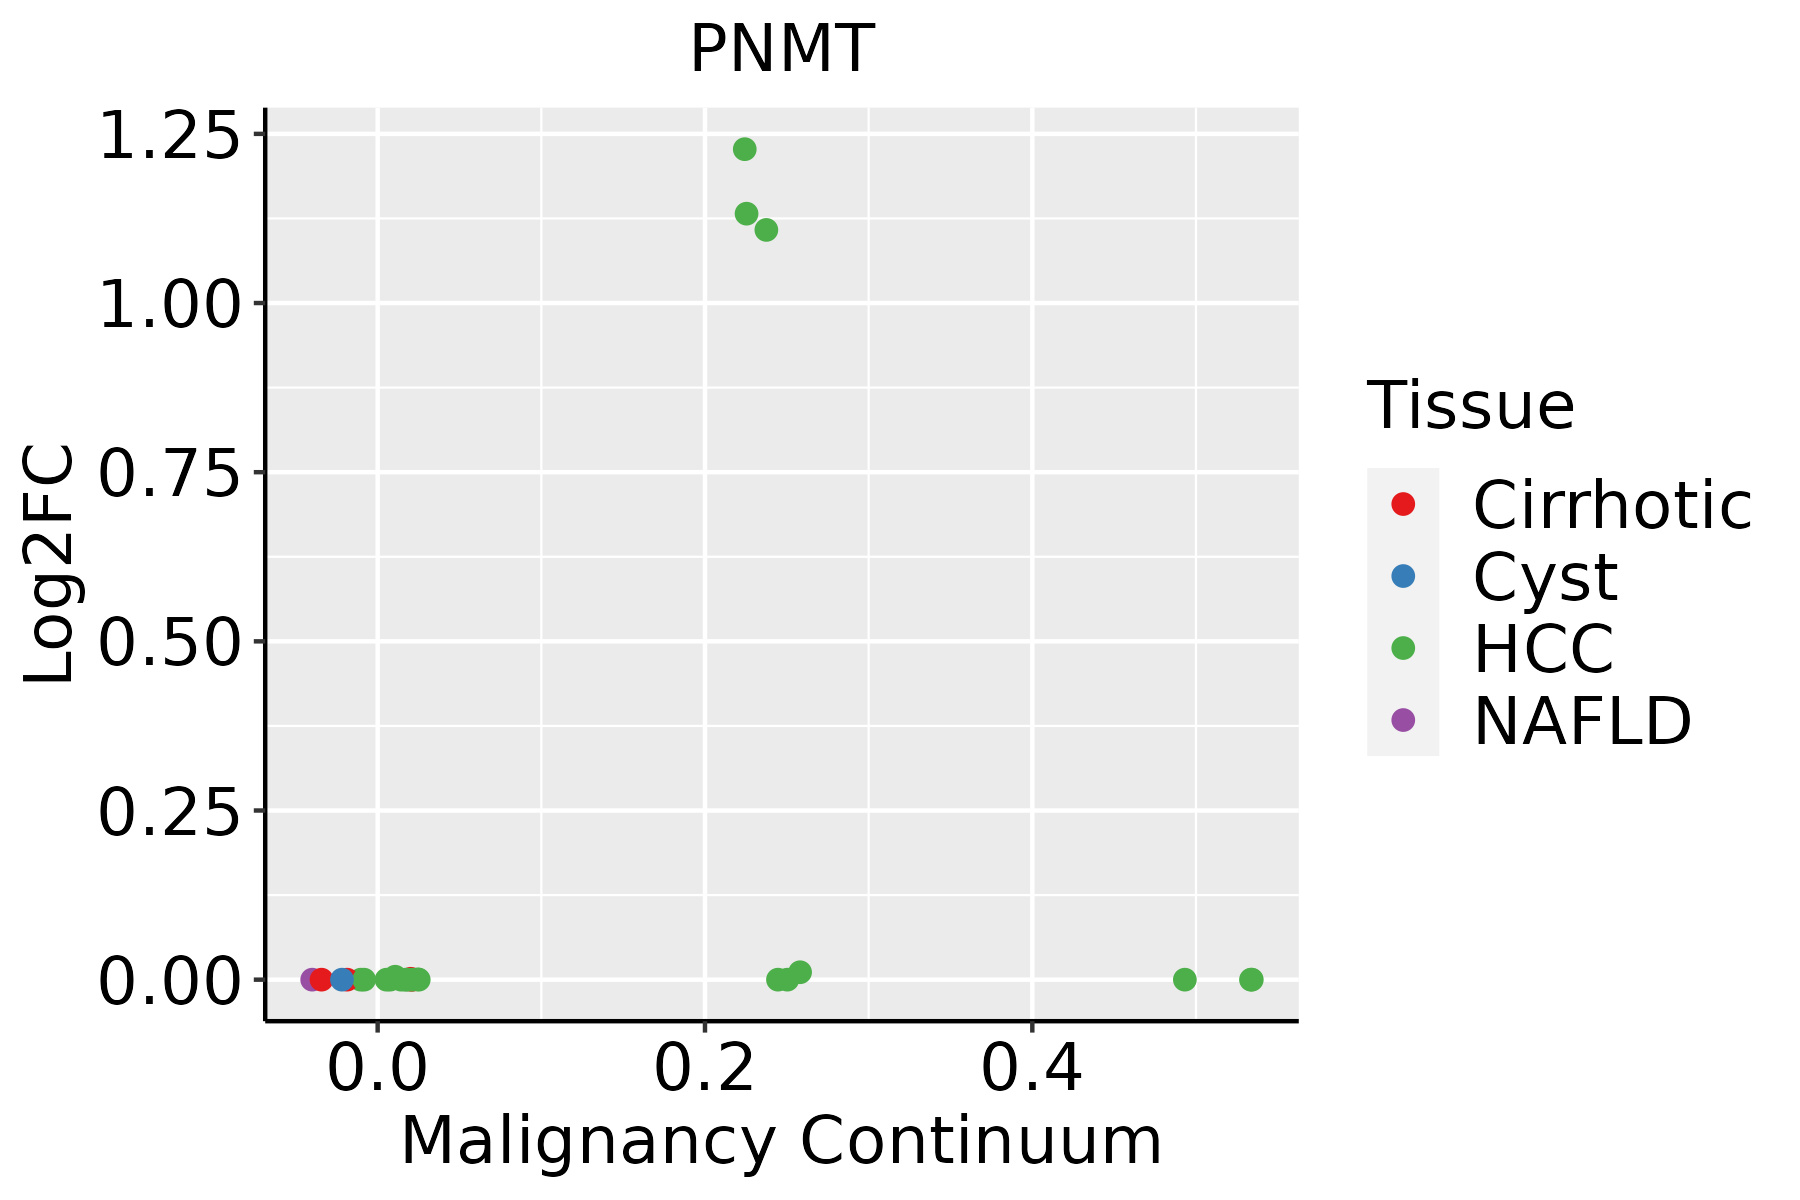 | HCC: Hepatocellular carcinoma |
| NAFLD: Non-alcoholic fatty liver disease |
| ∗log2FC in expression of this searched gene in stem-like cells from each diseased tissue sample relative to stem-like cells in normal samples in each tissue plotted against the malignancy continuum. Samples are colored based on if they are from different disease stage. |
Top |
Malignant transformation related pathway analysis |
| Find out the enriched GO biological processes and KEGG pathways involved in transition from healthy to precancer to cancer |
| Tissue | Disease Stage | Enriched GO biological Processes |
| Colorectum | AD |  |
| Colorectum | SER |  |
| Colorectum | MSS |  |
| Colorectum | MSI-H |  |
| Colorectum | FAP |  |
| ∗Top 15 enriched GO BP terms are showed in the bar plot of each disease state in each tissue. Each row represents a significant GO biological process which is colored according to the -log10(p.adjust). |
| Page: 1 2 3 4 5 6 7 8 9 |
| GO ID | Tissue | Disease Stage | Description | Gene Ratio | Bg Ratio | pvalue | p.adjust | Count |
| GO:00424011 | Breast | IDC | cellular biogenic amine biosynthetic process | 8/1434 | 37/18723 | 6.04e-03 | 4.33e-02 | 8 |
| GO:00093091 | Breast | IDC | amine biosynthetic process | 8/1434 | 38/18723 | 7.15e-03 | 4.92e-02 | 8 |
| GO:00424012 | Breast | DCIS | cellular biogenic amine biosynthetic process | 8/1390 | 37/18723 | 5.01e-03 | 3.72e-02 | 8 |
| GO:00093092 | Breast | DCIS | amine biosynthetic process | 8/1390 | 38/18723 | 5.94e-03 | 4.25e-02 | 8 |
| GO:0032259 | Liver | HCC | methylation | 206/7958 | 364/18723 | 3.35e-08 | 7.53e-07 | 206 |
| GO:19016172 | Liver | HCC | organic hydroxy compound biosynthetic process | 129/7958 | 237/18723 | 1.32e-04 | 1.08e-03 | 129 |
| Page: 1 |
| Pathway ID | Tissue | Disease Stage | Description | Gene Ratio | Bg Ratio | pvalue | p.adjust | qvalue | Count |
| Page: 1 |
Top |
Cell-cell communication analysis |
| Identification of potential cell-cell interactions between two cell types and their ligand-receptor pairs for different disease states |
| Ligand | Receptor | LRpair | Pathway | Tissue | Disease Stage |
| Page: 1 |
Top |
Single-cell gene regulatory network inference analysis |
| Find out the significant the regulons (TFs) and the target genes of each regulon across cell types for different disease states |
| TF | Cell Type | Tissue | Disease Stage | Target Gene | RSS | Regulon Activity |
| ∗The dot plots of a searched regulon are shown for all cell subpopulations in each disease state of each tissue based on the regulon specific score inferred using pySCENIC and by calculating the average expression. |
| Page: 1 |
Top |
Somatic mutation of malignant transformation related genes |
| Annotation of somatic variants for genes involved in malignant transformation |
| Hugo Symbol | Variant Class | Variant Classification | dbSNP RS | HGVSc | HGVSp | HGVSp Short | SWISSPROT | BIOTYPE | SIFT | PolyPhen | Tumor Sample Barcode | Tissue | Histology | Sex | Age | Stage | Therapy Types | Drugs | Outcome |
| PNMT | deletion | Frame_Shift_Del | novel | c.449_479delGGGTGAAACGGGTCCTGCCCATCGACGTGCA | p.Arg150ThrfsTer28 | p.R150Tfs*28 | P11086 | protein_coding | TCGA-A1-A0SO-01 | Breast | breast invasive carcinoma | Female | >=65 | I/II | Chemotherapy | SD | |||
| PNMT | SNV | Missense_Mutation | c.274N>G | p.Ser92Gly | p.S92G | P11086 | protein_coding | deleterious(0.02) | benign(0.007) | TCGA-2W-A8YY-01 | Cervix | cervical & endocervical cancer | Female | <65 | I/II | Chemotherapy | cisplatin | CR | |
| PNMT | SNV | Missense_Mutation | c.254N>G | p.Tyr85Cys | p.Y85C | P11086 | protein_coding | deleterious(0) | probably_damaging(1) | TCGA-A6-6141-01 | Colorectum | colon adenocarcinoma | Male | <65 | I/II | Chemotherapy | 5-fu | SD | |
| PNMT | SNV | Missense_Mutation | novel | c.718A>G | p.Arg240Gly | p.R240G | P11086 | protein_coding | tolerated(0.1) | benign(0.147) | TCGA-AA-3663-01 | Colorectum | colon adenocarcinoma | Male | <65 | I/II | Unknown | Unknown | SD |
| PNMT | SNV | Missense_Mutation | c.530C>T | p.Ala177Val | p.A177V | P11086 | protein_coding | deleterious(0.01) | possibly_damaging(0.821) | TCGA-AZ-4313-01 | Colorectum | colon adenocarcinoma | Female | <65 | I/II | Unknown | Unknown | SD | |
| PNMT | SNV | Missense_Mutation | c.491C>A | p.Pro164His | p.P164H | P11086 | protein_coding | deleterious(0) | probably_damaging(1) | TCGA-D5-6540-01 | Colorectum | colon adenocarcinoma | Male | >=65 | I/II | Unknown | Unknown | SD | |
| PNMT | insertion | Frame_Shift_Ins | rs771451039 | c.621_622insG | p.His210AlafsTer27 | p.H210Afs*27 | P11086 | protein_coding | TCGA-CK-6746-01 | Colorectum | colon adenocarcinoma | Female | >=65 | I/II | Unknown | Unknown | SD | ||
| PNMT | deletion | Frame_Shift_Del | c.627delG | p.His210ThrfsTer20 | p.H210Tfs*20 | P11086 | protein_coding | TCGA-D5-6930-01 | Colorectum | colon adenocarcinoma | Male | >=65 | I/II | Unknown | Unknown | SD | |||
| PNMT | SNV | Missense_Mutation | rs141973736 | c.472N>A | p.Asp158Asn | p.D158N | P11086 | protein_coding | deleterious(0.04) | probably_damaging(0.999) | TCGA-A5-A0G2-01 | Endometrium | uterine corpus endometrioid carcinoma | Female | <65 | III/IV | Unknown | Unknown | SD |
| PNMT | SNV | Missense_Mutation | novel | c.407N>G | p.Lys136Arg | p.K136R | P11086 | protein_coding | tolerated(0.65) | benign(0) | TCGA-A5-A1OF-01 | Endometrium | uterine corpus endometrioid carcinoma | Female | <65 | I/II | Unknown | Unknown | SD |
| Page: 1 2 3 4 |
Top |
Related drugs of malignant transformation related genes |
| Identification of chemicals and drugs interact with genes involved in malignant transfromation |
| (DGIdb 4.0) |
| Entrez ID | Symbol | Category | Interaction Types | Drug Claim Name | Drug Name | PMIDs |
| 5409 | PNMT | DRUGGABLE GENOME, ENZYME | NERVE GROWTH FACTOR | 16926281 | ||
| 5409 | PNMT | DRUGGABLE GENOME, ENZYME | inhibitor | 178103244 |
| Page: 1 |

Copyright 2023-Present -The University of Texas Health Science Center at Houston |