
|
|||||
|
 | |
| |
| |
| |
| |
| |
|
Gene: PNLDC1 |
Gene summary for PNLDC1 |
| Gene information | Species | Human | Gene symbol | PNLDC1 | Gene ID | 154197 |
| Gene name | PARN like ribonuclease domain containing exonuclease 1 | |
| Gene Alias | HsPNLDC1 | |
| Cytomap | 6q25.3 | |
| Gene Type | protein-coding | GO ID | GO:0000184 | UniProtAcc | Q8NA58 |
Top |
Malignant transformation analysis |
| Identification of the aberrant gene expression in precancerous and cancerous lesions by comparing the gene expression of stem-like cells in diseased tissues with normal stem cells |
| Entrez ID | Symbol | Replicates | Species | Organ | Tissue | Adj P-value | Log2FC | Malignancy |
| 154197 | PNLDC1 | LZE7T | Human | Esophagus | ESCC | 1.62e-04 | 1.95e-01 | 0.0667 |
| 154197 | PNLDC1 | LZE22T | Human | Esophagus | ESCC | 1.57e-02 | 3.63e-01 | 0.068 |
| 154197 | PNLDC1 | P4T-E | Human | Esophagus | ESCC | 3.48e-08 | 2.29e-01 | 0.1323 |
| 154197 | PNLDC1 | P17T-E | Human | Esophagus | ESCC | 1.49e-02 | 1.41e-01 | 0.1278 |
| 154197 | PNLDC1 | P20T-E | Human | Esophagus | ESCC | 6.49e-19 | 4.12e-01 | 0.1124 |
| 154197 | PNLDC1 | P24T-E | Human | Esophagus | ESCC | 2.05e-07 | 2.08e-01 | 0.1287 |
| 154197 | PNLDC1 | P27T-E | Human | Esophagus | ESCC | 3.28e-14 | 2.68e-01 | 0.1055 |
| 154197 | PNLDC1 | P30T-E | Human | Esophagus | ESCC | 1.02e-02 | 1.33e-01 | 0.137 |
| 154197 | PNLDC1 | P38T-E | Human | Esophagus | ESCC | 2.58e-10 | 3.98e-01 | 0.127 |
| 154197 | PNLDC1 | P44T-E | Human | Esophagus | ESCC | 7.53e-03 | 1.38e-01 | 0.1096 |
| 154197 | PNLDC1 | P47T-E | Human | Esophagus | ESCC | 3.97e-04 | 1.15e-01 | 0.1067 |
| 154197 | PNLDC1 | P56T-E | Human | Esophagus | ESCC | 1.16e-08 | 6.71e-01 | 0.1613 |
| 154197 | PNLDC1 | P74T-E | Human | Esophagus | ESCC | 8.28e-10 | 2.57e-01 | 0.1479 |
| 154197 | PNLDC1 | P76T-E | Human | Esophagus | ESCC | 3.60e-13 | 2.97e-01 | 0.1207 |
| 154197 | PNLDC1 | P82T-E | Human | Esophagus | ESCC | 4.14e-03 | 2.06e-01 | 0.1072 |
| 154197 | PNLDC1 | P127T-E | Human | Esophagus | ESCC | 8.31e-06 | 1.47e-01 | 0.0826 |
| 154197 | PNLDC1 | P128T-E | Human | Esophagus | ESCC | 9.89e-39 | 9.00e-01 | 0.1241 |
| Page: 1 |
| Tissue | Expression Dynamics | Abbreviation |
| Esophagus | 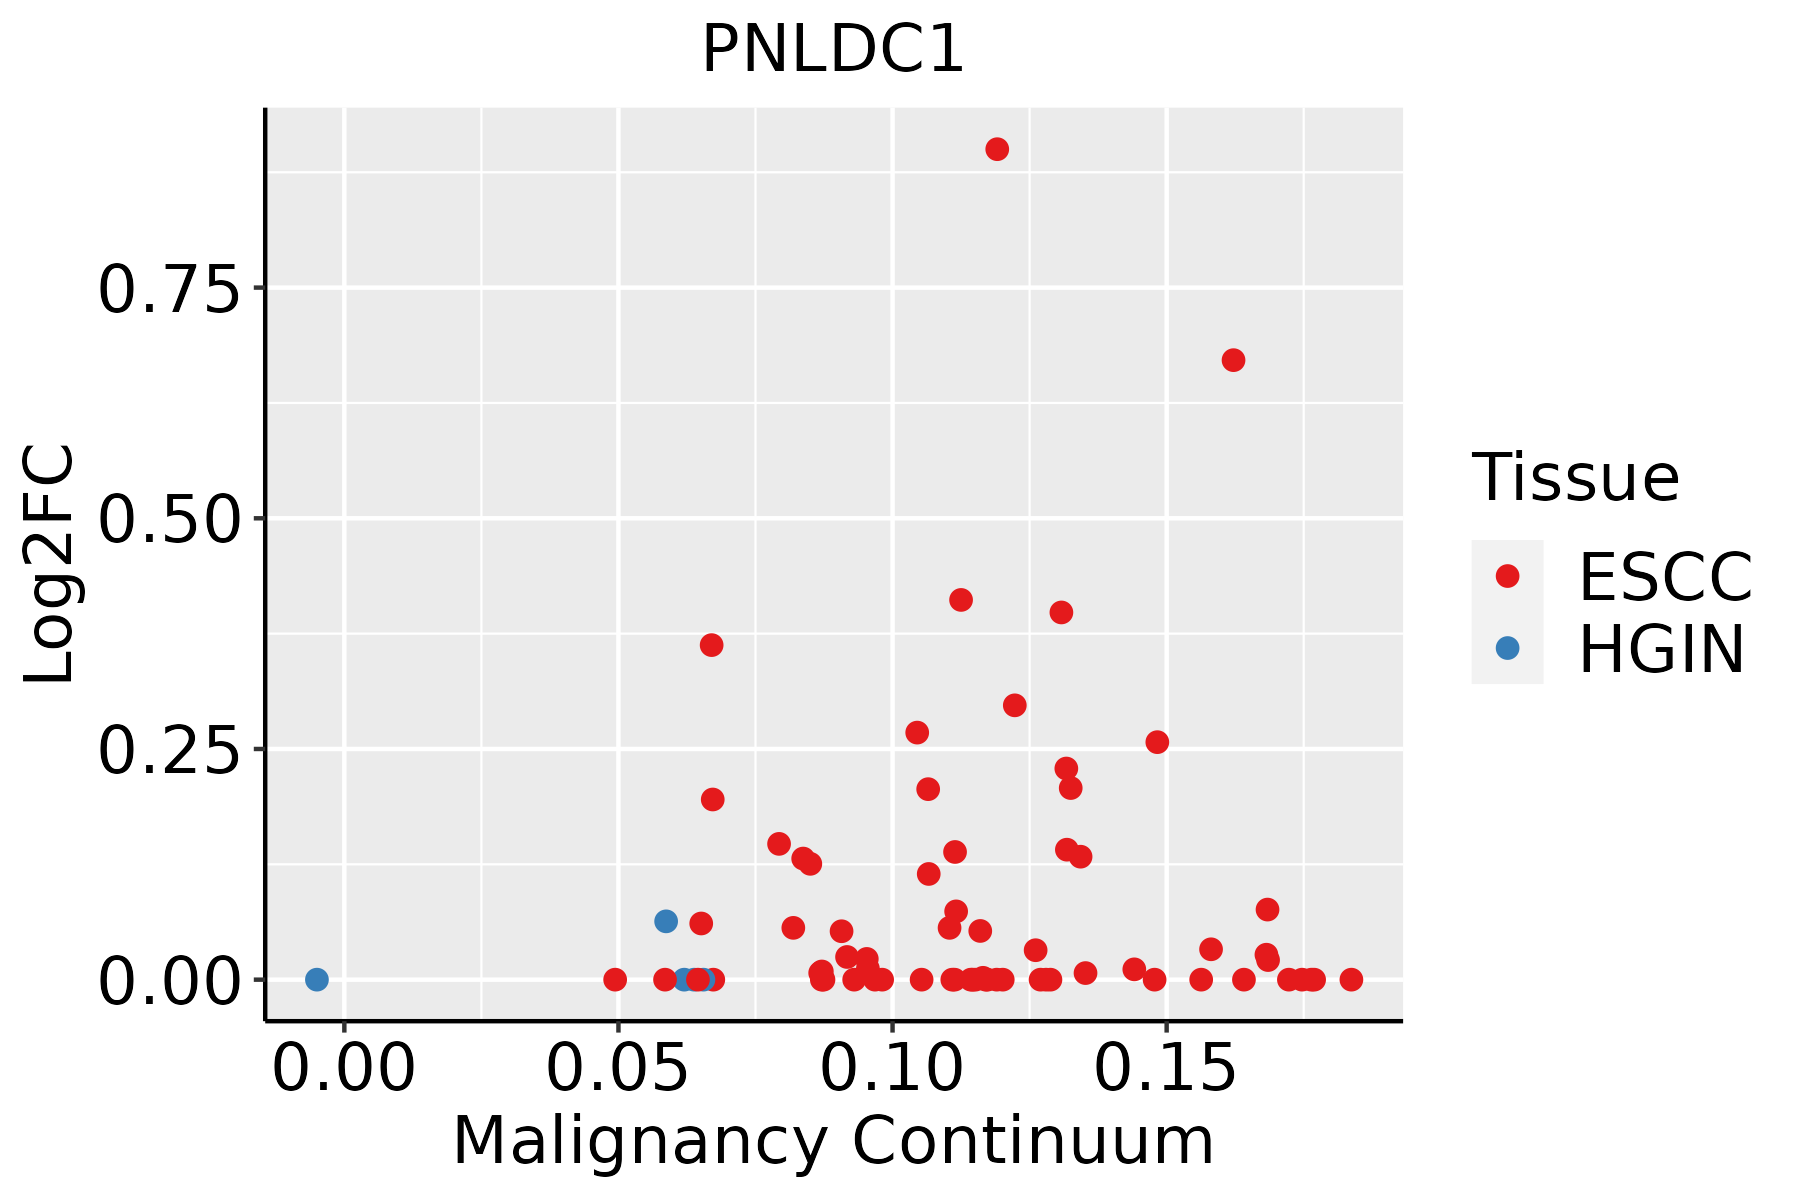 | ESCC: Esophageal squamous cell carcinoma |
| HGIN: High-grade intraepithelial neoplasias | ||
| LGIN: Low-grade intraepithelial neoplasias |
| ∗log2FC in expression of this searched gene in stem-like cells from each diseased tissue sample relative to stem-like cells in normal samples in each tissue plotted against the malignancy continuum. Samples are colored based on if they are from different disease stage. |
Top |
Malignant transformation related pathway analysis |
| Find out the enriched GO biological processes and KEGG pathways involved in transition from healthy to precancer to cancer |
| Tissue | Disease Stage | Enriched GO biological Processes |
| Colorectum | AD |  |
| Colorectum | SER |  |
| Colorectum | MSS |  |
| Colorectum | MSI-H |  |
| Colorectum | FAP |  |
| ∗Top 15 enriched GO BP terms are showed in the bar plot of each disease state in each tissue. Each row represents a significant GO biological process which is colored according to the -log10(p.adjust). |
| Page: 1 2 3 4 5 6 7 8 9 |
| GO ID | Tissue | Disease Stage | Description | Gene Ratio | Bg Ratio | pvalue | p.adjust | Count |
| GO:0009896111 | Esophagus | ESCC | positive regulation of catabolic process | 332/8552 | 492/18723 | 4.36e-23 | 9.22e-21 | 332 |
| GO:0031331111 | Esophagus | ESCC | positive regulation of cellular catabolic process | 292/8552 | 427/18723 | 8.67e-22 | 1.53e-19 | 292 |
| GO:1903311110 | Esophagus | ESCC | regulation of mRNA metabolic process | 210/8552 | 288/18723 | 3.25e-21 | 5.56e-19 | 210 |
| GO:0006401110 | Esophagus | ESCC | RNA catabolic process | 204/8552 | 278/18723 | 3.39e-21 | 5.66e-19 | 204 |
| GO:0034655110 | Esophagus | ESCC | nucleobase-containing compound catabolic process | 272/8552 | 407/18723 | 2.92e-18 | 2.90e-16 | 272 |
| GO:0006402110 | Esophagus | ESCC | mRNA catabolic process | 170/8552 | 232/18723 | 8.70e-18 | 8.00e-16 | 170 |
| GO:0006417111 | Esophagus | ESCC | regulation of translation | 304/8552 | 468/18723 | 1.53e-17 | 1.33e-15 | 304 |
| GO:000170119 | Esophagus | ESCC | in utero embryonic development | 243/8552 | 367/18723 | 1.00e-15 | 6.86e-14 | 243 |
| GO:004670018 | Esophagus | ESCC | heterocycle catabolic process | 286/8552 | 445/18723 | 1.12e-15 | 7.47e-14 | 286 |
| GO:004427019 | Esophagus | ESCC | cellular nitrogen compound catabolic process | 288/8552 | 451/18723 | 3.03e-15 | 1.79e-13 | 288 |
| GO:001943918 | Esophagus | ESCC | aromatic compound catabolic process | 295/8552 | 467/18723 | 1.09e-14 | 5.98e-13 | 295 |
| GO:190136118 | Esophagus | ESCC | organic cyclic compound catabolic process | 307/8552 | 495/18723 | 9.99e-14 | 4.80e-12 | 307 |
| GO:000095618 | Esophagus | ESCC | nuclear-transcribed mRNA catabolic process | 88/8552 | 112/18723 | 9.41e-13 | 4.14e-11 | 88 |
| GO:00905013 | Esophagus | ESCC | RNA phosphodiester bond hydrolysis | 110/8552 | 152/18723 | 1.95e-11 | 6.81e-10 | 110 |
| GO:190331316 | Esophagus | ESCC | positive regulation of mRNA metabolic process | 87/8552 | 118/18723 | 5.10e-10 | 1.32e-08 | 87 |
| GO:006101319 | Esophagus | ESCC | regulation of mRNA catabolic process | 115/8552 | 166/18723 | 5.90e-10 | 1.49e-08 | 115 |
| GO:004348719 | Esophagus | ESCC | regulation of RNA stability | 117/8552 | 170/18723 | 7.91e-10 | 1.94e-08 | 117 |
| GO:004348819 | Esophagus | ESCC | regulation of mRNA stability | 109/8552 | 158/18723 | 2.40e-09 | 5.35e-08 | 109 |
| GO:00903053 | Esophagus | ESCC | nucleic acid phosphodiester bond hydrolysis | 163/8552 | 261/18723 | 3.07e-08 | 5.73e-07 | 163 |
| GO:000018414 | Esophagus | ESCC | nuclear-transcribed mRNA catabolic process, nonsense-mediated decay | 32/8552 | 37/18723 | 2.96e-07 | 4.23e-06 | 32 |
| Page: 1 2 |
| Pathway ID | Tissue | Disease Stage | Description | Gene Ratio | Bg Ratio | pvalue | p.adjust | qvalue | Count |
| hsa0301824 | Esophagus | ESCC | RNA degradation | 62/4205 | 79/8465 | 1.18e-07 | 9.39e-07 | 4.81e-07 | 62 |
| hsa0301834 | Esophagus | ESCC | RNA degradation | 62/4205 | 79/8465 | 1.18e-07 | 9.39e-07 | 4.81e-07 | 62 |
| Page: 1 |
Top |
Cell-cell communication analysis |
| Identification of potential cell-cell interactions between two cell types and their ligand-receptor pairs for different disease states |
| Ligand | Receptor | LRpair | Pathway | Tissue | Disease Stage |
| Page: 1 |
Top |
Single-cell gene regulatory network inference analysis |
| Find out the significant the regulons (TFs) and the target genes of each regulon across cell types for different disease states |
| TF | Cell Type | Tissue | Disease Stage | Target Gene | RSS | Regulon Activity |
| ∗The dot plots of a searched regulon are shown for all cell subpopulations in each disease state of each tissue based on the regulon specific score inferred using pySCENIC and by calculating the average expression. |
| Page: 1 |
Top |
Somatic mutation of malignant transformation related genes |
| Annotation of somatic variants for genes involved in malignant transformation |
| Hugo Symbol | Variant Class | Variant Classification | dbSNP RS | HGVSc | HGVSp | HGVSp Short | SWISSPROT | BIOTYPE | SIFT | PolyPhen | Tumor Sample Barcode | Tissue | Histology | Sex | Age | Stage | Therapy Types | Drugs | Outcome |
| PNLDC1 | SNV | Missense_Mutation | c.433N>G | p.Ile145Val | p.I145V | Q8NA58 | protein_coding | tolerated(0.14) | benign(0.015) | TCGA-BH-A1ES-06 | Breast | breast invasive carcinoma | Female | <65 | I/II | Unknown | Unknown | PD | |
| PNLDC1 | SNV | Missense_Mutation | c.1362N>C | p.Gln454His | p.Q454H | Q8NA58 | protein_coding | tolerated(0.07) | possibly_damaging(0.742) | TCGA-E2-A10C-01 | Breast | breast invasive carcinoma | Female | <65 | I/II | Chemotherapy | cytoxan | SD | |
| PNLDC1 | SNV | Missense_Mutation | c.168N>C | p.Lys56Asn | p.K56N | Q8NA58 | protein_coding | deleterious(0) | probably_damaging(0.986) | TCGA-DG-A2KM-01 | Cervix | cervical & endocervical cancer | Female | <65 | I/II | Chemotherapy | cisplatin | SD | |
| PNLDC1 | SNV | Missense_Mutation | novel | c.1051N>C | p.Glu351Gln | p.E351Q | Q8NA58 | protein_coding | tolerated(0.32) | benign(0.055) | TCGA-EK-A2R7-01 | Cervix | cervical & endocervical cancer | Female | <65 | I/II | Unknown | Unknown | SD |
| PNLDC1 | SNV | Missense_Mutation | novel | c.1573N>G | p.Ile525Val | p.I525V | Q8NA58 | protein_coding | tolerated(1) | benign(0) | TCGA-HM-A6W2-06 | Cervix | cervical & endocervical cancer | Female | <65 | I/II | Chemotherapy | cisplatin | SD |
| PNLDC1 | SNV | Missense_Mutation | rs143586629 | c.1388N>A | p.Arg463Gln | p.R463Q | Q8NA58 | protein_coding | tolerated(0.22) | probably_damaging(0.934) | TCGA-IR-A3LB-01 | Cervix | cervical & endocervical cancer | Female | <65 | I/II | Chemotherapy | cisplatin | PD |
| PNLDC1 | SNV | Missense_Mutation | novel | c.1294C>T | p.Pro432Ser | p.P432S | Q8NA58 | protein_coding | deleterious(0.01) | probably_damaging(0.999) | TCGA-MU-A8JM-01 | Cervix | cervical & endocervical cancer | Female | <65 | I/II | Unknown | Unknown | SD |
| PNLDC1 | SNV | Missense_Mutation | novel | c.55N>A | p.Val19Ile | p.V19I | Q8NA58 | protein_coding | tolerated(0.99) | benign(0.006) | TCGA-VS-A952-01 | Cervix | cervical & endocervical cancer | Female | >=65 | I/II | Unknown | Unknown | SD |
| PNLDC1 | SNV | Missense_Mutation | rs145458684 | c.1336N>A | p.Glu446Lys | p.E446K | Q8NA58 | protein_coding | deleterious(0.03) | possibly_damaging(0.749) | TCGA-A6-2672-01 | Colorectum | colon adenocarcinoma | Female | >=65 | III/IV | Unknown | Unknown | SD |
| PNLDC1 | SNV | Missense_Mutation | c.511N>A | p.Trp171Arg | p.W171R | Q8NA58 | protein_coding | deleterious(0) | probably_damaging(0.997) | TCGA-A6-6781-01 | Colorectum | colon adenocarcinoma | Male | <65 | III/IV | Chemotherapy | oxaliplatin | SD |
| Page: 1 2 3 4 5 6 7 8 |
Top |
Related drugs of malignant transformation related genes |
| Identification of chemicals and drugs interact with genes involved in malignant transfromation |
| (DGIdb 4.0) |
| Entrez ID | Symbol | Category | Interaction Types | Drug Claim Name | Drug Name | PMIDs |
| Page: 1 |

Copyright 2023-Present -The University of Texas Health Science Center at Houston |