
|
|||||
|
 | |
| |
| |
| |
| |
| |
|
Gene: PNKP |
Gene summary for PNKP |
| Gene information | Species | Human | Gene symbol | PNKP | Gene ID | 11284 |
| Gene name | polynucleotide kinase 3'-phosphatase | |
| Gene Alias | AOA4 | |
| Cytomap | 19q13.33 | |
| Gene Type | protein-coding | GO ID | GO:0000718 | UniProtAcc | Q96T60 |
Top |
Malignant transformation analysis |
| Identification of the aberrant gene expression in precancerous and cancerous lesions by comparing the gene expression of stem-like cells in diseased tissues with normal stem cells |
| Entrez ID | Symbol | Replicates | Species | Organ | Tissue | Adj P-value | Log2FC | Malignancy |
| 11284 | PNKP | HTA11_347_2000001011 | Human | Colorectum | AD | 8.98e-06 | 2.68e-01 | -0.1954 |
| 11284 | PNKP | HTA11_696_2000001011 | Human | Colorectum | AD | 4.02e-13 | 5.19e-01 | -0.1464 |
| 11284 | PNKP | HTA11_866_2000001011 | Human | Colorectum | AD | 1.55e-05 | 3.10e-01 | -0.1001 |
| 11284 | PNKP | HTA11_1391_2000001011 | Human | Colorectum | AD | 1.43e-07 | 4.14e-01 | -0.059 |
| 11284 | PNKP | HTA11_866_3004761011 | Human | Colorectum | AD | 1.49e-02 | 2.17e-01 | 0.096 |
| 11284 | PNKP | HTA11_10711_2000001011 | Human | Colorectum | AD | 4.74e-06 | 3.93e-01 | 0.0338 |
| 11284 | PNKP | HTA11_7696_3000711011 | Human | Colorectum | AD | 8.73e-22 | 6.42e-01 | 0.0674 |
| 11284 | PNKP | A015-C-203 | Human | Colorectum | FAP | 2.53e-03 | -9.01e-02 | -0.1294 |
| 11284 | PNKP | A015-C-104 | Human | Colorectum | FAP | 1.39e-03 | -9.16e-02 | -0.1899 |
| 11284 | PNKP | A002-C-116 | Human | Colorectum | FAP | 5.63e-03 | -1.15e-01 | -0.0452 |
| 11284 | PNKP | F034 | Human | Colorectum | FAP | 3.94e-02 | -9.66e-02 | -0.0665 |
| 11284 | PNKP | LZE2T | Human | Esophagus | ESCC | 6.81e-05 | 4.64e-01 | 0.082 |
| 11284 | PNKP | LZE4T | Human | Esophagus | ESCC | 6.96e-07 | 1.52e-01 | 0.0811 |
| 11284 | PNKP | LZE7T | Human | Esophagus | ESCC | 1.64e-16 | 6.87e-01 | 0.0667 |
| 11284 | PNKP | LZE8T | Human | Esophagus | ESCC | 7.35e-05 | 1.61e-01 | 0.067 |
| 11284 | PNKP | LZE20T | Human | Esophagus | ESCC | 1.64e-06 | 2.21e-01 | 0.0662 |
| 11284 | PNKP | LZE22T | Human | Esophagus | ESCC | 2.65e-03 | 3.65e-01 | 0.068 |
| 11284 | PNKP | LZE24T | Human | Esophagus | ESCC | 3.88e-19 | 5.11e-01 | 0.0596 |
| 11284 | PNKP | LZE21T | Human | Esophagus | ESCC | 1.67e-04 | 4.19e-01 | 0.0655 |
| 11284 | PNKP | LZE6T | Human | Esophagus | ESCC | 2.78e-03 | 2.31e-01 | 0.0845 |
| Page: 1 2 3 4 5 6 7 |
| Tissue | Expression Dynamics | Abbreviation |
| Colorectum (GSE201348) |  | FAP: Familial adenomatous polyposis |
| CRC: Colorectal cancer | ||
| Colorectum (HTA11) |  | AD: Adenomas |
| SER: Sessile serrated lesions | ||
| MSI-H: Microsatellite-high colorectal cancer | ||
| MSS: Microsatellite stable colorectal cancer | ||
| Esophagus | 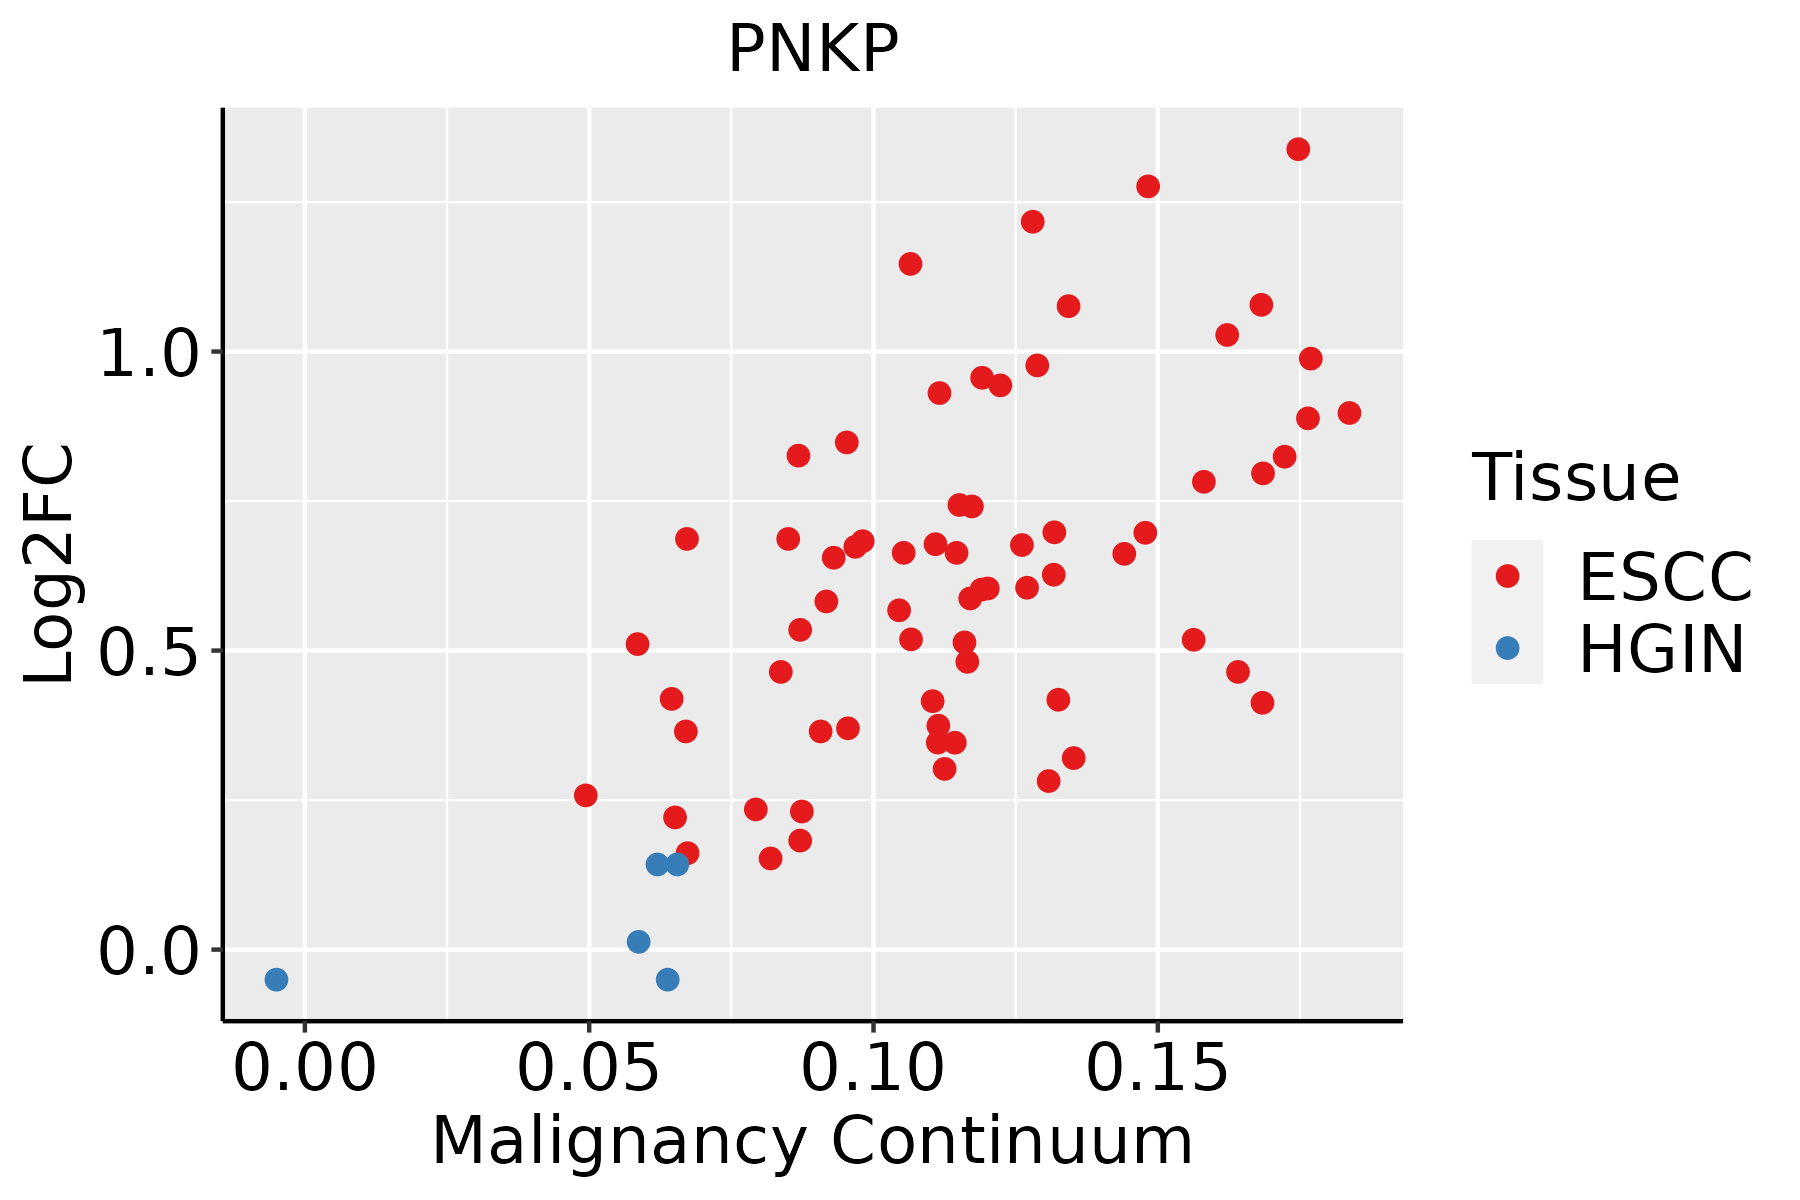 | ESCC: Esophageal squamous cell carcinoma |
| HGIN: High-grade intraepithelial neoplasias | ||
| LGIN: Low-grade intraepithelial neoplasias | ||
| Liver | 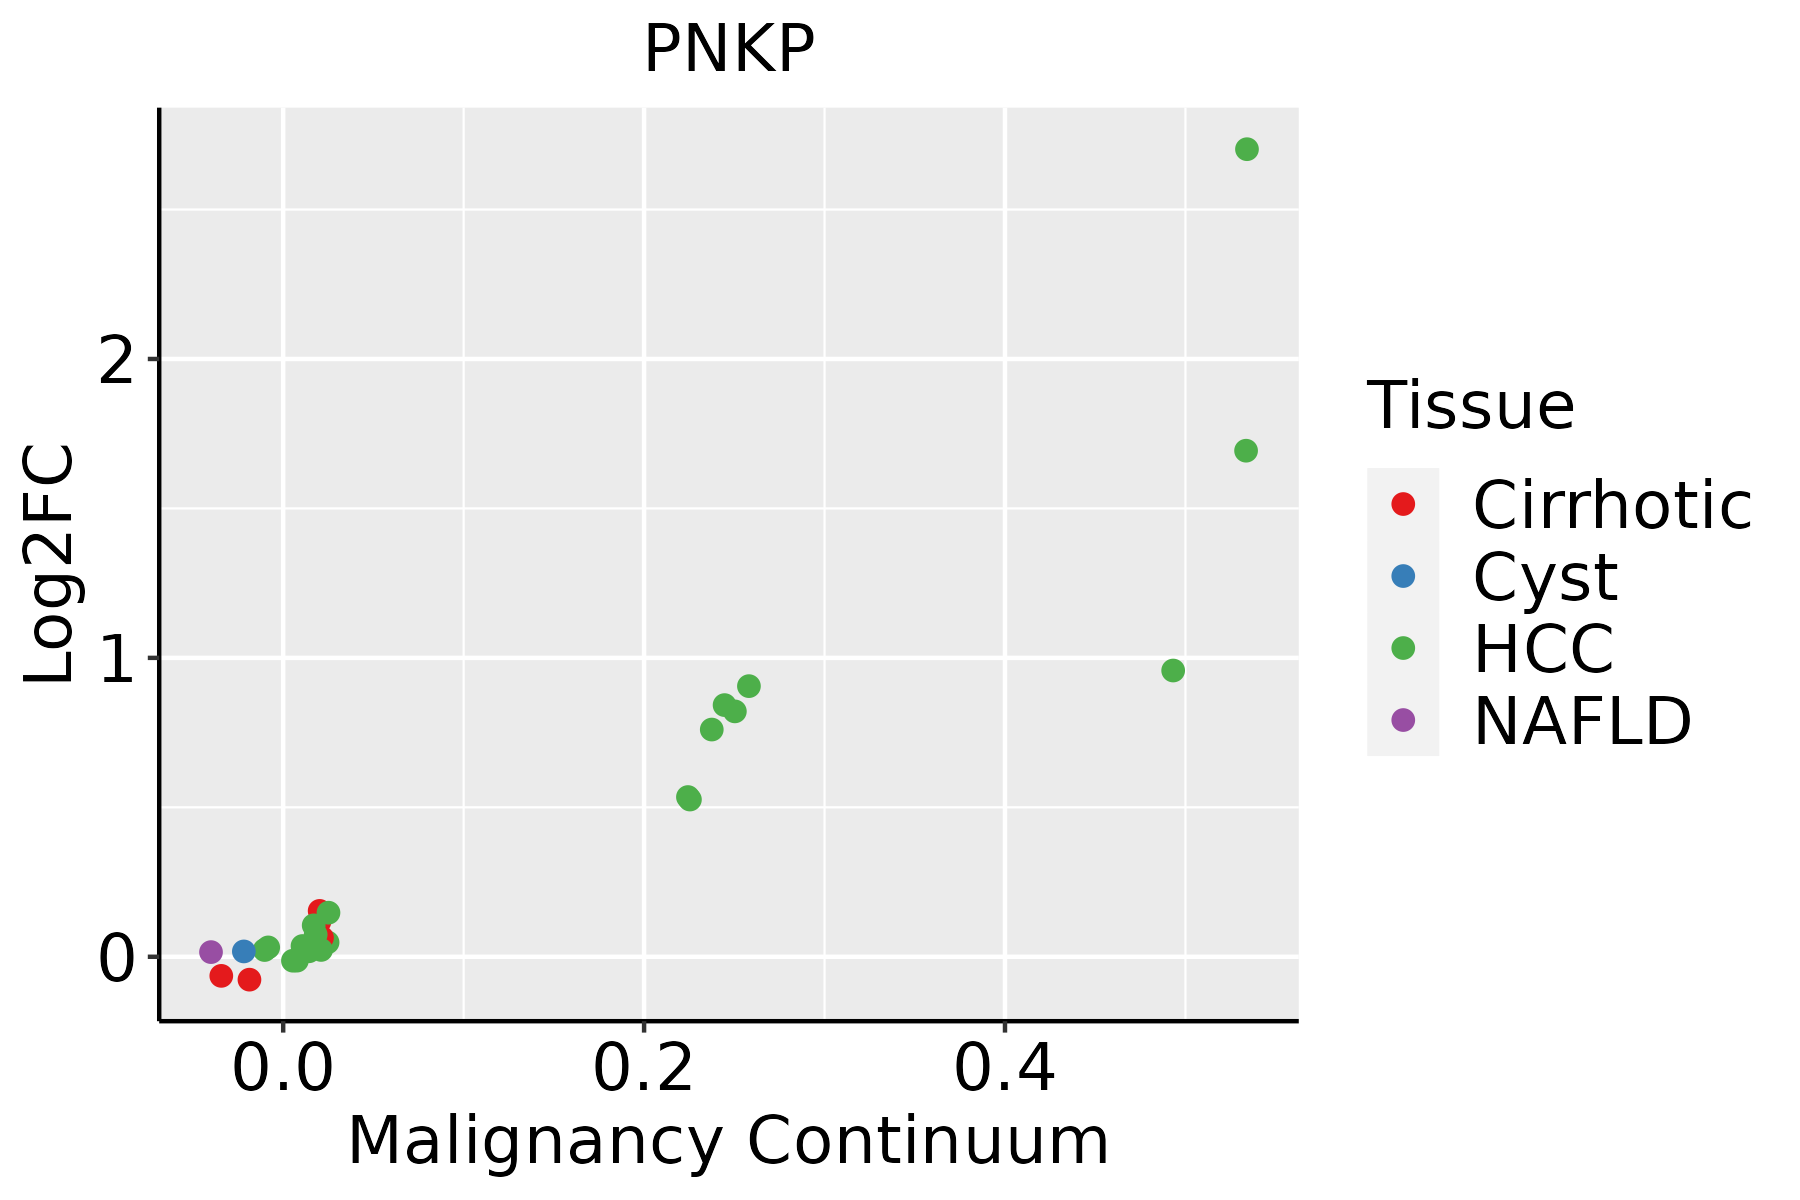 | HCC: Hepatocellular carcinoma |
| NAFLD: Non-alcoholic fatty liver disease | ||
| Oral Cavity |  | EOLP: Erosive Oral lichen planus |
| LP: leukoplakia | ||
| NEOLP: Non-erosive oral lichen planus | ||
| OSCC: Oral squamous cell carcinoma | ||
| Prostate | 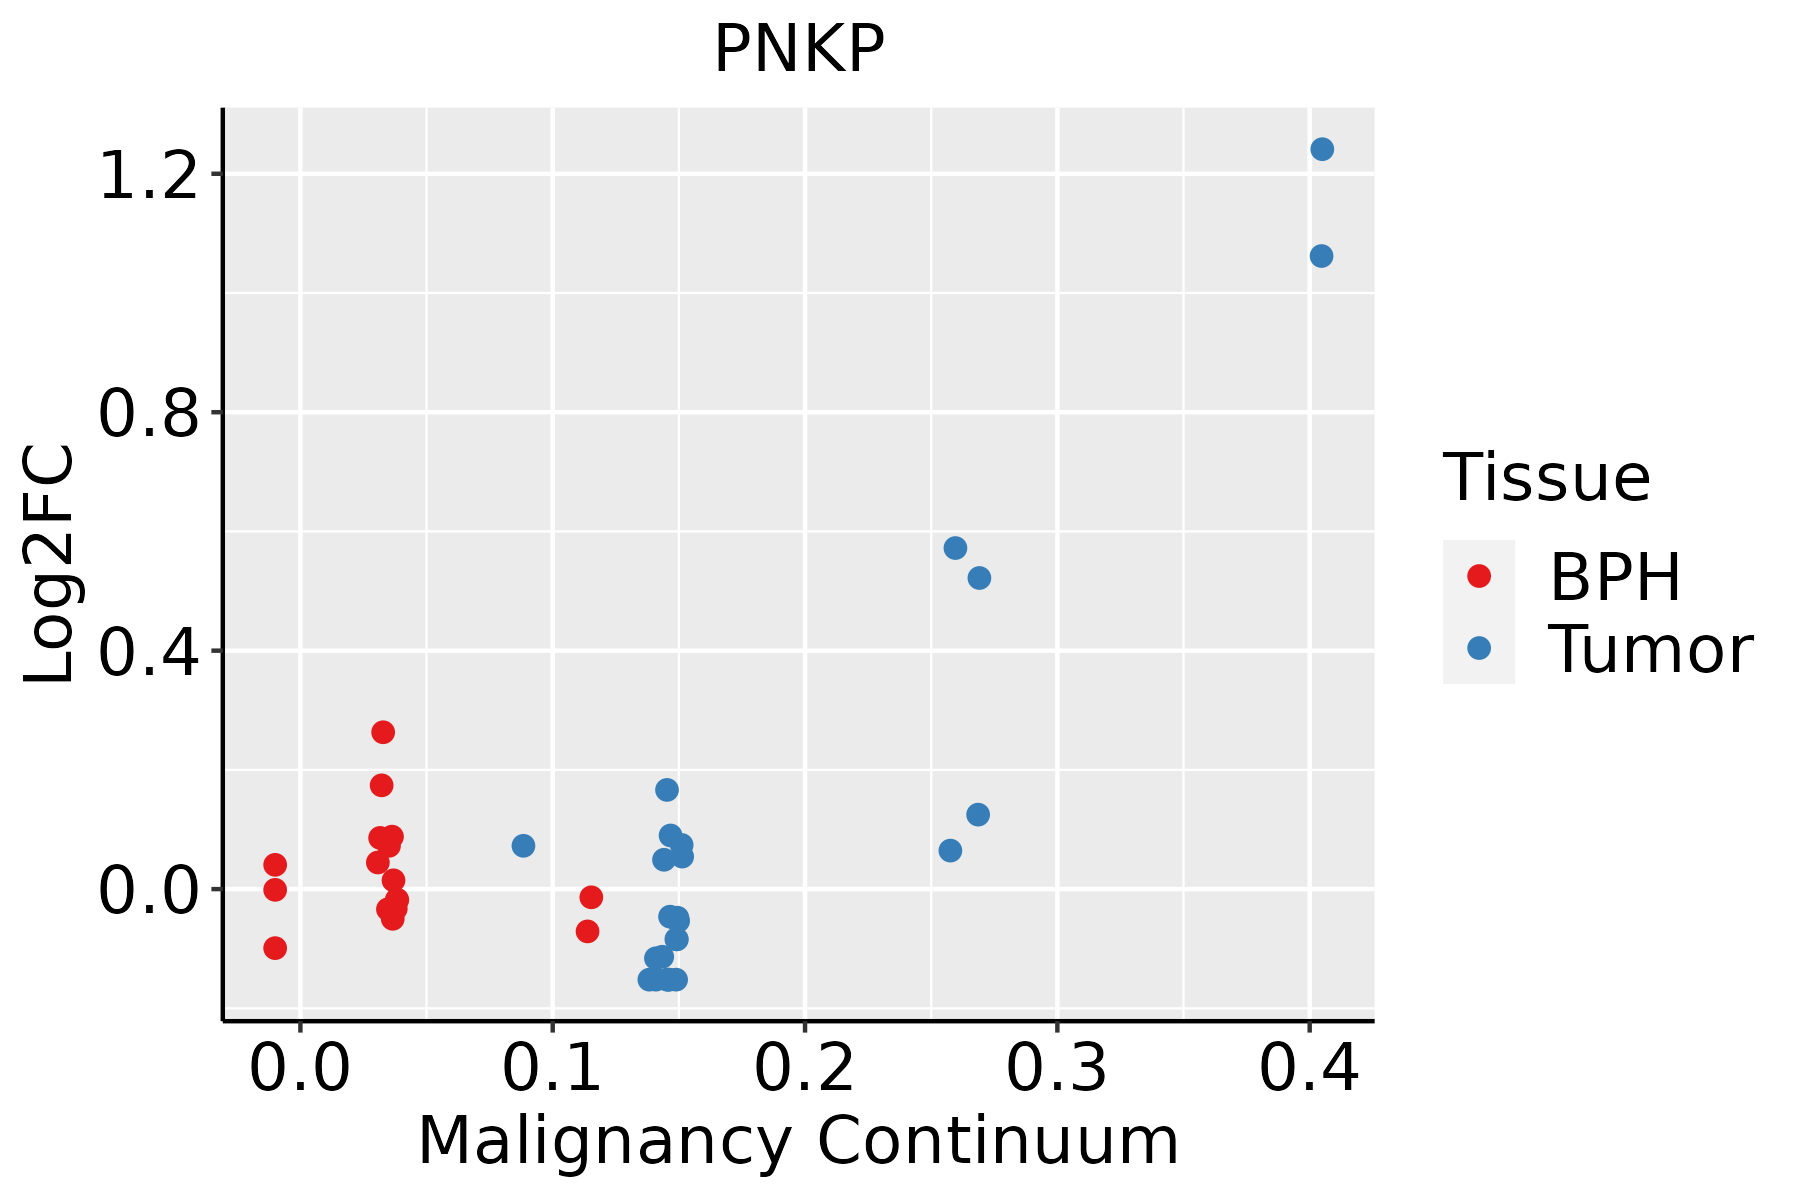 | BPH: Benign Prostatic Hyperplasia |
| Skin |  | AK: Actinic keratosis |
| cSCC: Cutaneous squamous cell carcinoma | ||
| SCCIS:squamous cell carcinoma in situ | ||
| Thyroid | 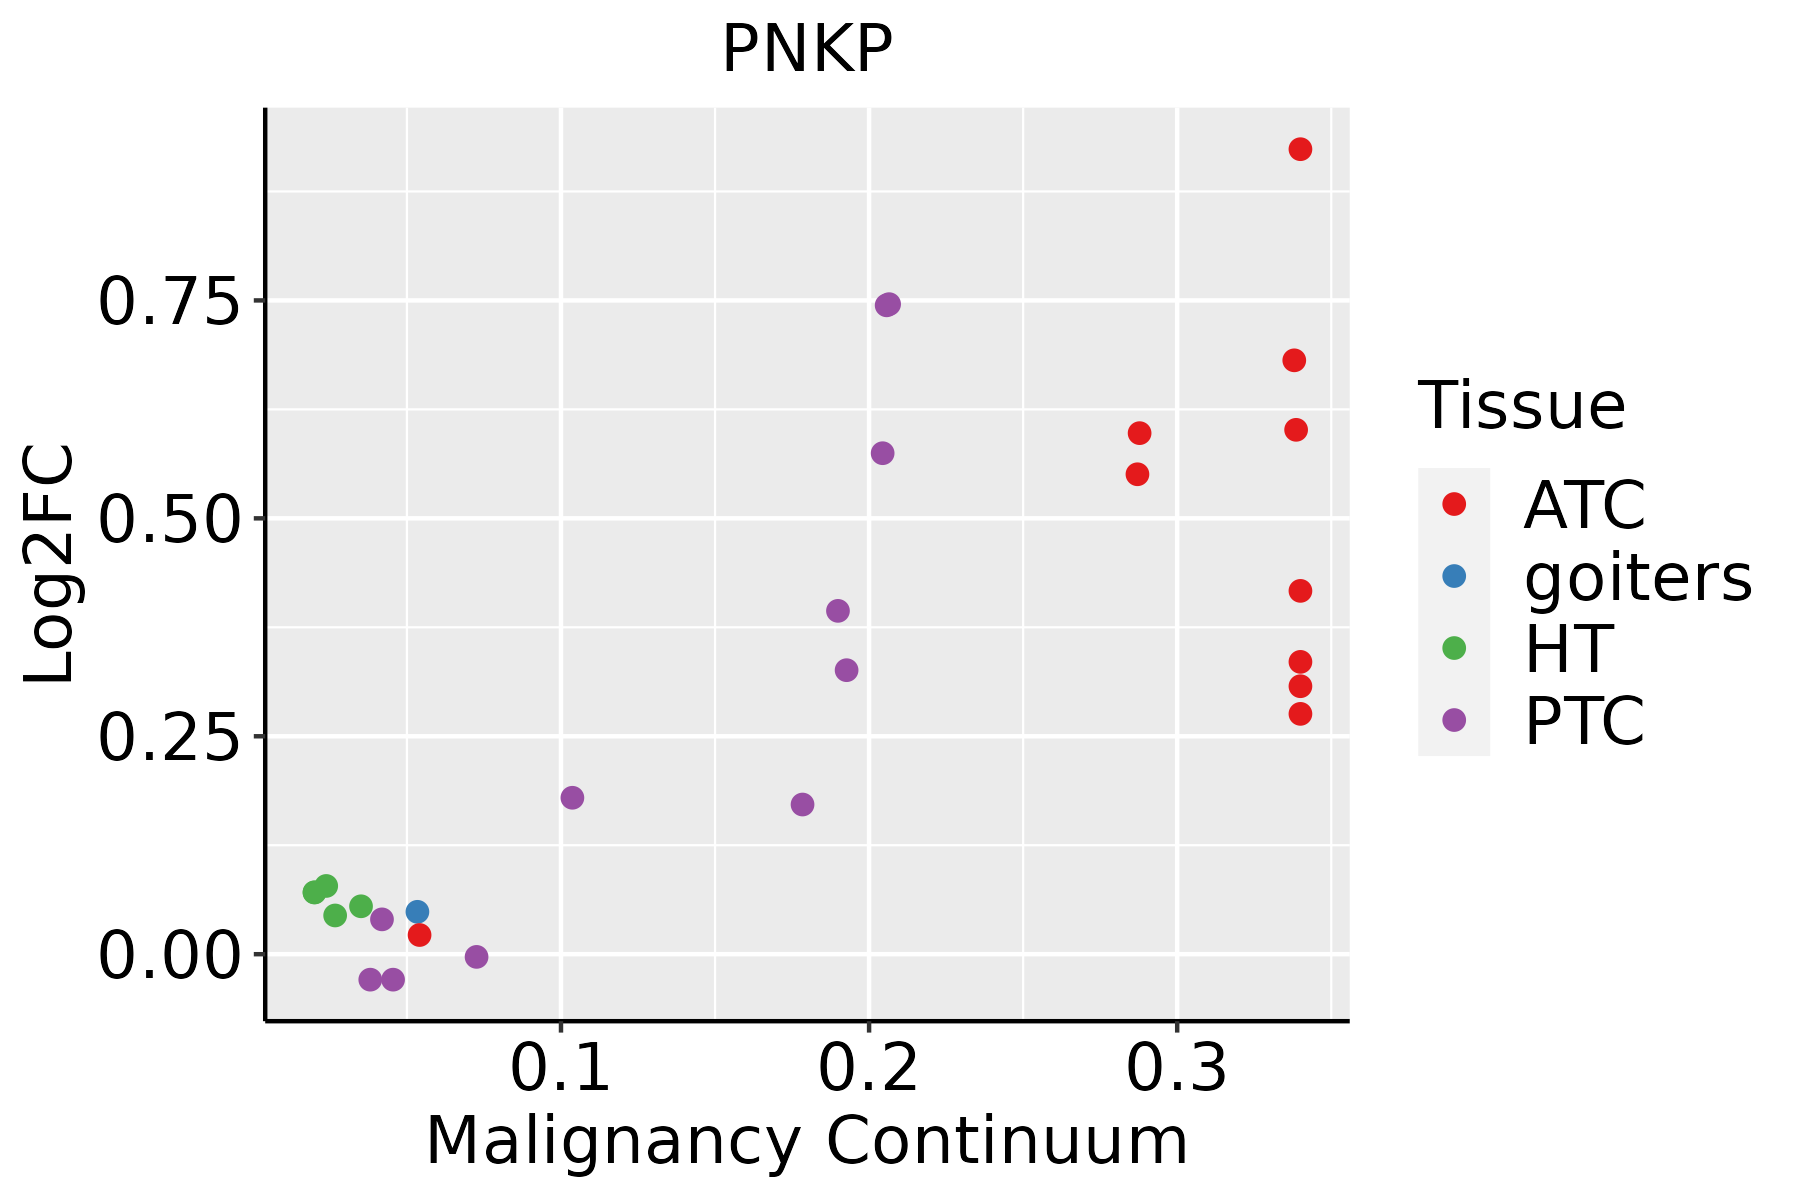 | ATC: Anaplastic thyroid cancer |
| HT: Hashimoto's thyroiditis | ||
| PTC: Papillary thyroid cancer |
| ∗log2FC in expression of this searched gene in stem-like cells from each diseased tissue sample relative to stem-like cells in normal samples in each tissue plotted against the malignancy continuum. Samples are colored based on if they are from different disease stage. |
Top |
Malignant transformation related pathway analysis |
| Find out the enriched GO biological processes and KEGG pathways involved in transition from healthy to precancer to cancer |
| Tissue | Disease Stage | Enriched GO biological Processes |
| Colorectum | AD |  |
| Colorectum | SER |  |
| Colorectum | MSS |  |
| Colorectum | MSI-H |  |
| Colorectum | FAP |  |
| ∗Top 15 enriched GO BP terms are showed in the bar plot of each disease state in each tissue. Each row represents a significant GO biological process which is colored according to the -log10(p.adjust). |
| Page: 1 2 3 4 5 6 7 8 9 |
| GO ID | Tissue | Disease Stage | Description | Gene Ratio | Bg Ratio | pvalue | p.adjust | Count |
| GO:0006979 | Colorectum | AD | response to oxidative stress | 145/3918 | 446/18723 | 5.16e-09 | 3.23e-07 | 145 |
| GO:0051052 | Colorectum | AD | regulation of DNA metabolic process | 116/3918 | 359/18723 | 2.47e-07 | 1.00e-05 | 116 |
| GO:0051054 | Colorectum | AD | positive regulation of DNA metabolic process | 73/3918 | 201/18723 | 3.27e-07 | 1.29e-05 | 73 |
| GO:0046939 | Colorectum | AD | nucleotide phosphorylation | 42/3918 | 101/18723 | 1.99e-06 | 5.92e-05 | 42 |
| GO:2001252 | Colorectum | AD | positive regulation of chromosome organization | 35/3918 | 82/18723 | 6.90e-06 | 1.72e-04 | 35 |
| GO:0016311 | Colorectum | AD | dephosphorylation | 123/3918 | 417/18723 | 1.84e-05 | 3.82e-04 | 123 |
| GO:2000278 | Colorectum | AD | regulation of DNA biosynthetic process | 41/3918 | 106/18723 | 2.17e-05 | 4.33e-04 | 41 |
| GO:2001020 | Colorectum | AD | regulation of response to DNA damage stimulus | 71/3918 | 219/18723 | 4.38e-05 | 7.65e-04 | 71 |
| GO:2000573 | Colorectum | AD | positive regulation of DNA biosynthetic process | 28/3918 | 66/18723 | 6.35e-05 | 1.05e-03 | 28 |
| GO:0051972 | Colorectum | AD | regulation of telomerase activity | 22/3918 | 47/18723 | 6.45e-05 | 1.07e-03 | 22 |
| GO:0032206 | Colorectum | AD | positive regulation of telomere maintenance | 23/3918 | 52/18723 | 1.31e-04 | 1.88e-03 | 23 |
| GO:0051973 | Colorectum | AD | positive regulation of telomerase activity | 17/3918 | 34/18723 | 1.59e-04 | 2.20e-03 | 17 |
| GO:0032204 | Colorectum | AD | regulation of telomere maintenance | 31/3918 | 80/18723 | 2.01e-04 | 2.67e-03 | 31 |
| GO:0033044 | Colorectum | AD | regulation of chromosome organization | 60/3918 | 187/18723 | 2.25e-04 | 2.94e-03 | 60 |
| GO:0000723 | Colorectum | AD | telomere maintenance | 43/3918 | 131/18723 | 9.77e-04 | 9.20e-03 | 43 |
| GO:2001022 | Colorectum | AD | positive regulation of response to DNA damage stimulus | 36/3918 | 105/18723 | 1.02e-03 | 9.47e-03 | 36 |
| GO:0010833 | Colorectum | AD | telomere maintenance via telomere lengthening | 29/3918 | 81/18723 | 1.42e-03 | 1.22e-02 | 29 |
| GO:0071897 | Colorectum | AD | DNA biosynthetic process | 55/3918 | 180/18723 | 1.46e-03 | 1.24e-02 | 55 |
| GO:0006282 | Colorectum | AD | regulation of DNA repair | 42/3918 | 130/18723 | 1.57e-03 | 1.32e-02 | 42 |
| GO:0042769 | Colorectum | AD | DNA damage response, detection of DNA damage | 8/3918 | 13/18723 | 1.70e-03 | 1.41e-02 | 8 |
| Page: 1 2 3 4 5 6 7 8 9 10 11 12 13 14 15 16 17 18 19 20 |
| Pathway ID | Tissue | Disease Stage | Description | Gene Ratio | Bg Ratio | pvalue | p.adjust | qvalue | Count |
| hsa034104 | Esophagus | ESCC | Base excision repair | 38/4205 | 44/8465 | 3.59e-07 | 2.62e-06 | 1.34e-06 | 38 |
| hsa0341011 | Esophagus | ESCC | Base excision repair | 38/4205 | 44/8465 | 3.59e-07 | 2.62e-06 | 1.34e-06 | 38 |
| hsa03410 | Oral cavity | OSCC | Base excision repair | 32/3704 | 44/8465 | 9.11e-05 | 3.25e-04 | 1.65e-04 | 32 |
| hsa034101 | Oral cavity | OSCC | Base excision repair | 32/3704 | 44/8465 | 9.11e-05 | 3.25e-04 | 1.65e-04 | 32 |
| hsa034102 | Oral cavity | LP | Base excision repair | 23/2418 | 44/8465 | 7.66e-04 | 3.75e-03 | 2.42e-03 | 23 |
| hsa034103 | Oral cavity | LP | Base excision repair | 23/2418 | 44/8465 | 7.66e-04 | 3.75e-03 | 2.42e-03 | 23 |
| Page: 1 |
Top |
Cell-cell communication analysis |
| Identification of potential cell-cell interactions between two cell types and their ligand-receptor pairs for different disease states |
| Ligand | Receptor | LRpair | Pathway | Tissue | Disease Stage |
| Page: 1 |
Top |
Single-cell gene regulatory network inference analysis |
| Find out the significant the regulons (TFs) and the target genes of each regulon across cell types for different disease states |
| TF | Cell Type | Tissue | Disease Stage | Target Gene | RSS | Regulon Activity |
| ∗The dot plots of a searched regulon are shown for all cell subpopulations in each disease state of each tissue based on the regulon specific score inferred using pySCENIC and by calculating the average expression. |
| Page: 1 |
Top |
Somatic mutation of malignant transformation related genes |
| Annotation of somatic variants for genes involved in malignant transformation |
| Hugo Symbol | Variant Class | Variant Classification | dbSNP RS | HGVSc | HGVSp | HGVSp Short | SWISSPROT | BIOTYPE | SIFT | PolyPhen | Tumor Sample Barcode | Tissue | Histology | Sex | Age | Stage | Therapy Types | Drugs | Outcome |
| PNKP | SNV | Missense_Mutation | c.137N>T | p.Cys46Phe | p.C46F | Q96T60 | protein_coding | deleterious(0) | probably_damaging(0.991) | TCGA-A7-A0DA-01 | Breast | breast invasive carcinoma | Female | <65 | I/II | Chemotherapy | adriamycin | SD | |
| PNKP | SNV | Missense_Mutation | novel | c.1487N>G | p.Ser496Cys | p.S496C | Q96T60 | protein_coding | deleterious(0) | benign(0.443) | TCGA-AN-A0XW-01 | Breast | breast invasive carcinoma | Female | <65 | III/IV | Unknown | Unknown | SD |
| PNKP | SNV | Missense_Mutation | c.721G>C | p.Glu241Gln | p.E241Q | Q96T60 | protein_coding | tolerated(0.37) | benign(0.027) | TCGA-D8-A1J8-01 | Breast | breast invasive carcinoma | Female | >=65 | I/II | Hormone Therapy | nolvadex | SD | |
| PNKP | SNV | Missense_Mutation | rs773641701 | c.625N>A | p.Glu209Lys | p.E209K | Q96T60 | protein_coding | tolerated(0.21) | benign(0.003) | TCGA-EW-A3E8-01 | Breast | breast invasive carcinoma | Female | <65 | I/II | Hormone Therapy | anastrozole | SD |
| PNKP | SNV | Missense_Mutation | novel | c.645C>G | p.Ile215Met | p.I215M | Q96T60 | protein_coding | deleterious(0.01) | probably_damaging(0.996) | TCGA-XX-A89A-01 | Breast | breast invasive carcinoma | Female | >=65 | I/II | Unknown | Unknown | SD |
| PNKP | insertion | Nonsense_Mutation | novel | c.1414_1415insCATGGAGGAGGCTTTAAGGAATATGAAGGCC | p.Ile472ThrfsTer6 | p.I472Tfs*6 | Q96T60 | protein_coding | TCGA-A7-A0CJ-01 | Breast | breast invasive carcinoma | Female | <65 | I/II | Chemotherapy | cytoxan | SD | ||
| PNKP | insertion | Frame_Shift_Ins | novel | c.531_532insTGGACGGGACGCTCATC | p.Thr178TrpfsTer43 | p.T178Wfs*43 | Q96T60 | protein_coding | TCGA-D8-A140-01 | Breast | breast invasive carcinoma | Female | <65 | I/II | Chemotherapy | doxorubicin+cyclophosphamid | SD | ||
| PNKP | deletion | Frame_Shift_Del | novel | c.273delN | p.Asp91GlufsTer12 | p.D91Efs*12 | Q96T60 | protein_coding | TCGA-EW-A2FV-01 | Breast | breast invasive carcinoma | Female | <65 | III/IV | Chemotherapy | docetaxel | SD | ||
| PNKP | SNV | Missense_Mutation | c.154N>A | p.Glu52Lys | p.E52K | Q96T60 | protein_coding | tolerated(0.4) | benign(0.011) | TCGA-DR-A0ZM-01 | Cervix | cervical & endocervical cancer | Female | <65 | III/IV | Unspecific | Cisplatin | SD | |
| PNKP | insertion | In_Frame_Ins | novel | c.1121_1122insGCGGCTCGGGCACACTGGACGTACCTG | p.Pro374_Gly375insArgLeuGlyHisThrGlyArgThrCys | p.P374_G375insRLGHTGRTC | Q96T60 | protein_coding | TCGA-DS-A1OB-01 | Cervix | cervical & endocervical cancer | Female | <65 | I/II | Chemotherapy | carboplatin | PD |
| Page: 1 2 3 4 |
Top |
Related drugs of malignant transformation related genes |
| Identification of chemicals and drugs interact with genes involved in malignant transfromation |
| (DGIdb 4.0) |
| Entrez ID | Symbol | Category | Interaction Types | Drug Claim Name | Drug Name | PMIDs |
| Page: 1 |

Copyright 2023-Present -The University of Texas Health Science Center at Houston |