Schematic overview of the cellular and molecular mechanisms involved in the cancer progression, including the proposed cellular and molecular mechanisms in cancer cells trajectory. AT1: alveolar type 1 cells; AT2: alveolar type 2 cells; AAH: atypical adenomatous hyperplasia; AIS: adenocarcinoma in situ; MIA: minimally invasive adenocarcinoma; IA: invasive adenocarcinoma; EMT: epithelial-mesenchymal transition

Home

Download

Statistics

Help

Contact

Center for Computational Systems Medicine
leaf

Gene summary

leaf

Malignant transformation analysis

leaf

Malignant transformation related pathway analysis

leaf

Cell-cell communication analysis

leaf

Single-cell gene regulatory network inference analysis

leaf

Somatic mutation of malignant transformation related genes

leaf

Related drugs of malignant transformation related genes

Gene: PNKD

Gene summary for PNKD

check button Gene summary.

Gene informationSpeciesHuman
Gene symbol

PNKD

Gene ID

25953

Gene namePNKD metallo-beta-lactamase domain containing
Gene AliasBRP17
Cytomap2q35
Gene Typeprotein-coding
GO ID

GO:0001505

UniProtAcc

Q8N490


Top

Malignant transformation analysis

check button Identification of the aberrant gene expression in precancerous and cancerous lesions by comparing the gene expression of stem-like cells in diseased tissues with normal stem cells
check button Malignant transformation involving gene list.
Entrez IDSymbolReplicatesSpeciesOrganTissueAdj P-valueLog2FCMalignancy
25953PNKDGSM4909281HumanBreastIDC2.29e-125.15e-010.21
25953PNKDGSM4909296HumanBreastIDC1.26e-111.39e-010.1524
25953PNKDGSM4909297HumanBreastIDC1.37e-109.84e-020.1517
25953PNKDGSM4909301HumanBreastIDC2.73e-063.55e-010.1577
25953PNKDGSM4909306HumanBreastIDC2.03e-023.47e-010.1564
25953PNKDGSM4909311HumanBreastIDC1.77e-29-2.22e-010.1534
25953PNKDGSM4909312HumanBreastIDC7.69e-08-6.01e-020.1552
25953PNKDGSM4909315HumanBreastIDC1.34e-033.76e-010.21
25953PNKDGSM4909316HumanBreastIDC2.87e-064.45e-010.21
25953PNKDGSM4909318HumanBreastIDC2.29e-055.32e-010.2031
25953PNKDGSM4909319HumanBreastIDC1.51e-37-4.10e-020.1563
25953PNKDGSM4909321HumanBreastIDC5.43e-14-1.51e-010.1559
25953PNKDNCCBC14HumanBreastDCIS2.89e-056.52e-020.2021
25953PNKDNCCBC5HumanBreastDCIS1.35e-07-3.41e-020.2046
25953PNKDP1HumanBreastIDC2.22e-16-2.22e-010.1527
25953PNKDDCIS2HumanBreastDCIS5.73e-586.20e-020.0085
25953PNKDHTA11_2487_2000001011HumanColorectumSER1.55e-085.99e-01-0.1808
25953PNKDHTA11_347_2000001011HumanColorectumAD5.00e-175.47e-01-0.1954
25953PNKDHTA11_411_2000001011HumanColorectumSER1.28e-039.00e-01-0.2602
25953PNKDHTA11_696_2000001011HumanColorectumAD4.66e-064.28e-01-0.1464
Page: 1 2 3 4 5 6 7 8 9 

check button Transcriptomic changes along malignancy continuum.
TissueExpression DynamicsAbbreviation
BreastThe image shows the transcriptomic changes along malignancy continuum.log2FC in expression of this searched gene in stem-like cells from each diseased tissue sample relative to stem-like cells in normal samples in each tissue plotted against the malignancy continuum. Samples are colored based on if they are from different disease stage.
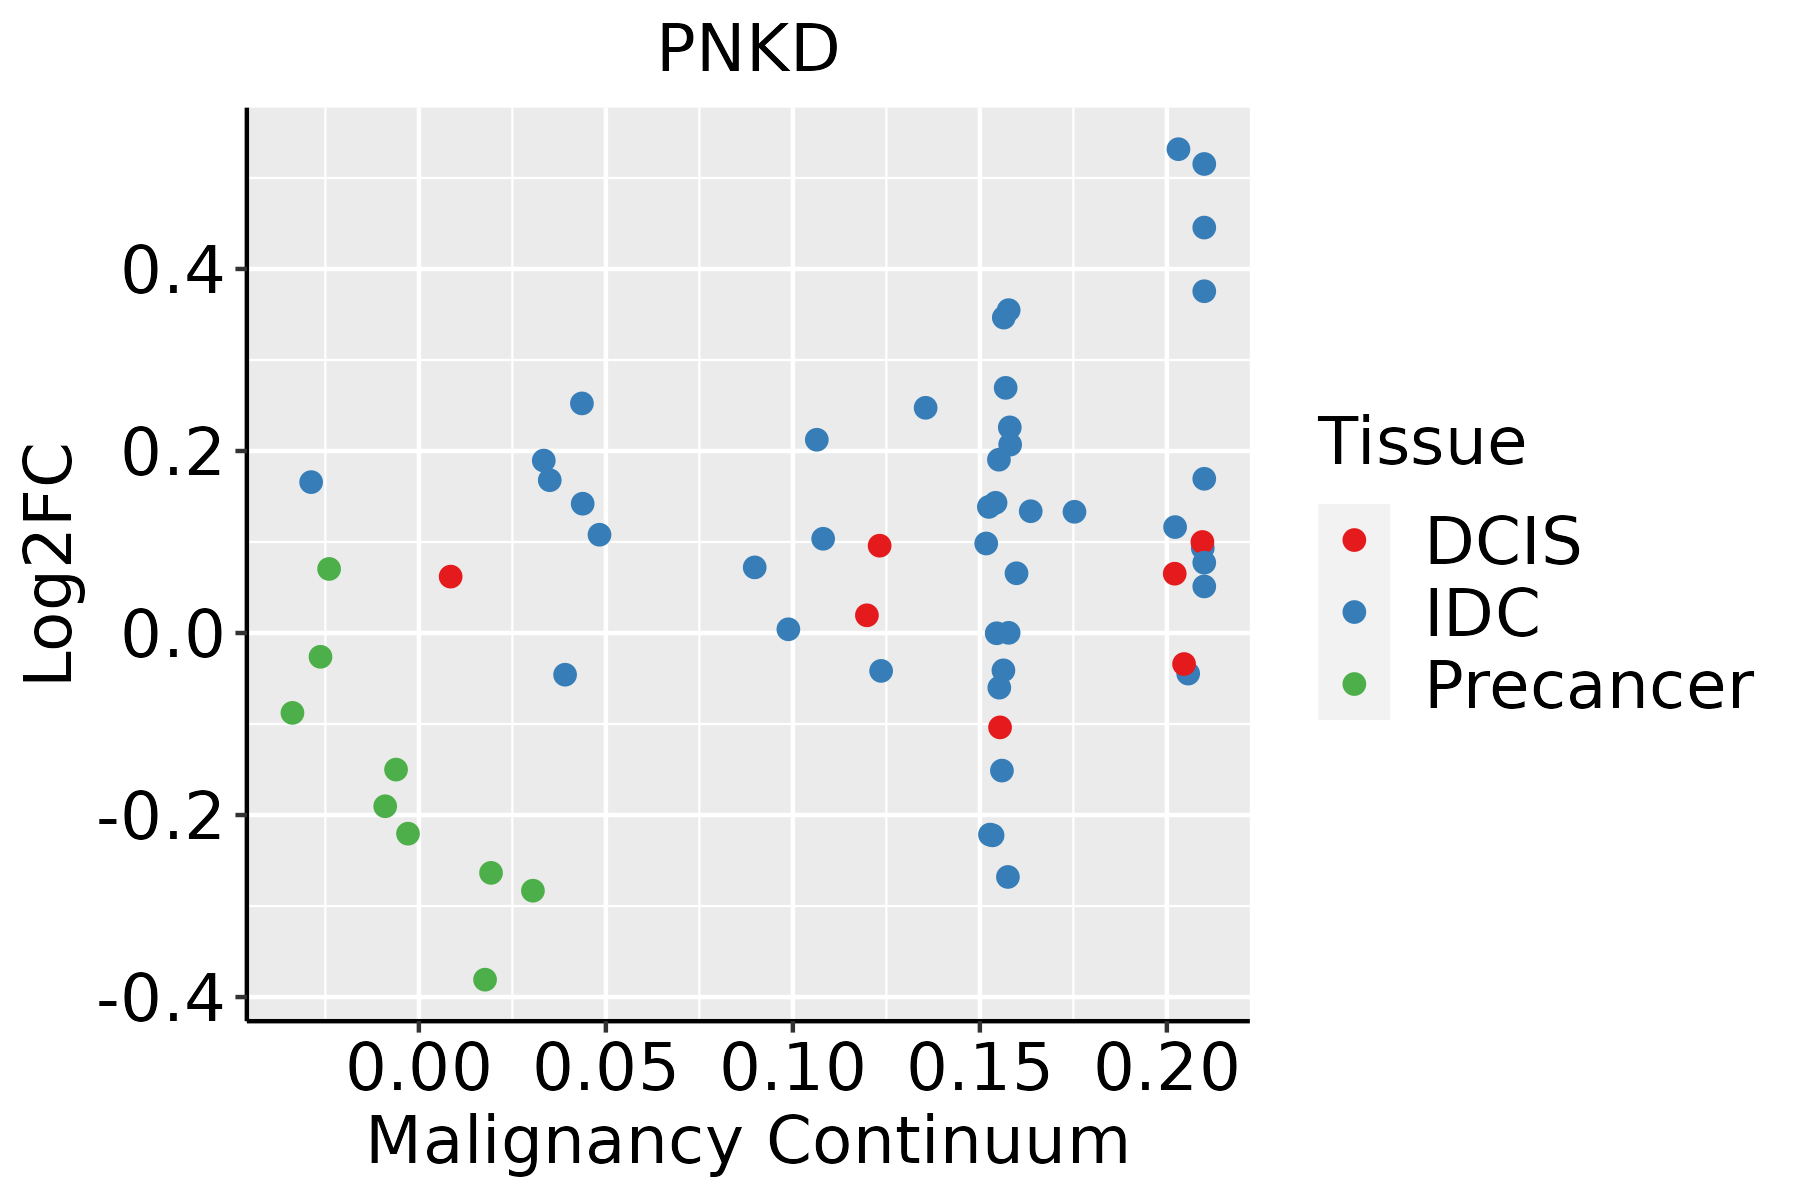
IDC: Invasive ductal carcinoma
DCIS: Ductal carcinoma in situ
Precancer(BRCA1-mut): Precancerous lesion from BRCA1 mutation carriers
Colorectum (GSE201348)The image shows the transcriptomic changes along malignancy continuum.log2FC in expression of this searched gene in stem-like cells from each diseased tissue sample relative to stem-like cells in normal samples in each tissue plotted against the malignancy continuum. Samples are colored based on if they are from different disease stage.FAP: Familial adenomatous polyposis
CRC: Colorectal cancer
Colorectum (HTA11)The image shows the transcriptomic changes along malignancy continuum.log2FC in expression of this searched gene in stem-like cells from each diseased tissue sample relative to stem-like cells in normal samples in each tissue plotted against the malignancy continuum. Samples are colored based on if they are from different disease stage.AD: Adenomas
SER: Sessile serrated lesions
MSI-H: Microsatellite-high colorectal cancer
MSS: Microsatellite stable colorectal cancer
EsophagusThe image shows the transcriptomic changes along malignancy continuum.log2FC in expression of this searched gene in stem-like cells from each diseased tissue sample relative to stem-like cells in normal samples in each tissue plotted against the malignancy continuum. Samples are colored based on if they are from different disease stage.
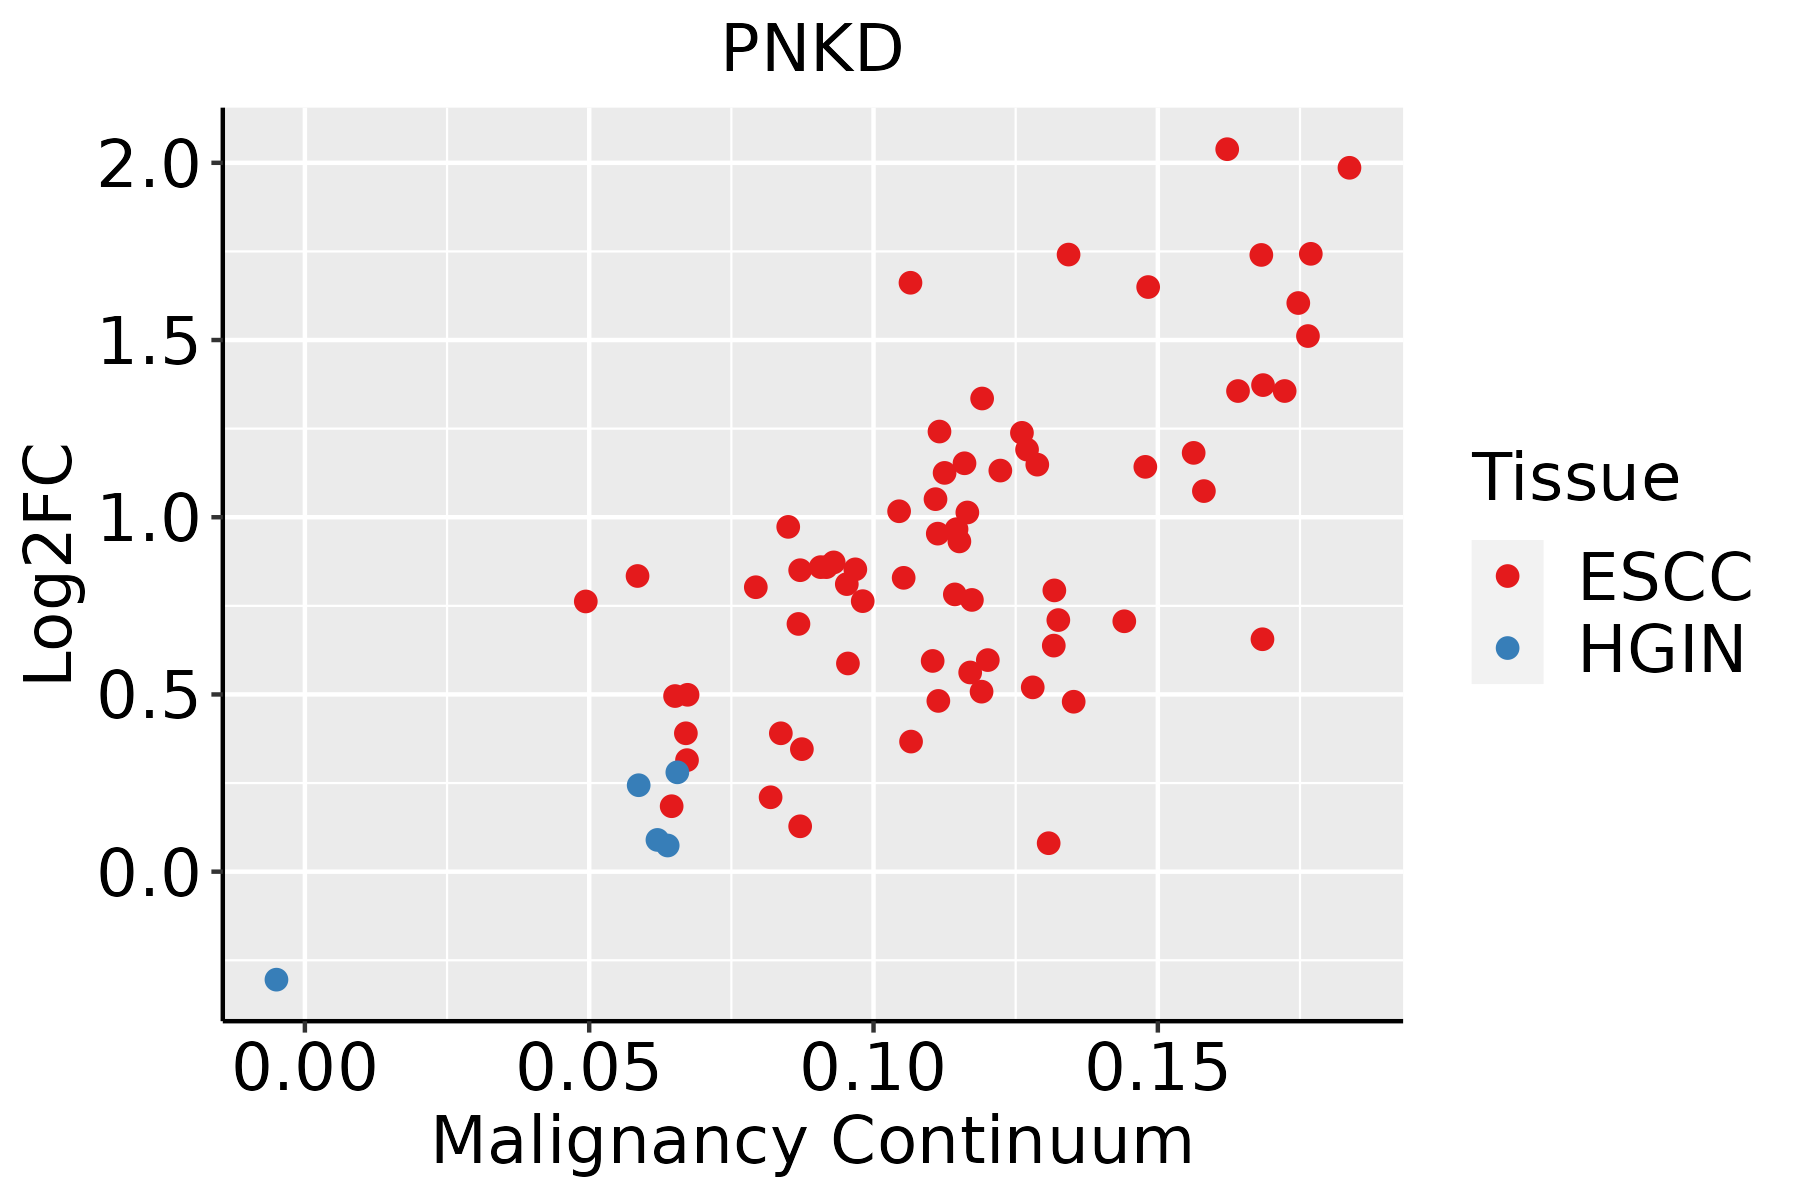
ESCC: Esophageal squamous cell carcinoma
HGIN: High-grade intraepithelial neoplasias
LGIN: Low-grade intraepithelial neoplasias
LiverThe image shows the transcriptomic changes along malignancy continuum.log2FC in expression of this searched gene in stem-like cells from each diseased tissue sample relative to stem-like cells in normal samples in each tissue plotted against the malignancy continuum. Samples are colored based on if they are from different disease stage.
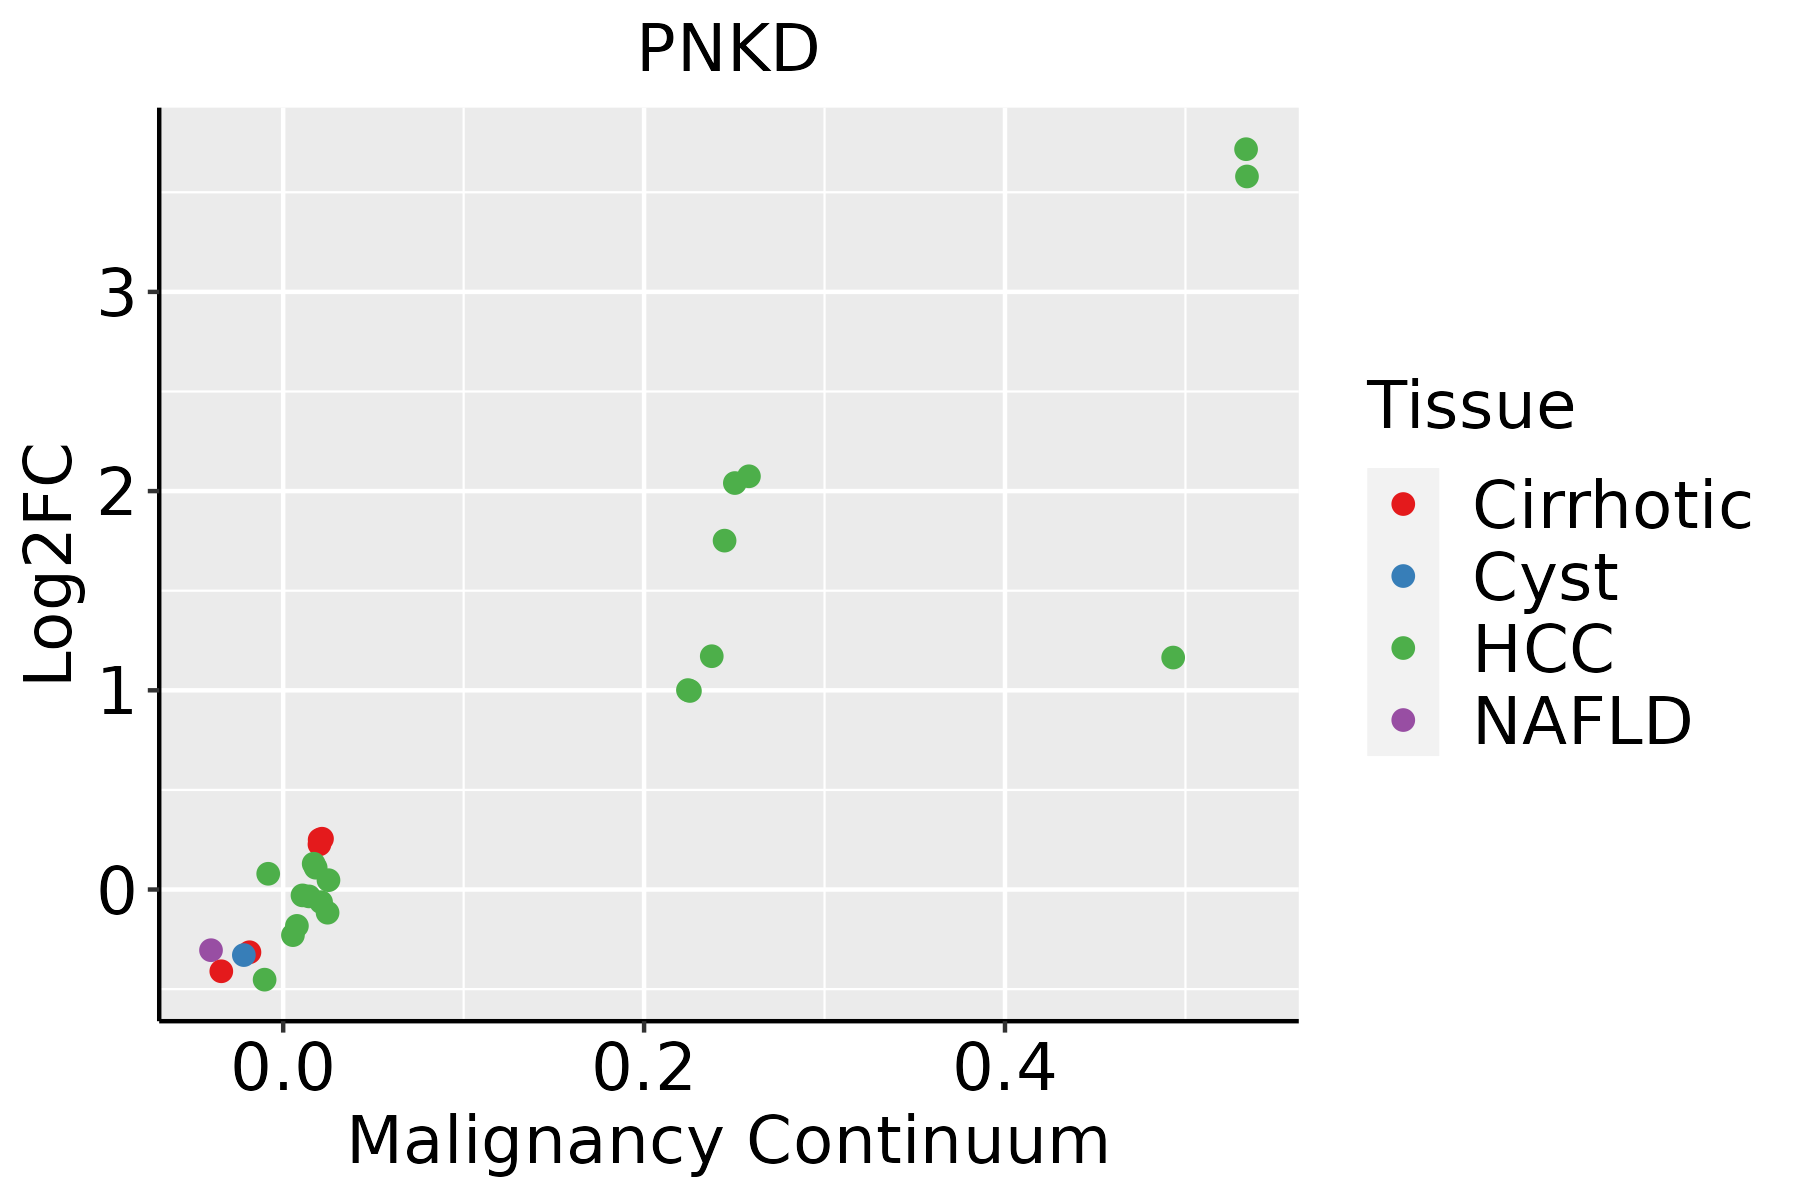
HCC: Hepatocellular carcinoma
NAFLD: Non-alcoholic fatty liver disease
Oral CavityThe image shows the transcriptomic changes along malignancy continuum.log2FC in expression of this searched gene in stem-like cells from each diseased tissue sample relative to stem-like cells in normal samples in each tissue plotted against the malignancy continuum. Samples are colored based on if they are from different disease stage.EOLP: Erosive Oral lichen planus
LP: leukoplakia
NEOLP: Non-erosive oral lichen planus
OSCC: Oral squamous cell carcinoma
ProstateThe image shows the transcriptomic changes along malignancy continuum.log2FC in expression of this searched gene in stem-like cells from each diseased tissue sample relative to stem-like cells in normal samples in each tissue plotted against the malignancy continuum. Samples are colored based on if they are from different disease stage.
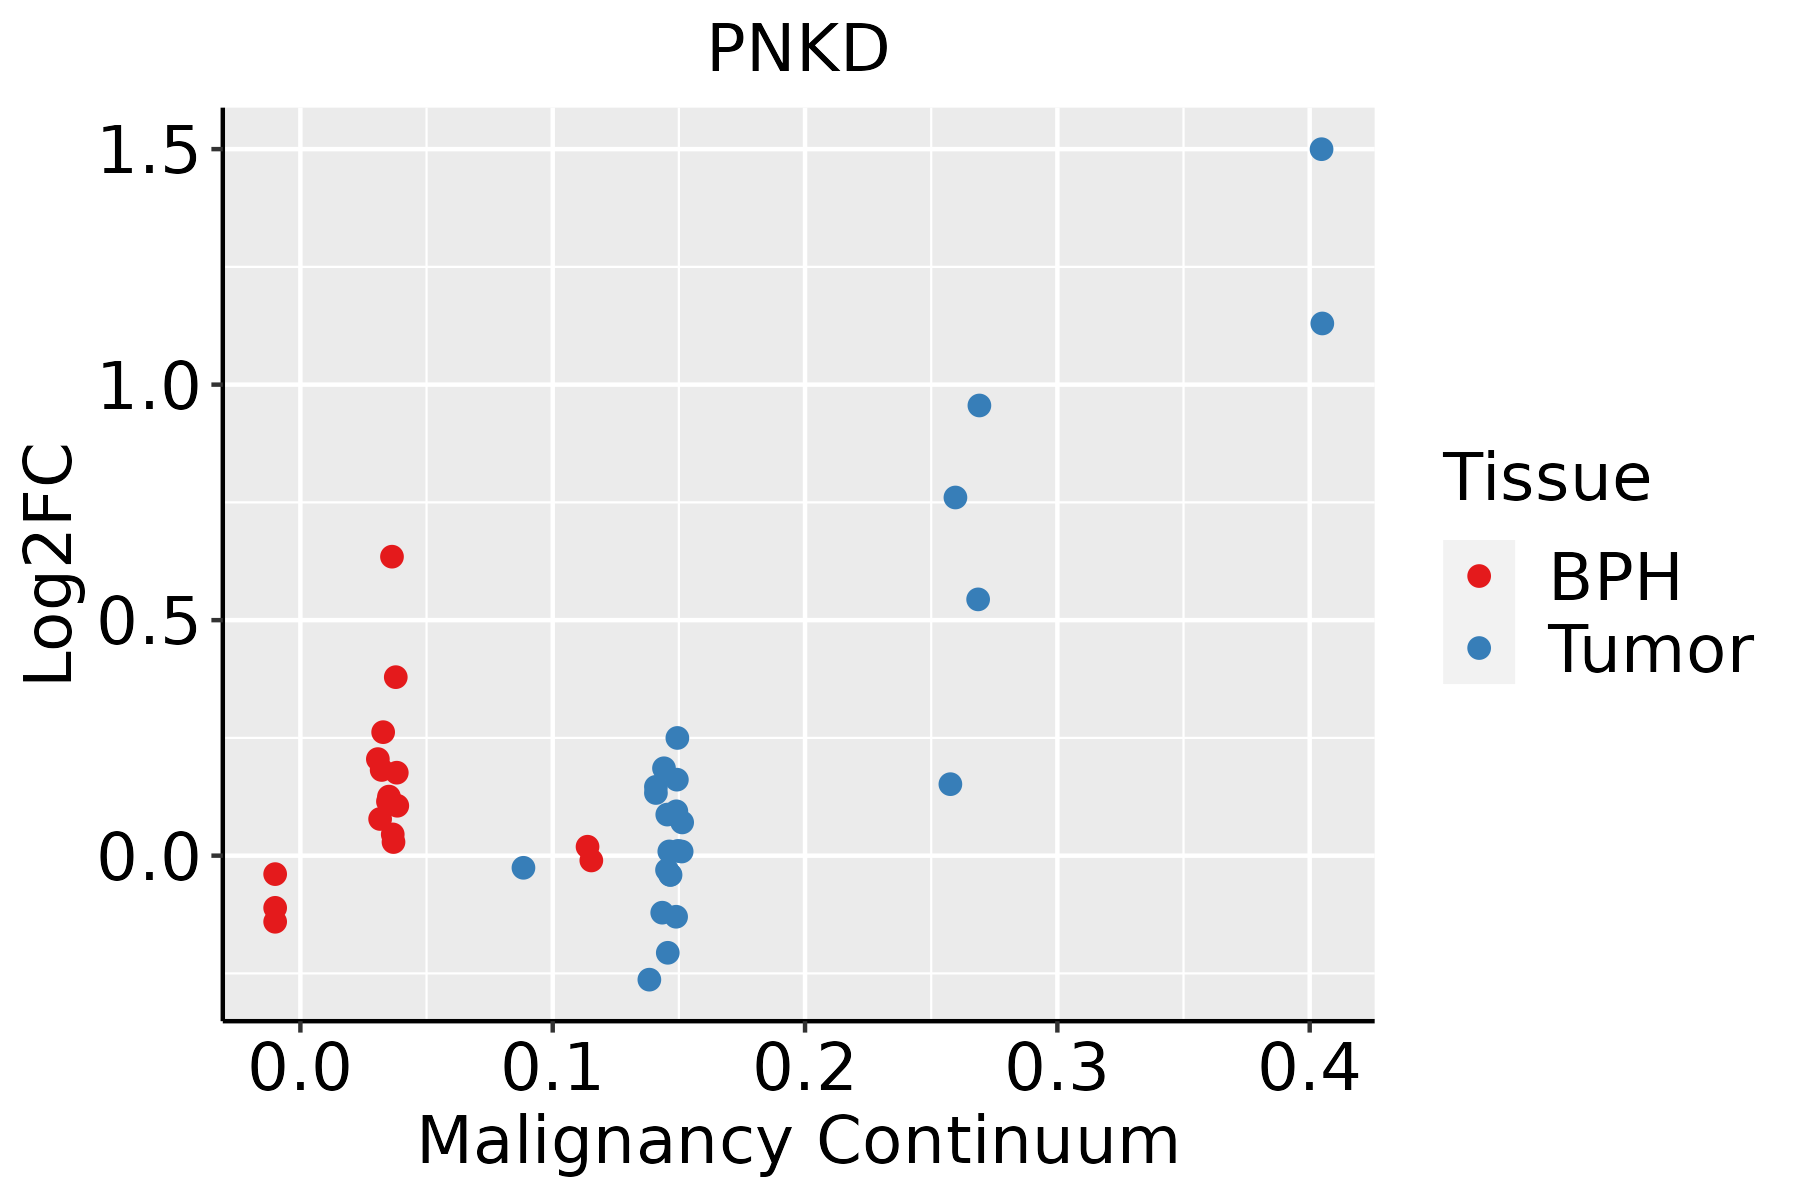
BPH: Benign Prostatic Hyperplasia
SkinThe image shows the transcriptomic changes along malignancy continuum.log2FC in expression of this searched gene in stem-like cells from each diseased tissue sample relative to stem-like cells in normal samples in each tissue plotted against the malignancy continuum. Samples are colored based on if they are from different disease stage.
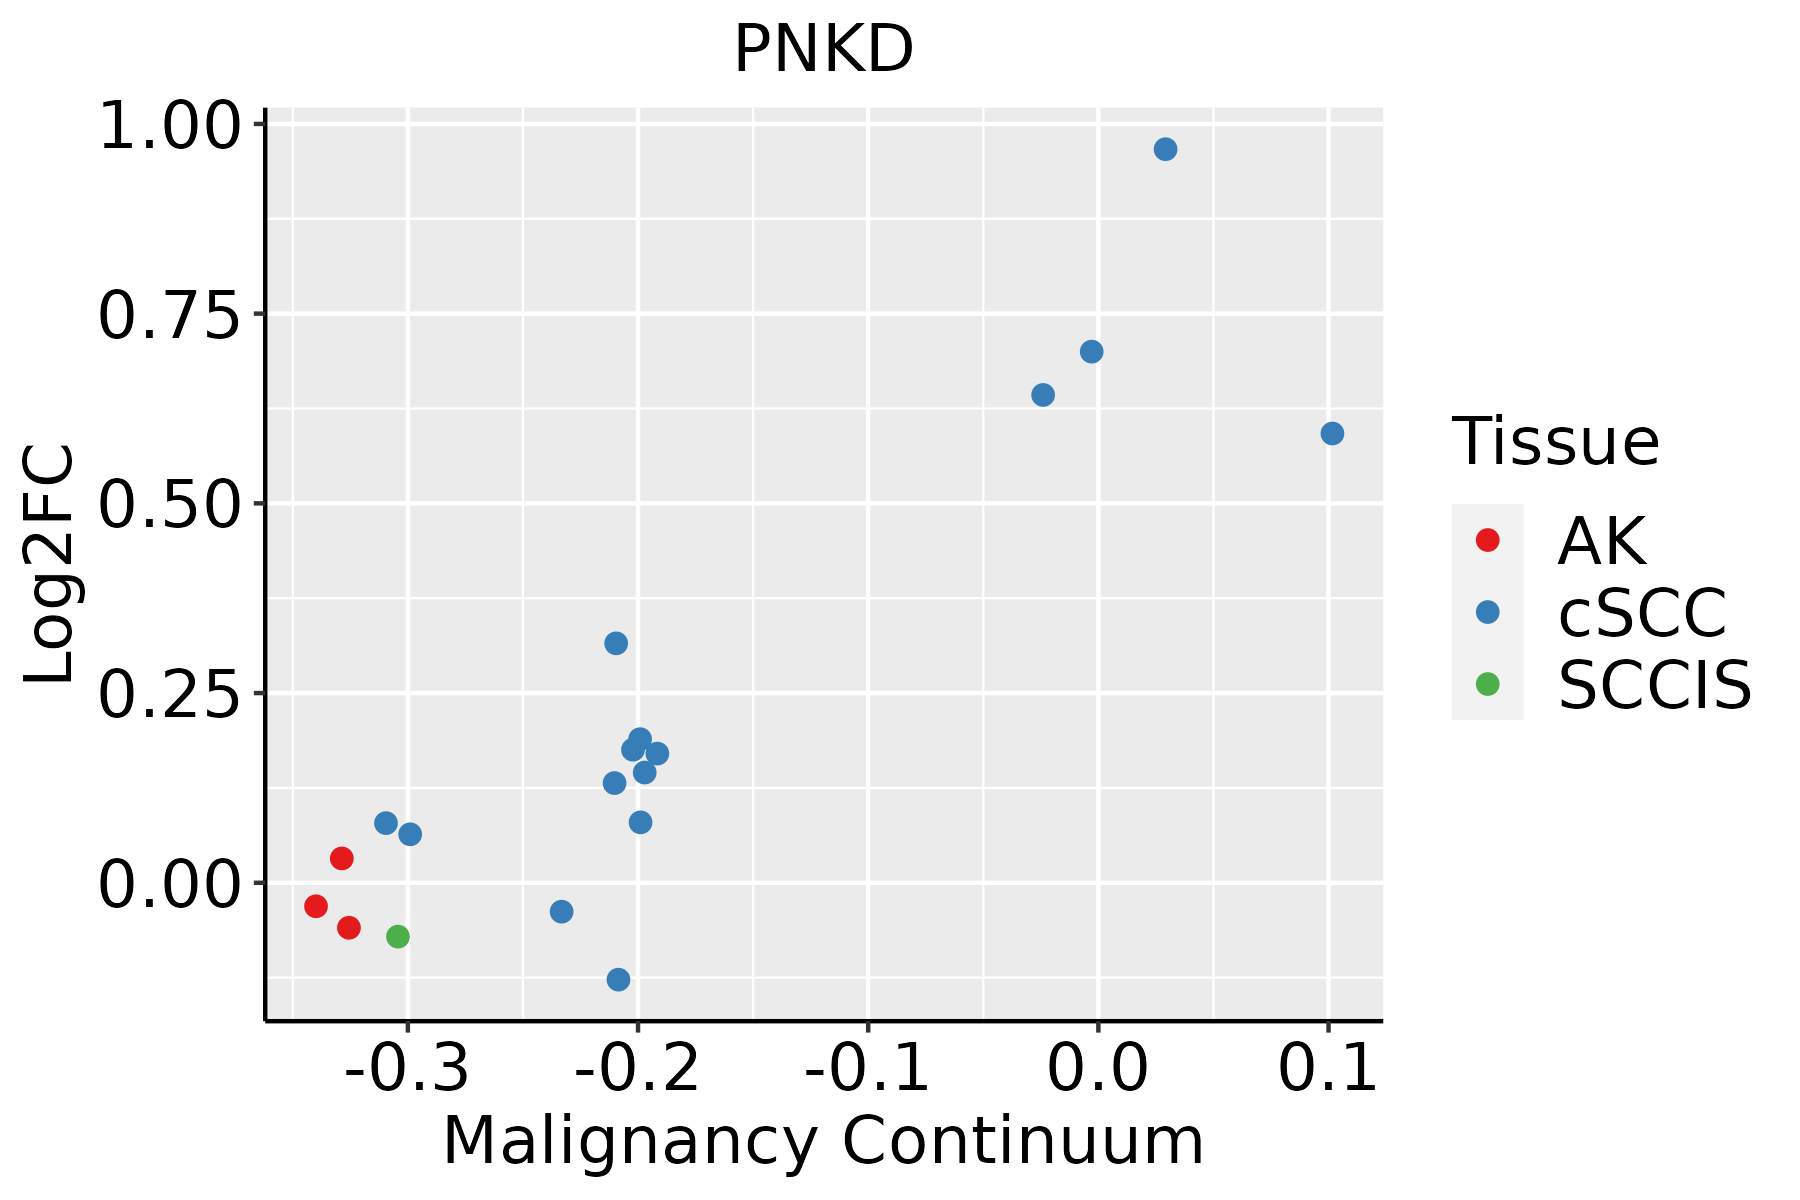
AK: Actinic keratosis
cSCC: Cutaneous squamous cell carcinoma
SCCIS:squamous cell carcinoma in situ
ThyroidThe image shows the transcriptomic changes along malignancy continuum.log2FC in expression of this searched gene in stem-like cells from each diseased tissue sample relative to stem-like cells in normal samples in each tissue plotted against the malignancy continuum. Samples are colored based on if they are from different disease stage.
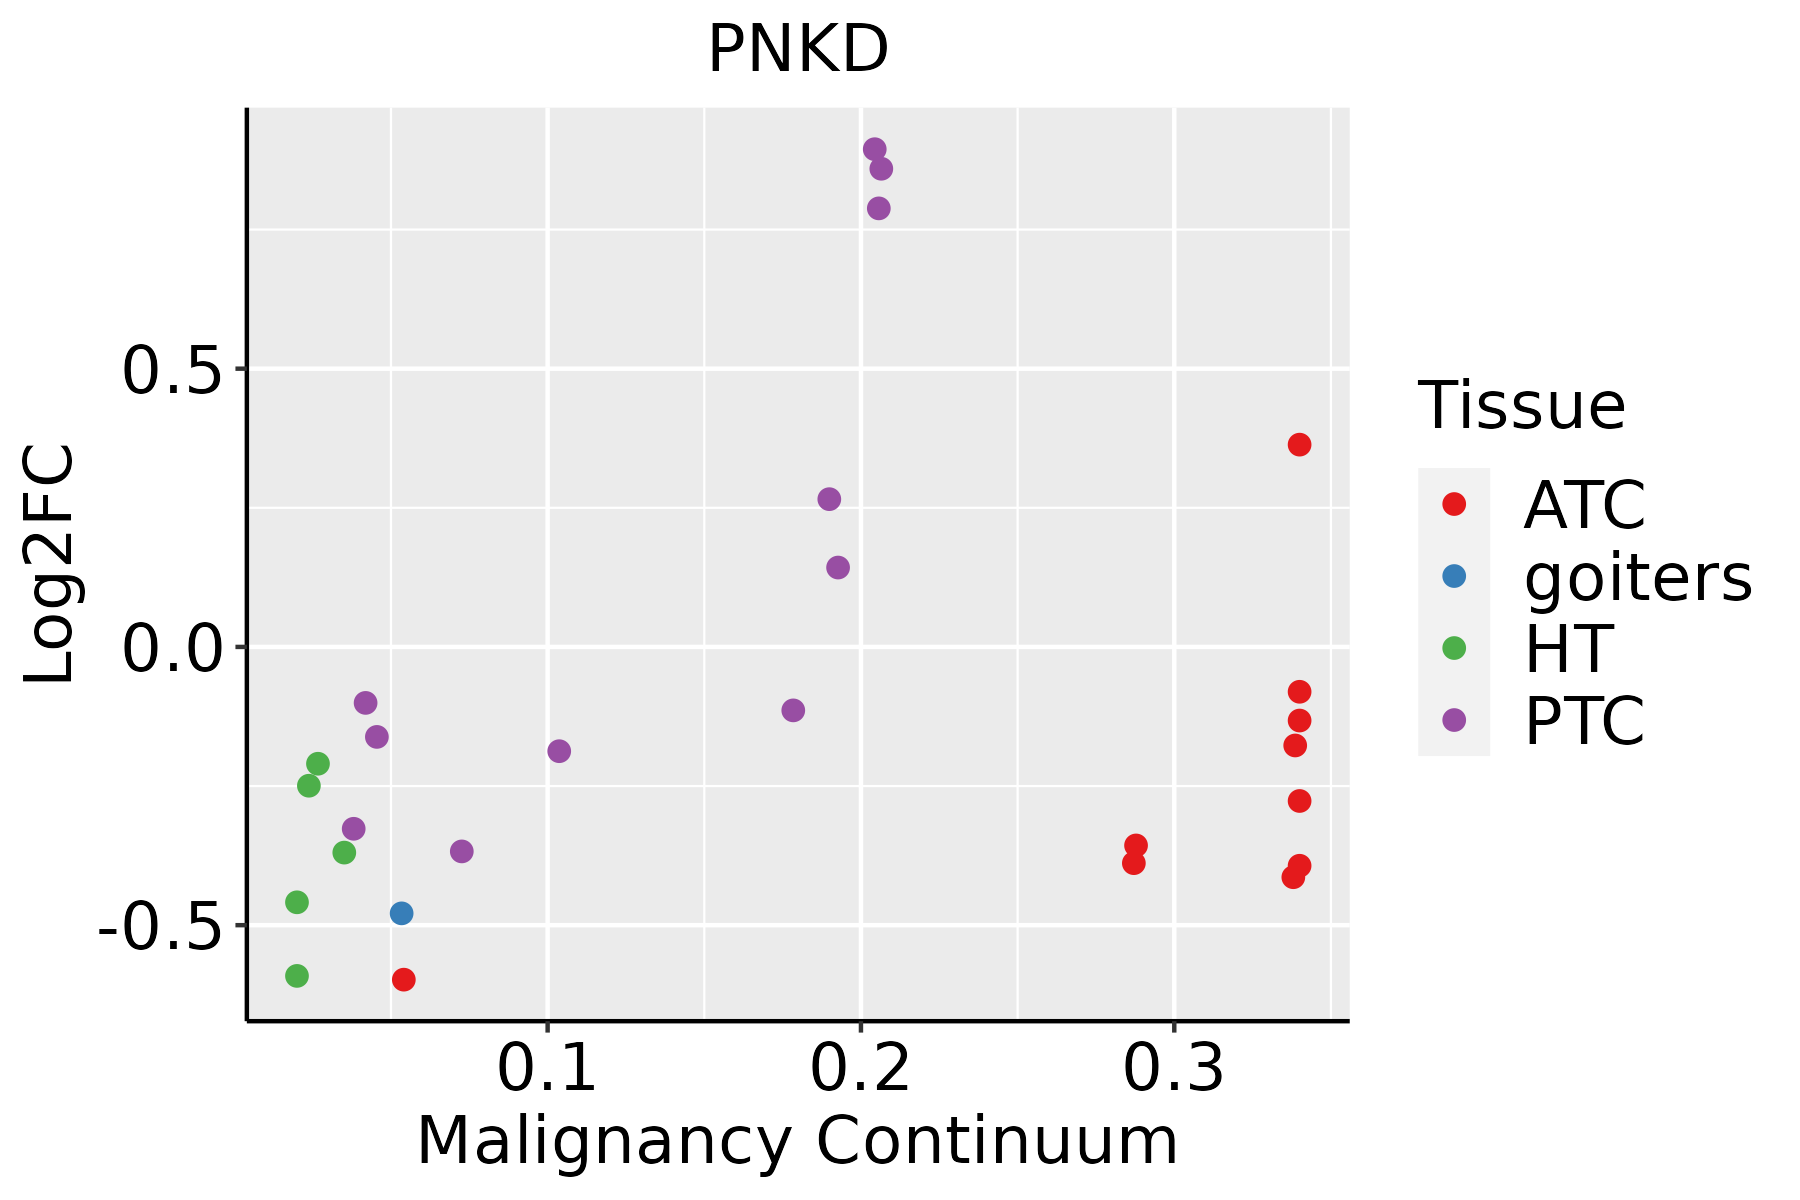
ATC: Anaplastic thyroid cancer
HT: Hashimoto's thyroiditis
PTC: Papillary thyroid cancer
∗log2FC in expression of this searched gene in stem-like cells from each diseased tissue sample relative to stem-like cells in normal samples in each tissue plotted against the malignancy continuum. Samples are colored based on if they are from different disease stage.

Top

Malignant transformation related pathway analysis

check buttonFind out the enriched GO biological processes and KEGG pathways involved in transition from healthy to precancer to cancer
check button Figure of enriched GO biological processes.
TissueDisease StageEnriched GO biological Processes
ColorectumADGO analysis - Figure of enriched GO biological processes: Top 15 enriched GO BP terms are showed in the bar plot of each disease state in each tissue. Each row represents a significant GO biological process which is colored according to the -log10(p.adjust).
ColorectumSERGO analysis - Figure of enriched GO biological processes: Top 15 enriched GO BP terms are showed in the bar plot of each disease state in each tissue. Each row represents a significant GO biological process which is colored according to the -log10(p.adjust).
ColorectumMSSGO analysis - Figure of enriched GO biological processes: Top 15 enriched GO BP terms are showed in the bar plot of each disease state in each tissue. Each row represents a significant GO biological process which is colored according to the -log10(p.adjust).
ColorectumMSI-HGO analysis - Figure of enriched GO biological processes: Top 15 enriched GO BP terms are showed in the bar plot of each disease state in each tissue. Each row represents a significant GO biological process which is colored according to the -log10(p.adjust).
ColorectumFAPGO analysis - Figure of enriched GO biological processes: Top 15 enriched GO BP terms are showed in the bar plot of each disease state in each tissue. Each row represents a significant GO biological process which is colored according to the -log10(p.adjust).
∗Top 15 enriched GO BP terms are showed in the bar plot of each disease state in each tissue. Each row represents a significant GO biological process which is colored according to the -log10(p.adjust).
Page: 1 2 3 4 5 6 7 8 9 

check button Enriched GO biological processes.
GO IDTissueDisease StageDescriptionGene RatioBg Ratiopvaluep.adjustCount
GO:0044282ColorectumADsmall molecule catabolic process118/3918376/187231.05e-063.55e-05118
GO:0006081ColorectumADcellular aldehyde metabolic process22/391860/187233.64e-032.60e-0222
GO:00442821ColorectumSERsmall molecule catabolic process87/2897376/187235.31e-051.27e-0387
GO:0051051ColorectumSERnegative regulation of transport98/2897470/187231.01e-031.19e-0298
GO:1903531ColorectumSERnegative regulation of secretion by cell35/2897147/187235.21e-033.95e-0235
GO:0051048ColorectumSERnegative regulation of secretion39/2897171/187237.17e-034.99e-0239
GO:00442822ColorectumMSSsmall molecule catabolic process94/3467376/187239.85e-049.86e-0394
GO:00060811ColorectumMSScellular aldehyde metabolic process21/346760/187231.81e-031.60e-0221
GO:00510511ColorectumMSSnegative regulation of transport110/3467470/187234.20e-033.04e-02110
GO:0023061ColorectumFAPsignal release94/2622463/187231.06e-041.76e-0394
GO:00442823ColorectumFAPsmall molecule catabolic process77/2622376/187233.25e-044.16e-0377
GO:00510512ColorectumFAPnegative regulation of transport91/2622470/187237.09e-047.64e-0391
GO:00421805EsophagusESCCcellular ketone metabolic process120/8552211/187236.70e-043.55e-03120
GO:00060818EsophagusESCCcellular aldehyde metabolic process40/855260/187238.30e-044.28e-0340
GO:00442827EsophagusESCCsmall molecule catabolic process201/8552376/187231.35e-036.41e-03201
GO:004428211LiverCirrhoticsmall molecule catabolic process151/4634376/187232.20e-111.34e-09151
GO:004218011LiverCirrhoticcellular ketone metabolic process80/4634211/187231.40e-051.95e-0480
GO:00060815LiverCirrhoticcellular aldehyde metabolic process28/463460/187231.83e-041.71e-0328
GO:0044106LiverCirrhoticcellular amine metabolic process43/4634113/187231.15e-037.83e-0343
GO:0046185LiverCirrhoticaldehyde catabolic process8/463412/187232.59e-031.53e-028
Page: 1 2 3 

check button Enriched KEGG pathways.
Pathway IDTissueDisease StageDescriptionGene RatioBg Ratiopvaluep.adjustqvalueCount
Page: 1 

Top

Cell-cell communication analysis

check buttonIdentification of potential cell-cell interactions between two cell types and their ligand-receptor pairs for different disease states
LigandReceptorLRpairPathwayTissueDisease Stage
Page: 1 

Top

Single-cell gene regulatory network inference analysis

check buttonFind out the significant the regulons (TFs) and the target genes of each regulon across cell types for different disease states
TFCell TypeTissueDisease StageTarget GeneRSSRegulon Activity
∗The dot plots of a searched regulon are shown for all cell subpopulations in each disease state of each tissue based on the regulon specific score inferred using pySCENIC and by calculating the average expression.
Page: 1 

Top

Somatic mutation of malignant transformation related genes

check buttonAnnotation of somatic variants for genes involved in malignant transformation
Hugo SymbolVariant ClassVariant ClassificationdbSNP RSHGVScHGVSpHGVSp ShortSWISSPROTBIOTYPESIFTPolyPhenTumor Sample BarcodeTissueHistologySexAgeStageTherapy TypesDrugsOutcome
PNKDSNVMissense_Mutationnovelc.1070N>Cp.Gly357Alap.G357AQ8N490protein_codingtolerated(0.61)benign(0.003)TCGA-A2-A3Y0-01Breastbreast invasive carcinomaFemale<65I/IIChemotherapyadriamycinCR
PNKDSNVMissense_Mutationnovelc.449N>Tp.Asp150Valp.D150VQ8N490protein_codingtolerated(0.09)probably_damaging(0.99)TCGA-AQ-A7U7-01Breastbreast invasive carcinomaFemale<65III/IVTargeted Molecular therapyrituximabCR
PNKDinsertionFrame_Shift_Insnovelc.116_117insTCCTp.Ala40ProfsTer16p.A40Pfs*16Q8N490protein_codingTCGA-A8-A07J-01Breastbreast invasive carcinomaFemale<65I/IIChemotherapy5-fluorouracilCR
PNKDinsertionFrame_Shift_Insnovelc.117_118insCCTCAACCTCCCGAGGAGCTGGGACTACAGGCp.Ala40ProfsTer44p.A40Pfs*44Q8N490protein_codingTCGA-A8-A07J-01Breastbreast invasive carcinomaFemale<65I/IIChemotherapy5-fluorouracilCR
PNKDinsertionIn_Frame_Insnovelc.815_816insTGGCCCCCTTCAp.Leu272_Ser273insGlyProLeuGlnp.L272_S273insGPLQQ8N490protein_codingTCGA-BH-A0BR-01Breastbreast invasive carcinomaFemale<65I/IIUnknownUnknownSD
PNKDSNVMissense_Mutationnovelc.341G>Cp.Arg114Prop.R114PQ8N490protein_codingtolerated(0.2)benign(0.371)TCGA-C5-A902-01Cervixcervical & endocervical cancerFemale<65I/IIChemotherapycisplatinSD
PNKDSNVMissense_Mutationrs148141539c.1130N>Ap.Arg377Glnp.R377QQ8N490protein_codingtolerated(0.24)benign(0)TCGA-IR-A3LK-01Cervixcervical & endocervical cancerFemale>=65I/IIChemotherapycisplatinPD
PNKDSNVMissense_Mutationc.505N>Ap.Leu169Metp.L169MQ8N490protein_codingdeleterious(0)probably_damaging(0.998)TCGA-AZ-4315-01Colorectumcolon adenocarcinomaMale<65I/IIUnknownUnknownSD
PNKDSNVMissense_Mutationnovelc.899N>Gp.Phe300Cysp.F300CQ8N490protein_codingdeleterious(0)probably_damaging(0.991)TCGA-AJ-A3EK-01Endometriumuterine corpus endometrioid carcinomaFemale<65I/IIChemotherapycarboplatinCR
PNKDSNVMissense_Mutationc.505N>Ap.Leu169Metp.L169MQ8N490protein_codingdeleterious(0)probably_damaging(0.998)TCGA-AP-A056-01Endometriumuterine corpus endometrioid carcinomaFemale<65I/IIUnknownUnknownSD
Page: 1 2 3 4 

Top

Related drugs of malignant transformation related genes

check buttonIdentification of chemicals and drugs interact with genes involved in malignant transfromation
(DGIdb 4.0)
Entrez IDSymbolCategoryInteraction TypesDrug Claim NameDrug NamePMIDs
Page: 1