
|
|||||
|
 | |
| |
| |
| |
| |
| |
|
Gene: PMVK |
Gene summary for PMVK |
| Gene information | Species | Human | Gene symbol | PMVK | Gene ID | 10654 |
| Gene name | phosphomevalonate kinase | |
| Gene Alias | HUMPMKI | |
| Cytomap | 1q21.3 | |
| Gene Type | protein-coding | GO ID | GO:0006066 | UniProtAcc | Q6FGV9 |
Top |
Malignant transformation analysis |
| Identification of the aberrant gene expression in precancerous and cancerous lesions by comparing the gene expression of stem-like cells in diseased tissues with normal stem cells |
| Entrez ID | Symbol | Replicates | Species | Organ | Tissue | Adj P-value | Log2FC | Malignancy |
| 10654 | PMVK | GSM4909291 | Human | Breast | IDC | 1.11e-07 | 3.85e-01 | 0.1753 |
| 10654 | PMVK | GSM4909293 | Human | Breast | IDC | 2.63e-02 | 1.70e-01 | 0.1581 |
| 10654 | PMVK | GSM4909296 | Human | Breast | IDC | 1.48e-03 | 6.28e-02 | 0.1524 |
| 10654 | PMVK | GSM4909297 | Human | Breast | IDC | 2.50e-03 | 5.18e-02 | 0.1517 |
| 10654 | PMVK | GSM4909298 | Human | Breast | IDC | 5.64e-07 | 3.34e-01 | 0.1551 |
| 10654 | PMVK | GSM4909301 | Human | Breast | IDC | 6.29e-03 | -9.69e-02 | 0.1577 |
| 10654 | PMVK | GSM4909302 | Human | Breast | IDC | 6.37e-07 | 3.21e-01 | 0.1545 |
| 10654 | PMVK | GSM4909304 | Human | Breast | IDC | 9.11e-10 | 4.48e-01 | 0.1636 |
| 10654 | PMVK | GSM4909306 | Human | Breast | IDC | 4.63e-15 | 5.22e-01 | 0.1564 |
| 10654 | PMVK | GSM4909307 | Human | Breast | IDC | 4.43e-10 | 4.37e-01 | 0.1569 |
| 10654 | PMVK | GSM4909308 | Human | Breast | IDC | 1.18e-25 | 5.99e-01 | 0.158 |
| 10654 | PMVK | GSM4909311 | Human | Breast | IDC | 1.63e-15 | -4.37e-02 | 0.1534 |
| 10654 | PMVK | GSM4909312 | Human | Breast | IDC | 5.72e-07 | 1.77e-01 | 0.1552 |
| 10654 | PMVK | GSM4909313 | Human | Breast | IDC | 1.56e-04 | 2.59e-01 | 0.0391 |
| 10654 | PMVK | GSM4909319 | Human | Breast | IDC | 2.31e-32 | 2.43e-01 | 0.1563 |
| 10654 | PMVK | GSM4909320 | Human | Breast | IDC | 3.64e-08 | 3.59e-01 | 0.1575 |
| 10654 | PMVK | GSM4909321 | Human | Breast | IDC | 6.14e-15 | 3.81e-01 | 0.1559 |
| 10654 | PMVK | M2 | Human | Breast | IDC | 1.81e-10 | 5.40e-01 | 0.21 |
| 10654 | PMVK | M5 | Human | Breast | IDC | 2.27e-05 | 5.74e-01 | 0.1598 |
| 10654 | PMVK | NCCBC14 | Human | Breast | DCIS | 7.52e-12 | 3.55e-01 | 0.2021 |
| Page: 1 2 3 4 5 6 7 8 |
| Tissue | Expression Dynamics | Abbreviation |
| Breast | 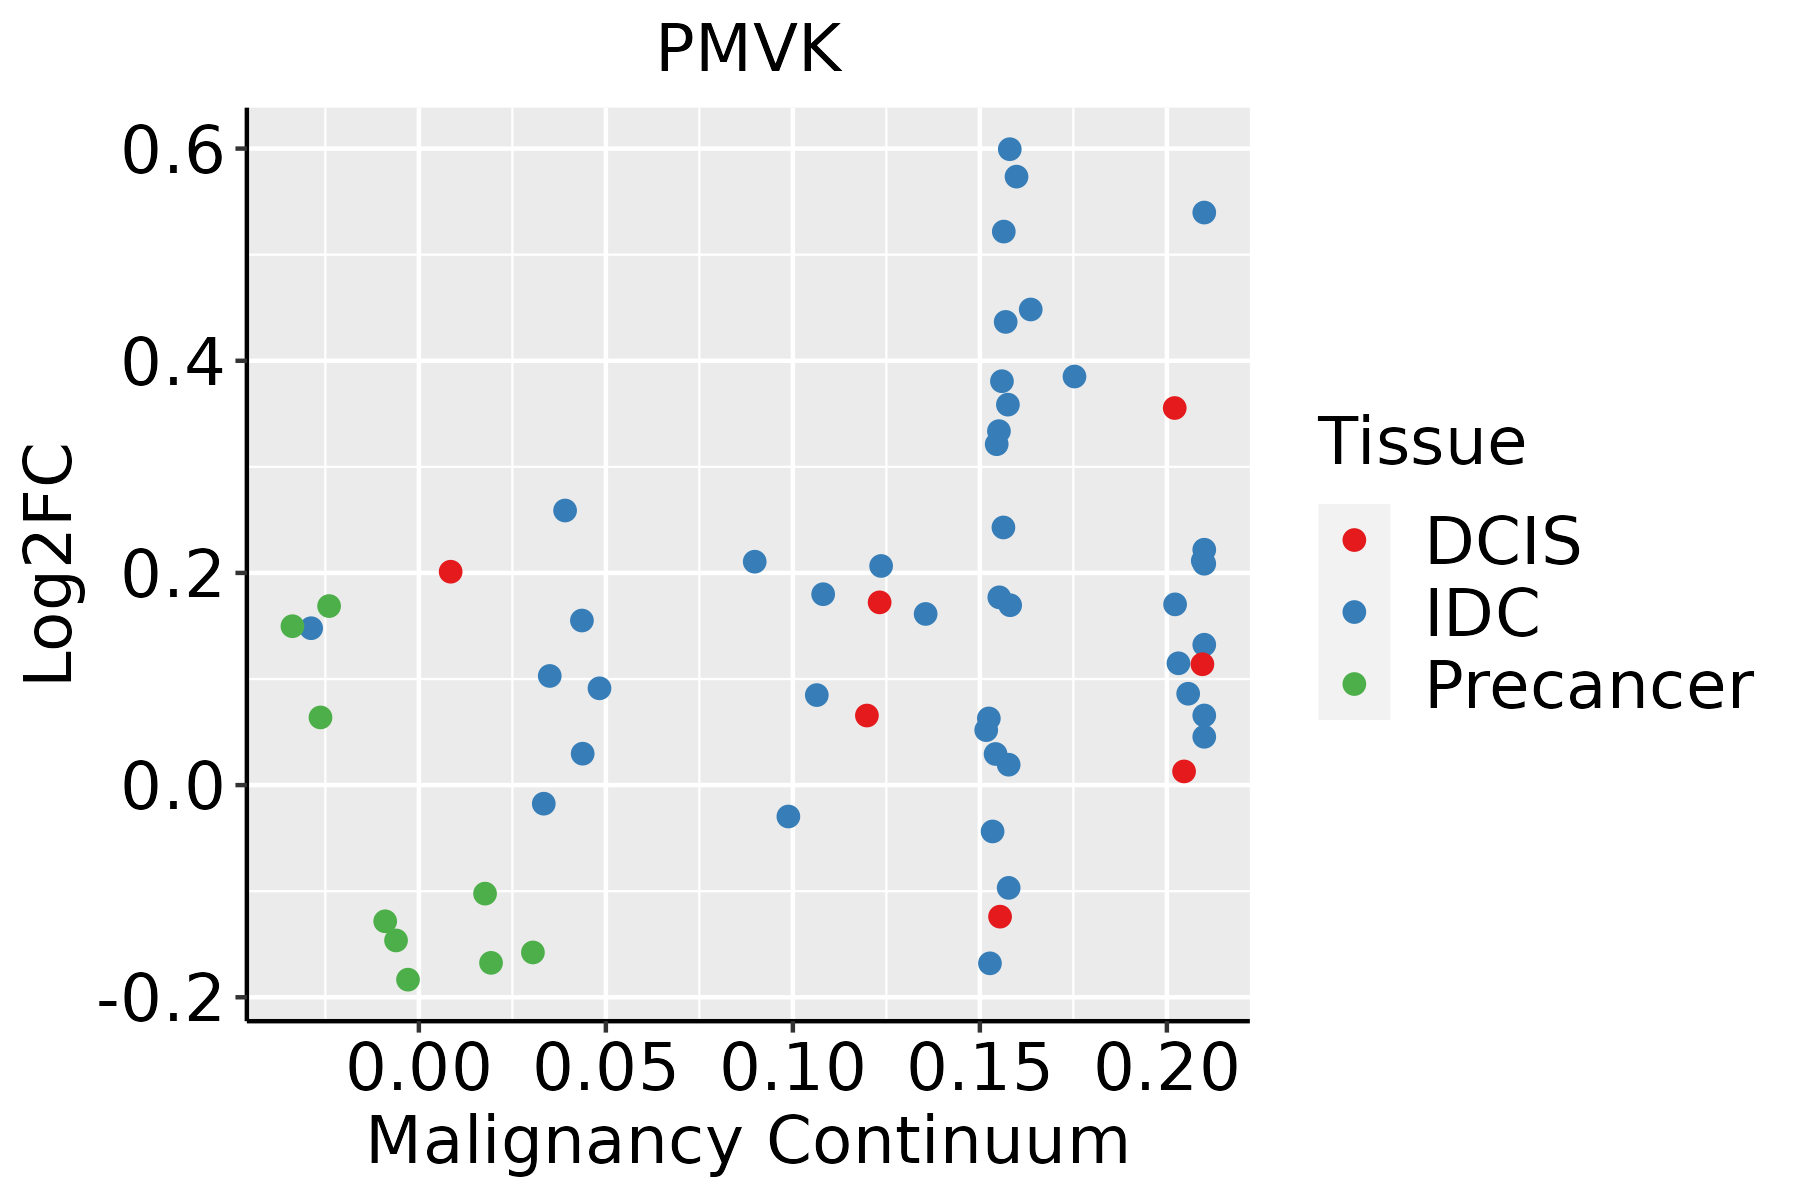 | IDC: Invasive ductal carcinoma |
| DCIS: Ductal carcinoma in situ | ||
| Precancer(BRCA1-mut): Precancerous lesion from BRCA1 mutation carriers | ||
| Esophagus | 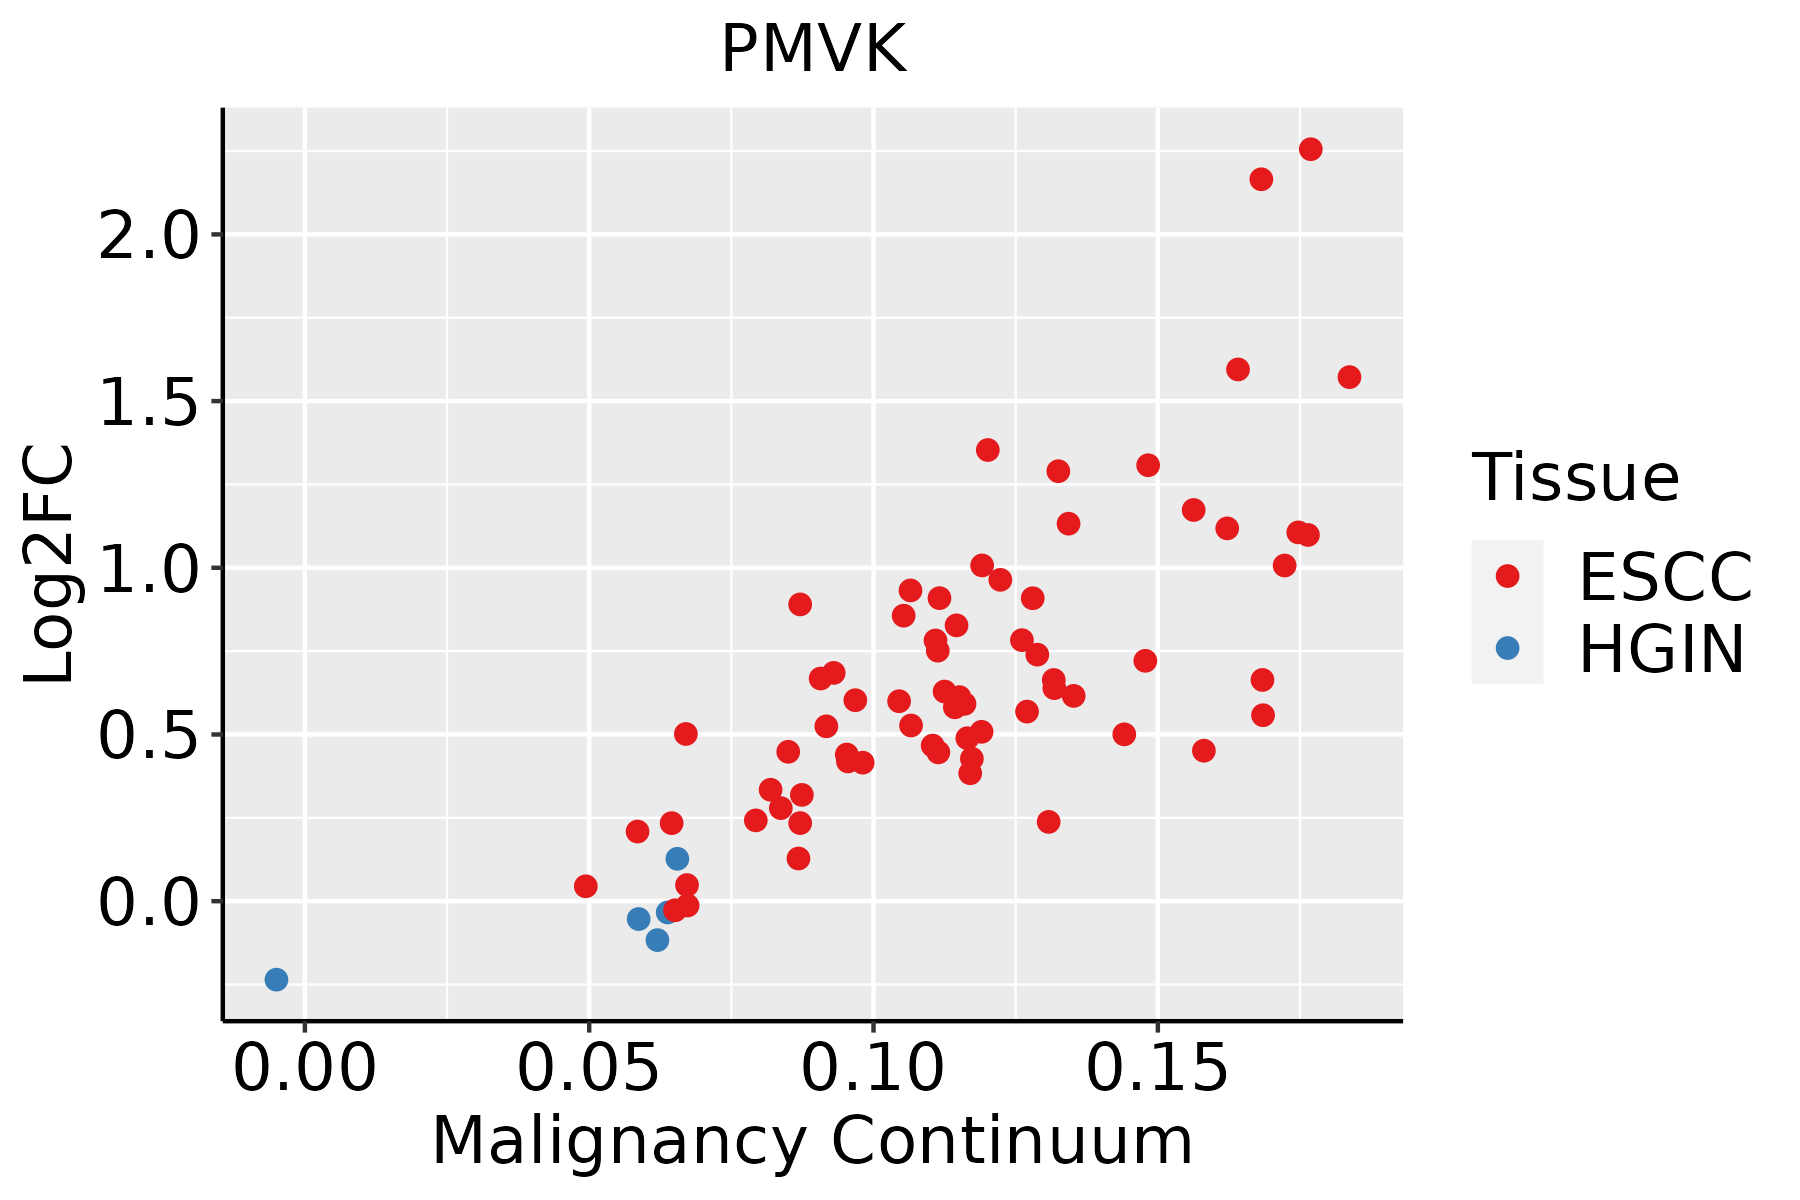 | ESCC: Esophageal squamous cell carcinoma |
| HGIN: High-grade intraepithelial neoplasias | ||
| LGIN: Low-grade intraepithelial neoplasias | ||
| Liver |  | HCC: Hepatocellular carcinoma |
| NAFLD: Non-alcoholic fatty liver disease | ||
| Oral Cavity |  | EOLP: Erosive Oral lichen planus |
| LP: leukoplakia | ||
| NEOLP: Non-erosive oral lichen planus | ||
| OSCC: Oral squamous cell carcinoma | ||
| Prostate | 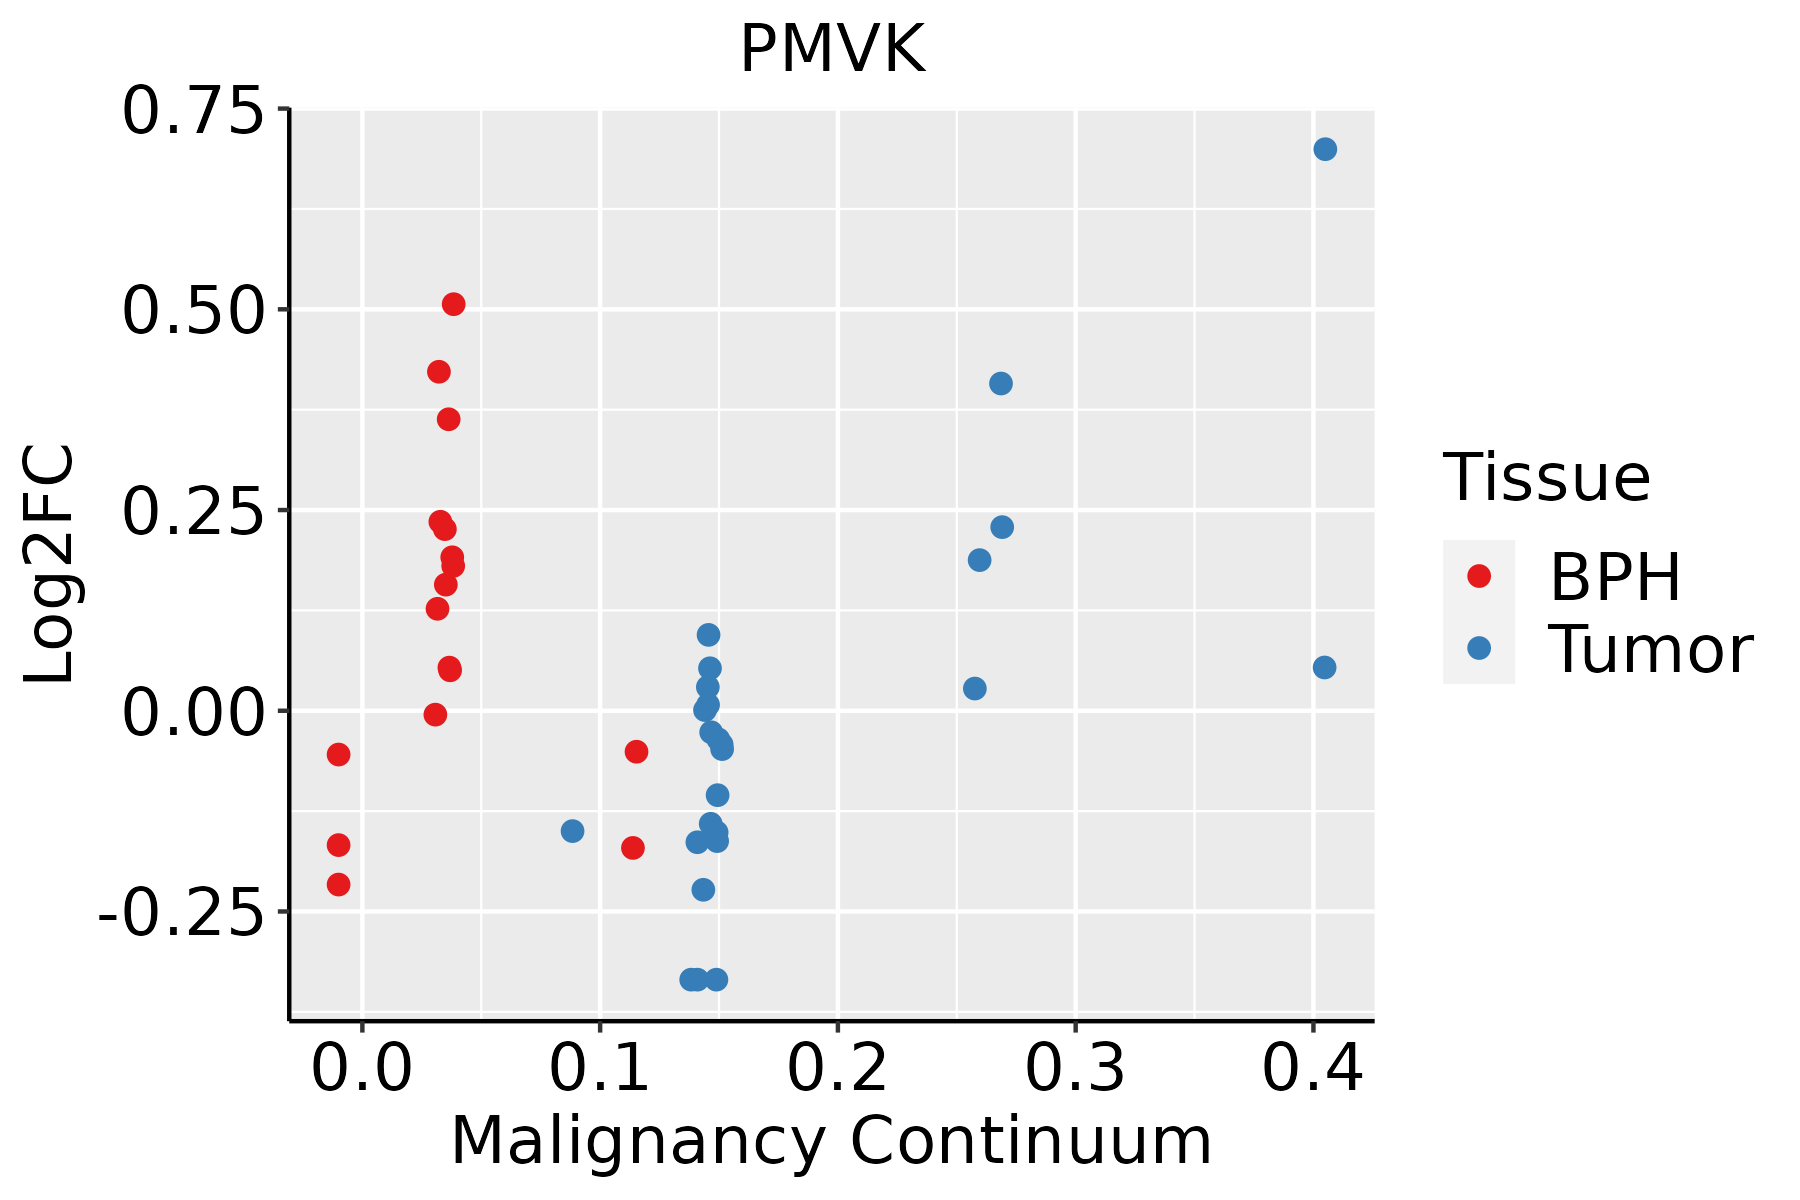 | BPH: Benign Prostatic Hyperplasia |
| Skin |  | AK: Actinic keratosis |
| cSCC: Cutaneous squamous cell carcinoma | ||
| SCCIS:squamous cell carcinoma in situ | ||
| Thyroid |  | ATC: Anaplastic thyroid cancer |
| HT: Hashimoto's thyroiditis | ||
| PTC: Papillary thyroid cancer |
| ∗log2FC in expression of this searched gene in stem-like cells from each diseased tissue sample relative to stem-like cells in normal samples in each tissue plotted against the malignancy continuum. Samples are colored based on if they are from different disease stage. |
Top |
Malignant transformation related pathway analysis |
| Find out the enriched GO biological processes and KEGG pathways involved in transition from healthy to precancer to cancer |
| Tissue | Disease Stage | Enriched GO biological Processes |
| Colorectum | AD |  |
| Colorectum | SER |  |
| Colorectum | MSS |  |
| Colorectum | MSI-H |  |
| Colorectum | FAP |  |
| ∗Top 15 enriched GO BP terms are showed in the bar plot of each disease state in each tissue. Each row represents a significant GO biological process which is colored according to the -log10(p.adjust). |
| Page: 1 2 3 4 5 6 7 8 9 |
| GO ID | Tissue | Disease Stage | Description | Gene Ratio | Bg Ratio | pvalue | p.adjust | Count |
| GO:000915014 | Breast | IDC | purine ribonucleotide metabolic process | 55/1434 | 368/18723 | 1.30e-06 | 5.72e-05 | 55 |
| GO:001969314 | Breast | IDC | ribose phosphate metabolic process | 58/1434 | 396/18723 | 1.31e-06 | 5.73e-05 | 58 |
| GO:000675313 | Breast | IDC | nucleoside phosphate metabolic process | 68/1434 | 497/18723 | 2.01e-06 | 8.23e-05 | 68 |
| GO:000911713 | Breast | IDC | nucleotide metabolic process | 67/1434 | 489/18723 | 2.28e-06 | 9.05e-05 | 67 |
| GO:000925914 | Breast | IDC | ribonucleotide metabolic process | 56/1434 | 385/18723 | 2.47e-06 | 9.63e-05 | 56 |
| GO:000616314 | Breast | IDC | purine nucleotide metabolic process | 56/1434 | 396/18723 | 5.90e-06 | 1.90e-04 | 56 |
| GO:007252114 | Breast | IDC | purine-containing compound metabolic process | 57/1434 | 416/18723 | 1.28e-05 | 3.31e-04 | 57 |
| GO:009730514 | Breast | IDC | response to alcohol | 36/1434 | 253/18723 | 2.29e-04 | 3.64e-03 | 36 |
| GO:00066944 | Breast | IDC | steroid biosynthetic process | 25/1434 | 173/18723 | 1.56e-03 | 1.56e-02 | 25 |
| GO:001969324 | Breast | DCIS | ribose phosphate metabolic process | 58/1390 | 396/18723 | 4.80e-07 | 2.11e-05 | 58 |
| GO:000915024 | Breast | DCIS | purine ribonucleotide metabolic process | 55/1390 | 368/18723 | 4.92e-07 | 2.14e-05 | 55 |
| GO:000925924 | Breast | DCIS | ribonucleotide metabolic process | 56/1390 | 385/18723 | 9.44e-07 | 3.79e-05 | 56 |
| GO:000616324 | Breast | DCIS | purine nucleotide metabolic process | 56/1390 | 396/18723 | 2.31e-06 | 8.29e-05 | 56 |
| GO:000911723 | Breast | DCIS | nucleotide metabolic process | 65/1390 | 489/18723 | 3.19e-06 | 1.03e-04 | 65 |
| GO:007252124 | Breast | DCIS | purine-containing compound metabolic process | 57/1390 | 416/18723 | 5.07e-06 | 1.48e-04 | 57 |
| GO:000675323 | Breast | DCIS | nucleoside phosphate metabolic process | 65/1390 | 497/18723 | 5.51e-06 | 1.59e-04 | 65 |
| GO:009730524 | Breast | DCIS | response to alcohol | 34/1390 | 253/18723 | 5.54e-04 | 7.09e-03 | 34 |
| GO:000669411 | Breast | DCIS | steroid biosynthetic process | 23/1390 | 173/18723 | 4.63e-03 | 3.52e-02 | 23 |
| GO:00086544 | Esophagus | ESCC | phospholipid biosynthetic process | 162/8552 | 253/18723 | 2.59e-09 | 5.73e-08 | 162 |
| GO:0006753110 | Esophagus | ESCC | nucleoside phosphate metabolic process | 288/8552 | 497/18723 | 1.80e-08 | 3.50e-07 | 288 |
| Page: 1 2 3 4 5 6 7 8 9 10 |
| Pathway ID | Tissue | Disease Stage | Description | Gene Ratio | Bg Ratio | pvalue | p.adjust | qvalue | Count |
| hsa009005 | Esophagus | ESCC | Terpenoid backbone biosynthesis | 20/4205 | 23/8465 | 2.14e-04 | 7.87e-04 | 4.03e-04 | 20 |
| hsa041467 | Esophagus | ESCC | Peroxisome | 55/4205 | 82/8465 | 1.04e-03 | 3.27e-03 | 1.68e-03 | 55 |
| hsa0090012 | Esophagus | ESCC | Terpenoid backbone biosynthesis | 20/4205 | 23/8465 | 2.14e-04 | 7.87e-04 | 4.03e-04 | 20 |
| hsa0414612 | Esophagus | ESCC | Peroxisome | 55/4205 | 82/8465 | 1.04e-03 | 3.27e-03 | 1.68e-03 | 55 |
| hsa041462 | Liver | Cirrhotic | Peroxisome | 36/2530 | 82/8465 | 4.79e-03 | 1.74e-02 | 1.07e-02 | 36 |
| hsa041463 | Liver | Cirrhotic | Peroxisome | 36/2530 | 82/8465 | 4.79e-03 | 1.74e-02 | 1.07e-02 | 36 |
| hsa041464 | Liver | HCC | Peroxisome | 58/4020 | 82/8465 | 1.57e-05 | 1.05e-04 | 5.85e-05 | 58 |
| hsa00900 | Liver | HCC | Terpenoid backbone biosynthesis | 17/4020 | 23/8465 | 9.26e-03 | 2.46e-02 | 1.37e-02 | 17 |
| hsa041465 | Liver | HCC | Peroxisome | 58/4020 | 82/8465 | 1.57e-05 | 1.05e-04 | 5.85e-05 | 58 |
| hsa009001 | Liver | HCC | Terpenoid backbone biosynthesis | 17/4020 | 23/8465 | 9.26e-03 | 2.46e-02 | 1.37e-02 | 17 |
| hsa009004 | Oral cavity | OSCC | Terpenoid backbone biosynthesis | 19/3704 | 23/8465 | 1.55e-04 | 5.34e-04 | 2.72e-04 | 19 |
| hsa041466 | Oral cavity | OSCC | Peroxisome | 47/3704 | 82/8465 | 9.01e-03 | 2.01e-02 | 1.03e-02 | 47 |
| hsa0090011 | Oral cavity | OSCC | Terpenoid backbone biosynthesis | 19/3704 | 23/8465 | 1.55e-04 | 5.34e-04 | 2.72e-04 | 19 |
| hsa0414611 | Oral cavity | OSCC | Peroxisome | 47/3704 | 82/8465 | 9.01e-03 | 2.01e-02 | 1.03e-02 | 47 |
| hsa009002 | Oral cavity | LP | Terpenoid backbone biosynthesis | 12/2418 | 23/8465 | 1.43e-02 | 4.59e-02 | 2.96e-02 | 12 |
| hsa0414621 | Oral cavity | LP | Peroxisome | 33/2418 | 82/8465 | 1.48e-02 | 4.69e-02 | 3.03e-02 | 33 |
| hsa009003 | Oral cavity | LP | Terpenoid backbone biosynthesis | 12/2418 | 23/8465 | 1.43e-02 | 4.59e-02 | 2.96e-02 | 12 |
| hsa0414631 | Oral cavity | LP | Peroxisome | 33/2418 | 82/8465 | 1.48e-02 | 4.69e-02 | 3.03e-02 | 33 |
| Page: 1 |
Top |
Cell-cell communication analysis |
| Identification of potential cell-cell interactions between two cell types and their ligand-receptor pairs for different disease states |
| Ligand | Receptor | LRpair | Pathway | Tissue | Disease Stage |
| Page: 1 |
Top |
Single-cell gene regulatory network inference analysis |
| Find out the significant the regulons (TFs) and the target genes of each regulon across cell types for different disease states |
| TF | Cell Type | Tissue | Disease Stage | Target Gene | RSS | Regulon Activity |
| ∗The dot plots of a searched regulon are shown for all cell subpopulations in each disease state of each tissue based on the regulon specific score inferred using pySCENIC and by calculating the average expression. |
| Page: 1 |
Top |
Somatic mutation of malignant transformation related genes |
| Annotation of somatic variants for genes involved in malignant transformation |
| Hugo Symbol | Variant Class | Variant Classification | dbSNP RS | HGVSc | HGVSp | HGVSp Short | SWISSPROT | BIOTYPE | SIFT | PolyPhen | Tumor Sample Barcode | Tissue | Histology | Sex | Age | Stage | Therapy Types | Drugs | Outcome |
| PMVK | SNV | Missense_Mutation | c.547N>T | p.Asn183Tyr | p.N183Y | Q15126 | protein_coding | deleterious(0.03) | benign(0.021) | TCGA-GM-A2DC-01 | Breast | breast invasive carcinoma | Female | <65 | I/II | Chemotherapy | xeloda | CR | |
| PMVK | insertion | Nonsense_Mutation | novel | c.277_278insACGAGTCATAAGGTTTGTAAAGAAGTCGATTAGGGGCTGGGGT | p.Arg93AsnfsTer4 | p.R93Nfs*4 | Q15126 | protein_coding | TCGA-BH-A0AY-01 | Breast | breast invasive carcinoma | Female | <65 | I/II | Chemotherapy | SD | |||
| PMVK | SNV | Missense_Mutation | c.158N>T | p.Gln53Leu | p.Q53L | Q15126 | protein_coding | tolerated(0.07) | benign(0.001) | TCGA-IR-A3LA-01 | Cervix | cervical & endocervical cancer | Female | <65 | I/II | Chemotherapy | cisplatin | CR | |
| PMVK | SNV | Missense_Mutation | rs775004187 | c.293G>A | p.Gly98Asp | p.G98D | Q15126 | protein_coding | tolerated(0.13) | benign(0.107) | TCGA-AA-3864-01 | Colorectum | colon adenocarcinoma | Male | >=65 | I/II | Unknown | Unknown | SD |
| PMVK | SNV | Missense_Mutation | rs779946272 | c.398N>T | p.Ala133Val | p.A133V | Q15126 | protein_coding | deleterious(0.05) | benign(0.211) | TCGA-A5-A0G2-01 | Endometrium | uterine corpus endometrioid carcinoma | Female | <65 | III/IV | Unknown | Unknown | SD |
| PMVK | SNV | Missense_Mutation | novel | c.190N>T | p.Asp64Tyr | p.D64Y | Q15126 | protein_coding | deleterious(0.01) | probably_damaging(0.986) | TCGA-A5-A0G2-01 | Endometrium | uterine corpus endometrioid carcinoma | Female | <65 | III/IV | Unknown | Unknown | SD |
| PMVK | SNV | Missense_Mutation | rs149231731 | c.383C>T | p.Thr128Met | p.T128M | Q15126 | protein_coding | deleterious(0.02) | probably_damaging(0.979) | TCGA-A5-A1OF-01 | Endometrium | uterine corpus endometrioid carcinoma | Female | <65 | I/II | Unknown | Unknown | SD |
| PMVK | SNV | Missense_Mutation | novel | c.197G>T | p.Ser66Ile | p.S66I | Q15126 | protein_coding | deleterious(0) | probably_damaging(0.993) | TCGA-AJ-A3EK-01 | Endometrium | uterine corpus endometrioid carcinoma | Female | <65 | I/II | Chemotherapy | carboplatin | CR |
| PMVK | SNV | Missense_Mutation | rs149231731 | c.383C>T | p.Thr128Met | p.T128M | Q15126 | protein_coding | deleterious(0.02) | probably_damaging(0.979) | TCGA-AJ-A3NE-01 | Endometrium | uterine corpus endometrioid carcinoma | Female | <65 | I/II | Unknown | Unknown | SD |
| PMVK | SNV | Missense_Mutation | c.525G>T | p.Gln175His | p.Q175H | Q15126 | protein_coding | tolerated(0.14) | benign(0) | TCGA-B5-A11E-01 | Endometrium | uterine corpus endometrioid carcinoma | Female | <65 | I/II | Unknown | Unknown | SD |
| Page: 1 2 |
Top |
Related drugs of malignant transformation related genes |
| Identification of chemicals and drugs interact with genes involved in malignant transfromation |
| (DGIdb 4.0) |
| Entrez ID | Symbol | Category | Interaction Types | Drug Claim Name | Drug Name | PMIDs |
| 10654 | PMVK | ENZYME, KINASE | inhibitor | 135651554 |
| Page: 1 |

Copyright 2023-Present -The University of Texas Health Science Center at Houston |