
|
|||||
|
 | |
| |
| |
| |
| |
| |
|
Gene: PMS2 |
Gene summary for PMS2 |
| Gene information | Species | Human | Gene symbol | PMS2 | Gene ID | 5395 |
| Gene name | PMS1 homolog 2, mismatch repair system component | |
| Gene Alias | HNPCC4 | |
| Cytomap | 7p22.1 | |
| Gene Type | protein-coding | GO ID | GO:0002200 | UniProtAcc | B4DGM0 |
Top |
Malignant transformation analysis |
| Identification of the aberrant gene expression in precancerous and cancerous lesions by comparing the gene expression of stem-like cells in diseased tissues with normal stem cells |
| Entrez ID | Symbol | Replicates | Species | Organ | Tissue | Adj P-value | Log2FC | Malignancy |
| 5395 | PMS2 | LZE4T | Human | Esophagus | ESCC | 3.01e-07 | 2.65e-01 | 0.0811 |
| 5395 | PMS2 | LZE5T | Human | Esophagus | ESCC | 1.72e-03 | 2.93e-01 | 0.0514 |
| 5395 | PMS2 | LZE7T | Human | Esophagus | ESCC | 4.15e-07 | 4.15e-01 | 0.0667 |
| 5395 | PMS2 | LZE24T | Human | Esophagus | ESCC | 3.49e-08 | 2.50e-01 | 0.0596 |
| 5395 | PMS2 | P1T-E | Human | Esophagus | ESCC | 2.02e-03 | 1.88e-01 | 0.0875 |
| 5395 | PMS2 | P2T-E | Human | Esophagus | ESCC | 8.70e-14 | 2.78e-01 | 0.1177 |
| 5395 | PMS2 | P4T-E | Human | Esophagus | ESCC | 1.04e-08 | 2.70e-01 | 0.1323 |
| 5395 | PMS2 | P5T-E | Human | Esophagus | ESCC | 8.49e-07 | 1.47e-01 | 0.1327 |
| 5395 | PMS2 | P8T-E | Human | Esophagus | ESCC | 1.89e-06 | 1.49e-01 | 0.0889 |
| 5395 | PMS2 | P9T-E | Human | Esophagus | ESCC | 1.42e-09 | 2.13e-01 | 0.1131 |
| 5395 | PMS2 | P10T-E | Human | Esophagus | ESCC | 9.99e-10 | 2.20e-01 | 0.116 |
| 5395 | PMS2 | P11T-E | Human | Esophagus | ESCC | 8.00e-06 | 2.79e-01 | 0.1426 |
| 5395 | PMS2 | P12T-E | Human | Esophagus | ESCC | 5.28e-20 | 3.83e-01 | 0.1122 |
| 5395 | PMS2 | P15T-E | Human | Esophagus | ESCC | 2.12e-12 | 2.90e-01 | 0.1149 |
| 5395 | PMS2 | P16T-E | Human | Esophagus | ESCC | 4.99e-18 | 3.47e-01 | 0.1153 |
| 5395 | PMS2 | P17T-E | Human | Esophagus | ESCC | 2.18e-04 | 2.99e-01 | 0.1278 |
| 5395 | PMS2 | P20T-E | Human | Esophagus | ESCC | 1.79e-23 | 5.37e-01 | 0.1124 |
| 5395 | PMS2 | P21T-E | Human | Esophagus | ESCC | 1.02e-10 | 1.70e-01 | 0.1617 |
| 5395 | PMS2 | P22T-E | Human | Esophagus | ESCC | 8.52e-10 | 2.22e-01 | 0.1236 |
| 5395 | PMS2 | P23T-E | Human | Esophagus | ESCC | 5.66e-10 | 3.15e-01 | 0.108 |
| Page: 1 2 3 4 5 |
| Tissue | Expression Dynamics | Abbreviation |
| Esophagus | 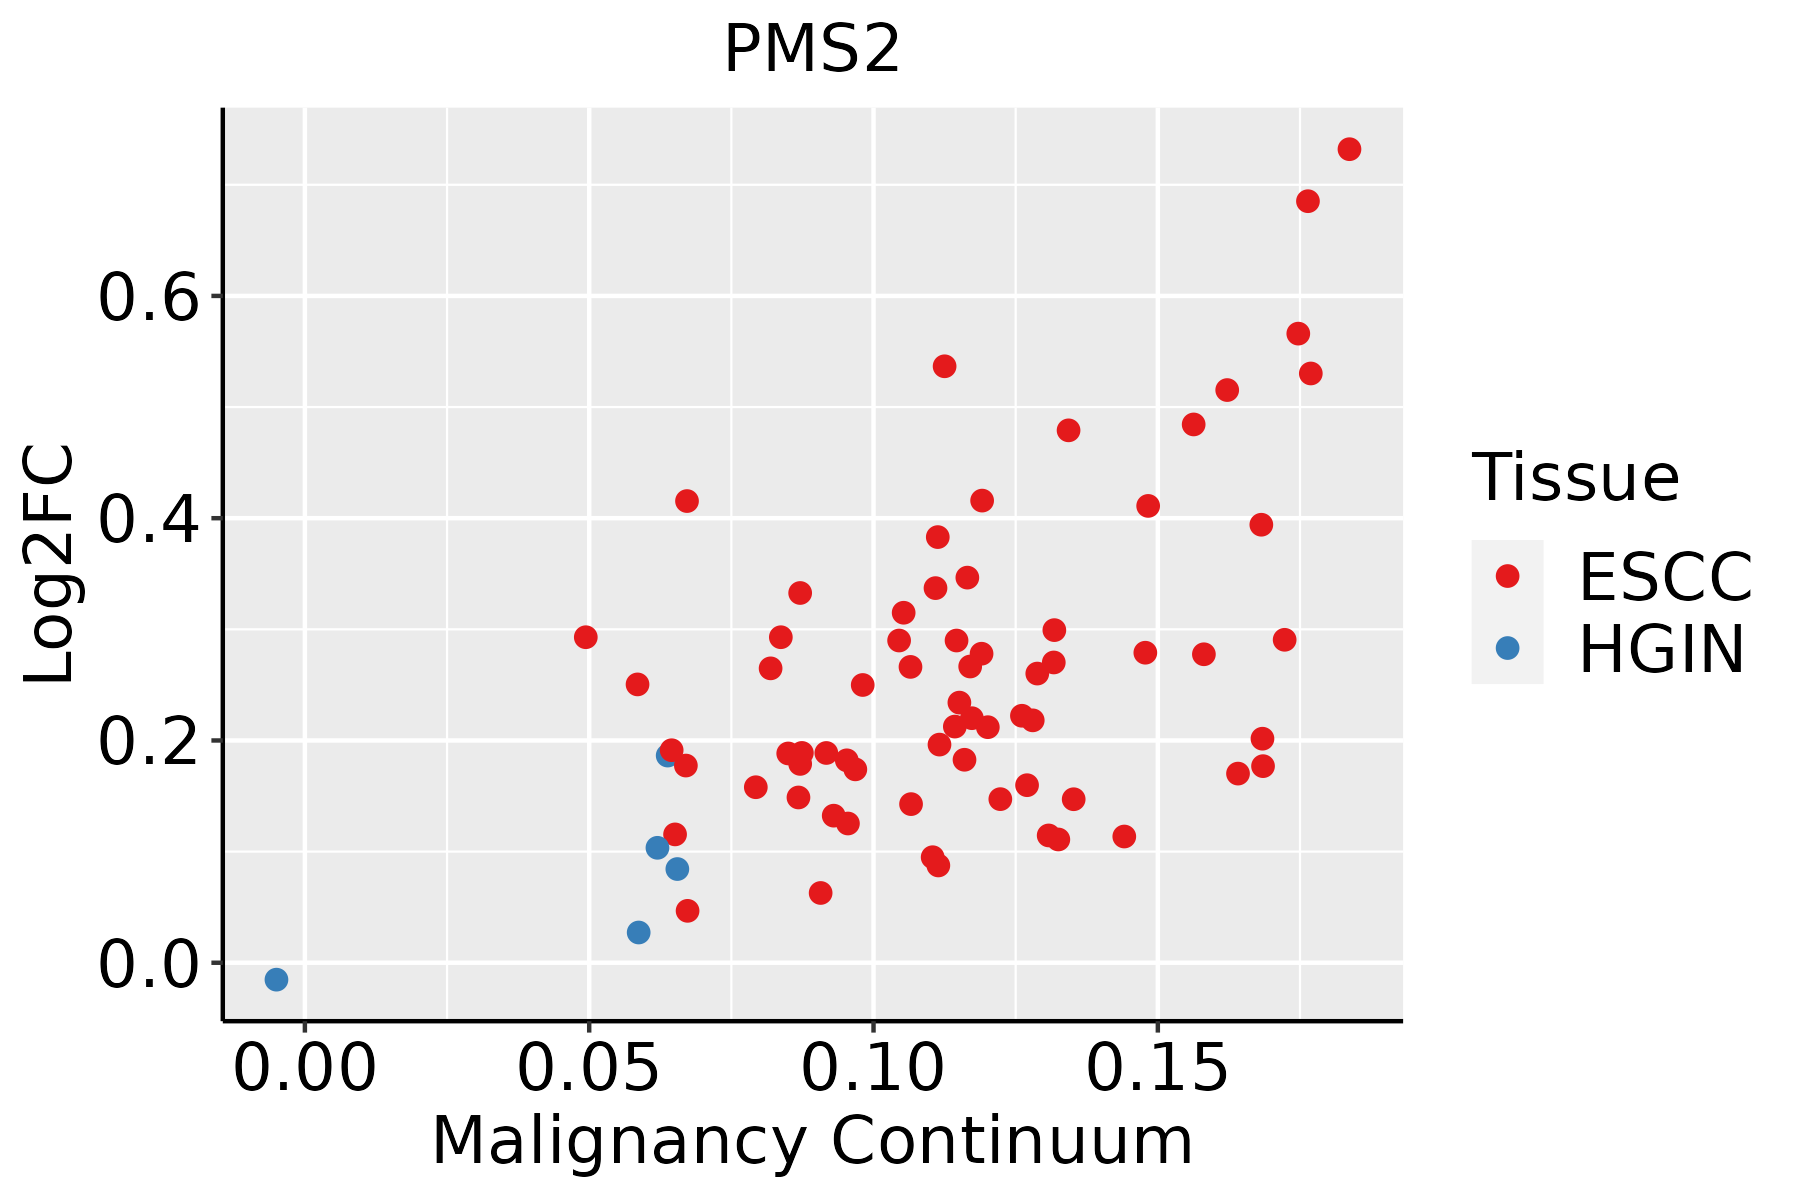 | ESCC: Esophageal squamous cell carcinoma |
| HGIN: High-grade intraepithelial neoplasias | ||
| LGIN: Low-grade intraepithelial neoplasias | ||
| Liver |  | HCC: Hepatocellular carcinoma |
| NAFLD: Non-alcoholic fatty liver disease | ||
| Oral Cavity | 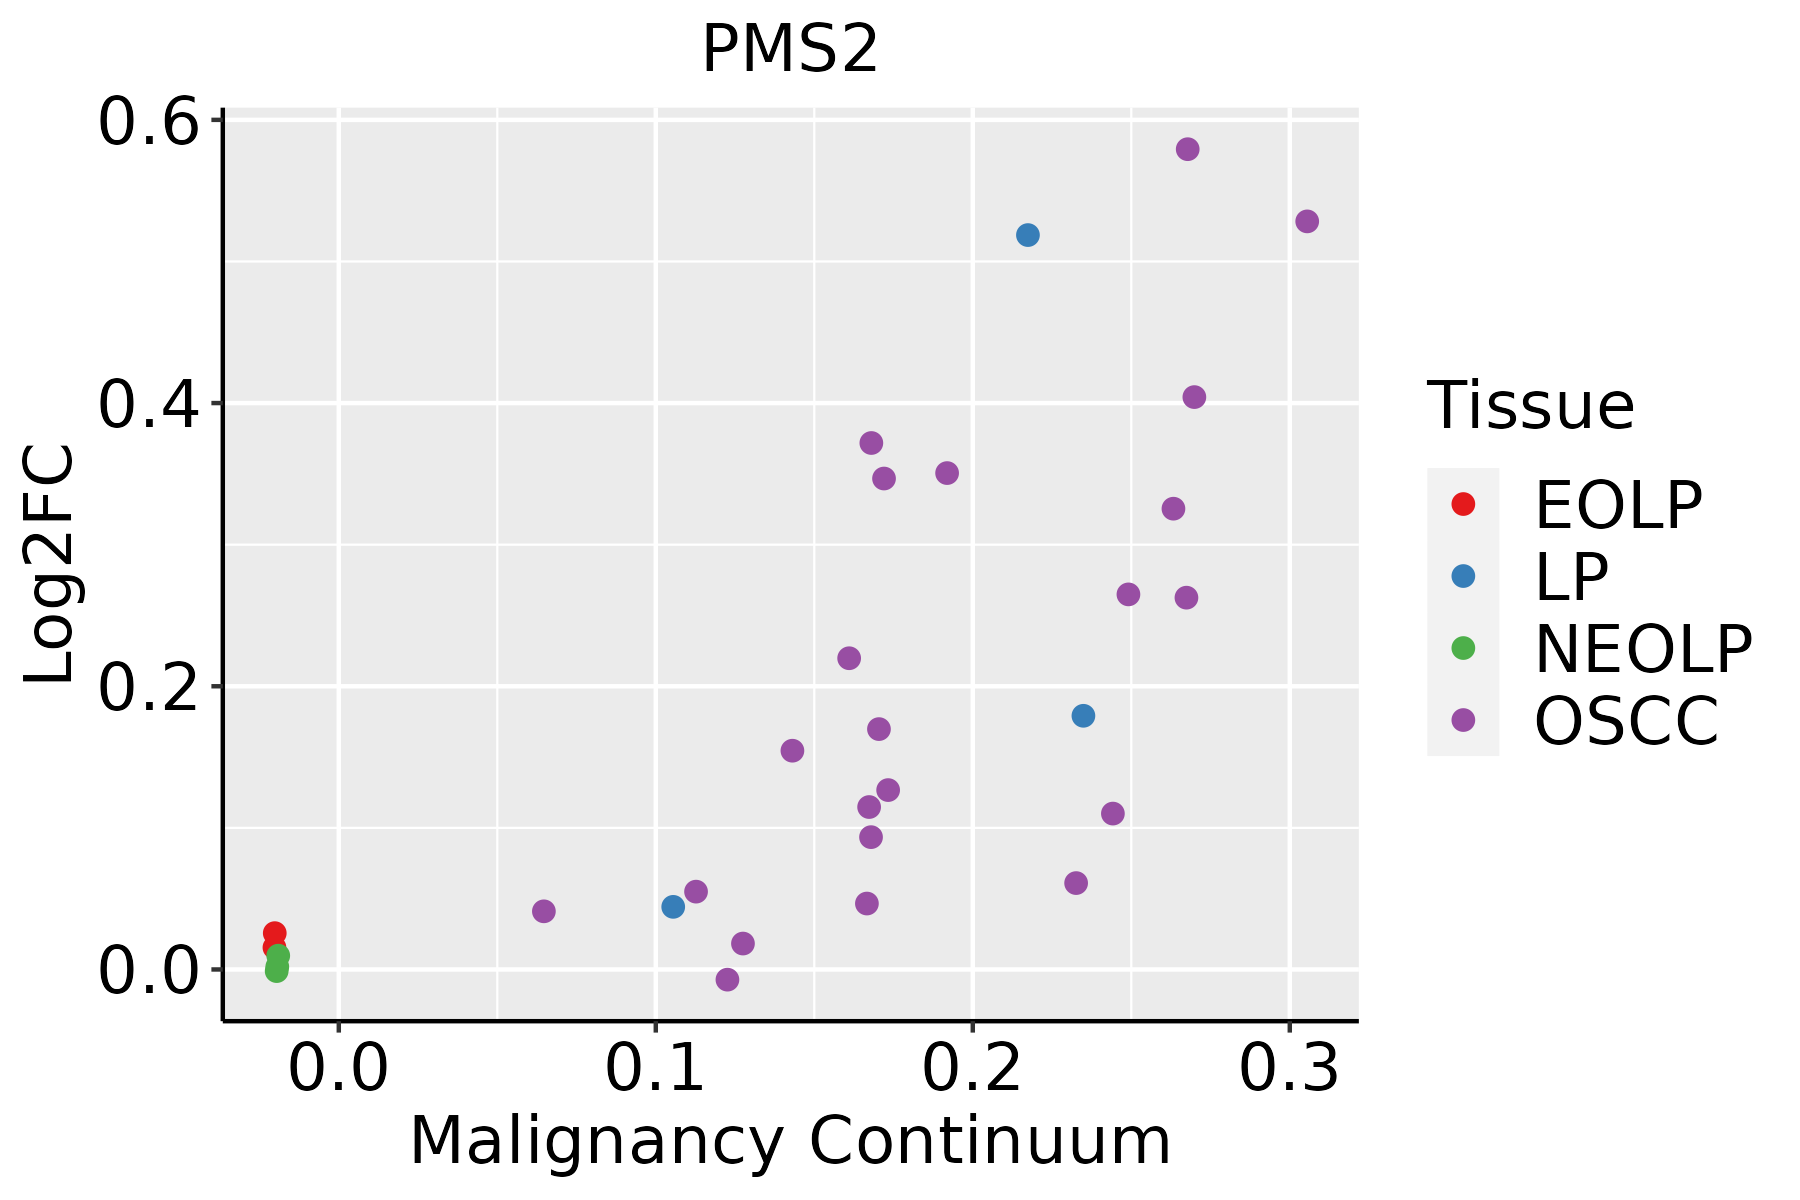 | EOLP: Erosive Oral lichen planus |
| LP: leukoplakia | ||
| NEOLP: Non-erosive oral lichen planus | ||
| OSCC: Oral squamous cell carcinoma | ||
| Thyroid |  | ATC: Anaplastic thyroid cancer |
| HT: Hashimoto's thyroiditis | ||
| PTC: Papillary thyroid cancer |
| ∗log2FC in expression of this searched gene in stem-like cells from each diseased tissue sample relative to stem-like cells in normal samples in each tissue plotted against the malignancy continuum. Samples are colored based on if they are from different disease stage. |
Top |
Malignant transformation related pathway analysis |
| Find out the enriched GO biological processes and KEGG pathways involved in transition from healthy to precancer to cancer |
| Tissue | Disease Stage | Enriched GO biological Processes |
| Colorectum | AD |  |
| Colorectum | SER |  |
| Colorectum | MSS |  |
| Colorectum | MSI-H |  |
| Colorectum | FAP |  |
| ∗Top 15 enriched GO BP terms are showed in the bar plot of each disease state in each tissue. Each row represents a significant GO biological process which is colored according to the -log10(p.adjust). |
| Page: 1 2 3 4 5 6 7 8 9 |
| GO ID | Tissue | Disease Stage | Description | Gene Ratio | Bg Ratio | pvalue | p.adjust | Count |
| GO:00903053 | Esophagus | ESCC | nucleic acid phosphodiester bond hydrolysis | 163/8552 | 261/18723 | 3.07e-08 | 5.73e-07 | 163 |
| GO:000941020 | Esophagus | ESCC | response to xenobiotic stimulus | 253/8552 | 462/18723 | 4.55e-05 | 3.58e-04 | 253 |
| GO:00022003 | Esophagus | ESCC | somatic diversification of immune receptors | 49/8552 | 77/18723 | 1.12e-03 | 5.60e-03 | 49 |
| GO:00164452 | Esophagus | ESCC | somatic diversification of immunoglobulins | 43/8552 | 67/18723 | 1.73e-03 | 7.97e-03 | 43 |
| GO:0090305 | Liver | HCC | nucleic acid phosphodiester bond hydrolysis | 152/7958 | 261/18723 | 1.90e-07 | 3.46e-06 | 152 |
| GO:000941022 | Liver | HCC | response to xenobiotic stimulus | 248/7958 | 462/18723 | 6.47e-07 | 1.02e-05 | 248 |
| GO:0002200 | Liver | HCC | somatic diversification of immune receptors | 44/7958 | 77/18723 | 6.70e-03 | 2.72e-02 | 44 |
| GO:0016445 | Liver | HCC | somatic diversification of immunoglobulins | 38/7958 | 67/18723 | 1.32e-02 | 4.73e-02 | 38 |
| GO:00903052 | Oral cavity | OSCC | nucleic acid phosphodiester bond hydrolysis | 142/7305 | 261/18723 | 2.90e-07 | 4.43e-06 | 142 |
| GO:000941018 | Oral cavity | OSCC | response to xenobiotic stimulus | 222/7305 | 462/18723 | 4.00e-05 | 3.48e-04 | 222 |
| GO:00022002 | Oral cavity | OSCC | somatic diversification of immune receptors | 40/7305 | 77/18723 | 1.42e-02 | 4.69e-02 | 40 |
| GO:00903051 | Oral cavity | LP | nucleic acid phosphodiester bond hydrolysis | 92/4623 | 261/18723 | 8.07e-05 | 1.04e-03 | 92 |
| GO:000941019 | Oral cavity | LP | response to xenobiotic stimulus | 141/4623 | 462/18723 | 2.33e-03 | 1.68e-02 | 141 |
| GO:00903055 | Thyroid | PTC | nucleic acid phosphodiester bond hydrolysis | 105/5968 | 261/18723 | 2.53e-03 | 1.31e-02 | 105 |
| GO:00022004 | Thyroid | PTC | somatic diversification of immune receptors | 35/5968 | 77/18723 | 8.56e-03 | 3.59e-02 | 35 |
| GO:00164453 | Thyroid | PTC | somatic diversification of immunoglobulins | 31/5968 | 67/18723 | 9.51e-03 | 3.91e-02 | 31 |
| GO:0009410111 | Thyroid | PTC | response to xenobiotic stimulus | 171/5968 | 462/18723 | 1.00e-02 | 4.07e-02 | 171 |
| GO:000941027 | Thyroid | ATC | response to xenobiotic stimulus | 184/6293 | 462/18723 | 2.70e-03 | 1.23e-02 | 184 |
| GO:009030511 | Thyroid | ATC | nucleic acid phosphodiester bond hydrolysis | 107/6293 | 261/18723 | 7.21e-03 | 2.84e-02 | 107 |
| Page: 1 |
| Pathway ID | Tissue | Disease Stage | Description | Gene Ratio | Bg Ratio | pvalue | p.adjust | qvalue | Count |
| hsa034304 | Esophagus | ESCC | Mismatch repair | 21/4205 | 23/8465 | 2.85e-05 | 1.35e-04 | 6.90e-05 | 21 |
| hsa0343011 | Esophagus | ESCC | Mismatch repair | 21/4205 | 23/8465 | 2.85e-05 | 1.35e-04 | 6.90e-05 | 21 |
| hsa03430 | Oral cavity | OSCC | Mismatch repair | 19/3704 | 23/8465 | 1.55e-04 | 5.34e-04 | 2.72e-04 | 19 |
| hsa034301 | Oral cavity | OSCC | Mismatch repair | 19/3704 | 23/8465 | 1.55e-04 | 5.34e-04 | 2.72e-04 | 19 |
| hsa034302 | Oral cavity | LP | Mismatch repair | 12/2418 | 23/8465 | 1.43e-02 | 4.59e-02 | 2.96e-02 | 12 |
| hsa034303 | Oral cavity | LP | Mismatch repair | 12/2418 | 23/8465 | 1.43e-02 | 4.59e-02 | 2.96e-02 | 12 |
| Page: 1 |
Top |
Cell-cell communication analysis |
| Identification of potential cell-cell interactions between two cell types and their ligand-receptor pairs for different disease states |
| Ligand | Receptor | LRpair | Pathway | Tissue | Disease Stage |
| Page: 1 |
Top |
Single-cell gene regulatory network inference analysis |
| Find out the significant the regulons (TFs) and the target genes of each regulon across cell types for different disease states |
| TF | Cell Type | Tissue | Disease Stage | Target Gene | RSS | Regulon Activity |
| ∗The dot plots of a searched regulon are shown for all cell subpopulations in each disease state of each tissue based on the regulon specific score inferred using pySCENIC and by calculating the average expression. |
| Page: 1 |
Top |
Somatic mutation of malignant transformation related genes |
| Annotation of somatic variants for genes involved in malignant transformation |
| Hugo Symbol | Variant Class | Variant Classification | dbSNP RS | HGVSc | HGVSp | HGVSp Short | SWISSPROT | BIOTYPE | SIFT | PolyPhen | Tumor Sample Barcode | Tissue | Histology | Sex | Age | Stage | Therapy Types | Drugs | Outcome |
| PMS2 | SNV | Missense_Mutation | rs587780051 | c.2287G>A | p.Glu763Lys | p.E763K | P54278 | protein_coding | tolerated(0.34) | benign(0.005) | TCGA-3C-AALI-01 | Breast | breast invasive carcinoma | Female | <65 | I/II | Unspecific | Poly E | Complete Response |
| PMS2 | SNV | Missense_Mutation | novel | c.320N>T | p.Arg107Leu | p.R107L | P54278 | protein_coding | deleterious(0) | probably_damaging(0.995) | TCGA-A7-A0DB-01 | Breast | breast invasive carcinoma | Female | <65 | I/II | Hormone Therapy | arimidex | SD |
| PMS2 | SNV | Missense_Mutation | novel | c.2451N>A | p.Met817Ile | p.M817I | P54278 | protein_coding | deleterious(0) | probably_damaging(0.992) | TCGA-AC-A23H-01 | Breast | breast invasive carcinoma | Female | >=65 | I/II | Unknown | Unknown | PD |
| PMS2 | SNV | Missense_Mutation | rs876660330 | c.566N>C | p.His189Pro | p.H189P | P54278 | protein_coding | deleterious(0.03) | benign(0.225) | TCGA-AO-A03T-01 | Breast | breast invasive carcinoma | Female | <65 | I/II | Chemotherapy | cyclophosphamide | SD |
| PMS2 | SNV | Missense_Mutation | c.2269N>C | p.Glu757Gln | p.E757Q | P54278 | protein_coding | deleterious(0.01) | possibly_damaging(0.754) | TCGA-D8-A1JA-01 | Breast | breast invasive carcinoma | Female | <65 | III/IV | Chemotherapy | adriamycin | PD | |
| PMS2 | SNV | Missense_Mutation | c.1433N>C | p.Ser478Thr | p.S478T | P54278 | protein_coding | tolerated(0.6) | benign(0) | TCGA-D8-A1XQ-01 | Breast | breast invasive carcinoma | Female | >=65 | I/II | Unknown | Unknown | SD | |
| PMS2 | insertion | Frame_Shift_Ins | novel | c.1283_1284insGG | p.His428GlnfsTer21 | p.H428Qfs*21 | P54278 | protein_coding | TCGA-A2-A0D2-01 | Breast | breast invasive carcinoma | Female | <65 | I/II | Chemotherapy | adriamycin | SD | ||
| PMS2 | SNV | Missense_Mutation | rs376042544 | c.1279C>T | p.Arg427Cys | p.R427C | P54278 | protein_coding | deleterious(0.01) | benign(0.328) | TCGA-2W-A8YY-01 | Cervix | cervical & endocervical cancer | Female | <65 | I/II | Chemotherapy | cisplatin | CR |
| PMS2 | SNV | Missense_Mutation | novel | c.442C>T | p.Pro148Ser | p.P148S | P54278 | protein_coding | tolerated(0.06) | possibly_damaging(0.617) | TCGA-2W-A8YY-01 | Cervix | cervical & endocervical cancer | Female | <65 | I/II | Chemotherapy | cisplatin | CR |
| PMS2 | SNV | Missense_Mutation | c.1321N>A | p.Glu441Lys | p.E441K | P54278 | protein_coding | tolerated(0.85) | benign(0) | TCGA-MY-A5BD-01 | Cervix | cervical & endocervical cancer | Female | <65 | I/II | Chemotherapy | cisplatin | CR |
| Page: 1 2 3 4 5 6 7 8 9 |
Top |
Related drugs of malignant transformation related genes |
| Identification of chemicals and drugs interact with genes involved in malignant transfromation |
| (DGIdb 4.0) |
| Entrez ID | Symbol | Category | Interaction Types | Drug Claim Name | Drug Name | PMIDs |
| 5395 | PMS2 | CLINICALLY ACTIONABLE, DRUGGABLE GENOME | NIVOLUMAB | NIVOLUMAB | 27001570 |
| Page: 1 |

Copyright 2023-Present -The University of Texas Health Science Center at Houston |