
|
|||||
|
 | |
| |
| |
| |
| |
| |
|
Gene: PMS1 |
Gene summary for PMS1 |
| Gene information | Species | Human | Gene symbol | PMS1 | Gene ID | 5378 |
| Gene name | PMS1 homolog 1, mismatch repair system component | |
| Gene Alias | HNPCC3 | |
| Cytomap | 2q32.2 | |
| Gene Type | protein-coding | GO ID | GO:0006139 | UniProtAcc | P54277 |
Top |
Malignant transformation analysis |
| Identification of the aberrant gene expression in precancerous and cancerous lesions by comparing the gene expression of stem-like cells in diseased tissues with normal stem cells |
| Entrez ID | Symbol | Replicates | Species | Organ | Tissue | Adj P-value | Log2FC | Malignancy |
| 5378 | PMS1 | LZE4T | Human | Esophagus | ESCC | 9.92e-07 | 2.46e-01 | 0.0811 |
| 5378 | PMS1 | LZE7T | Human | Esophagus | ESCC | 7.19e-09 | 4.37e-01 | 0.0667 |
| 5378 | PMS1 | LZE24T | Human | Esophagus | ESCC | 1.45e-04 | 1.74e-01 | 0.0596 |
| 5378 | PMS1 | LZE21T | Human | Esophagus | ESCC | 9.57e-05 | 2.75e-01 | 0.0655 |
| 5378 | PMS1 | P1T-E | Human | Esophagus | ESCC | 1.27e-03 | 1.79e-01 | 0.0875 |
| 5378 | PMS1 | P2T-E | Human | Esophagus | ESCC | 4.96e-18 | 3.39e-01 | 0.1177 |
| 5378 | PMS1 | P4T-E | Human | Esophagus | ESCC | 3.38e-26 | 5.66e-01 | 0.1323 |
| 5378 | PMS1 | P5T-E | Human | Esophagus | ESCC | 3.96e-14 | 3.18e-01 | 0.1327 |
| 5378 | PMS1 | P8T-E | Human | Esophagus | ESCC | 3.68e-15 | 2.75e-01 | 0.0889 |
| 5378 | PMS1 | P9T-E | Human | Esophagus | ESCC | 3.25e-04 | 1.32e-01 | 0.1131 |
| 5378 | PMS1 | P10T-E | Human | Esophagus | ESCC | 1.06e-14 | 2.99e-01 | 0.116 |
| 5378 | PMS1 | P11T-E | Human | Esophagus | ESCC | 6.68e-08 | 2.27e-01 | 0.1426 |
| 5378 | PMS1 | P12T-E | Human | Esophagus | ESCC | 3.97e-30 | 4.48e-01 | 0.1122 |
| 5378 | PMS1 | P15T-E | Human | Esophagus | ESCC | 1.51e-10 | 2.49e-01 | 0.1149 |
| 5378 | PMS1 | P16T-E | Human | Esophagus | ESCC | 9.33e-31 | 4.63e-01 | 0.1153 |
| 5378 | PMS1 | P17T-E | Human | Esophagus | ESCC | 2.36e-02 | 1.66e-01 | 0.1278 |
| 5378 | PMS1 | P19T-E | Human | Esophagus | ESCC | 6.84e-04 | 3.51e-01 | 0.1662 |
| 5378 | PMS1 | P20T-E | Human | Esophagus | ESCC | 8.67e-15 | 3.87e-01 | 0.1124 |
| 5378 | PMS1 | P21T-E | Human | Esophagus | ESCC | 3.79e-20 | 4.53e-01 | 0.1617 |
| 5378 | PMS1 | P22T-E | Human | Esophagus | ESCC | 2.57e-34 | 5.65e-01 | 0.1236 |
| Page: 1 2 3 4 |
| Tissue | Expression Dynamics | Abbreviation |
| Esophagus | 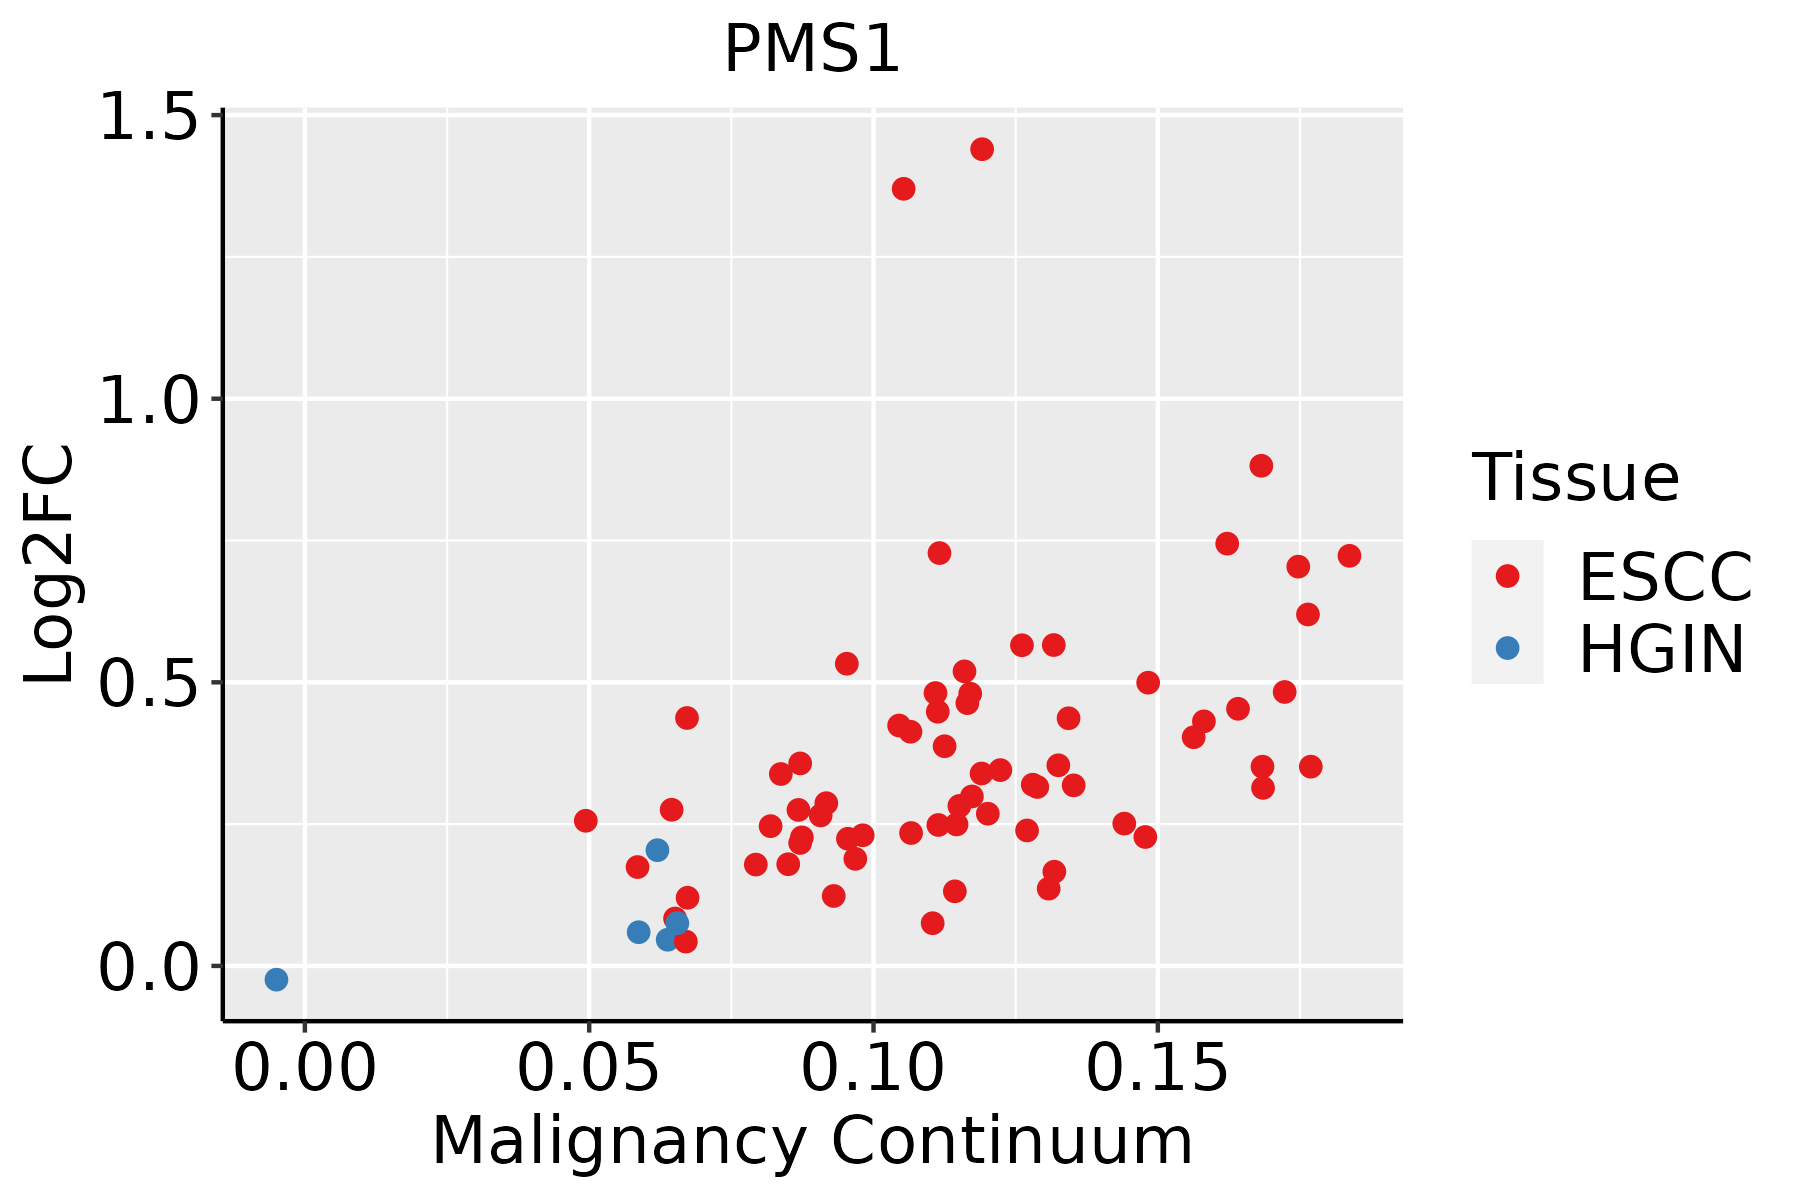 | ESCC: Esophageal squamous cell carcinoma |
| HGIN: High-grade intraepithelial neoplasias | ||
| LGIN: Low-grade intraepithelial neoplasias | ||
| Liver | 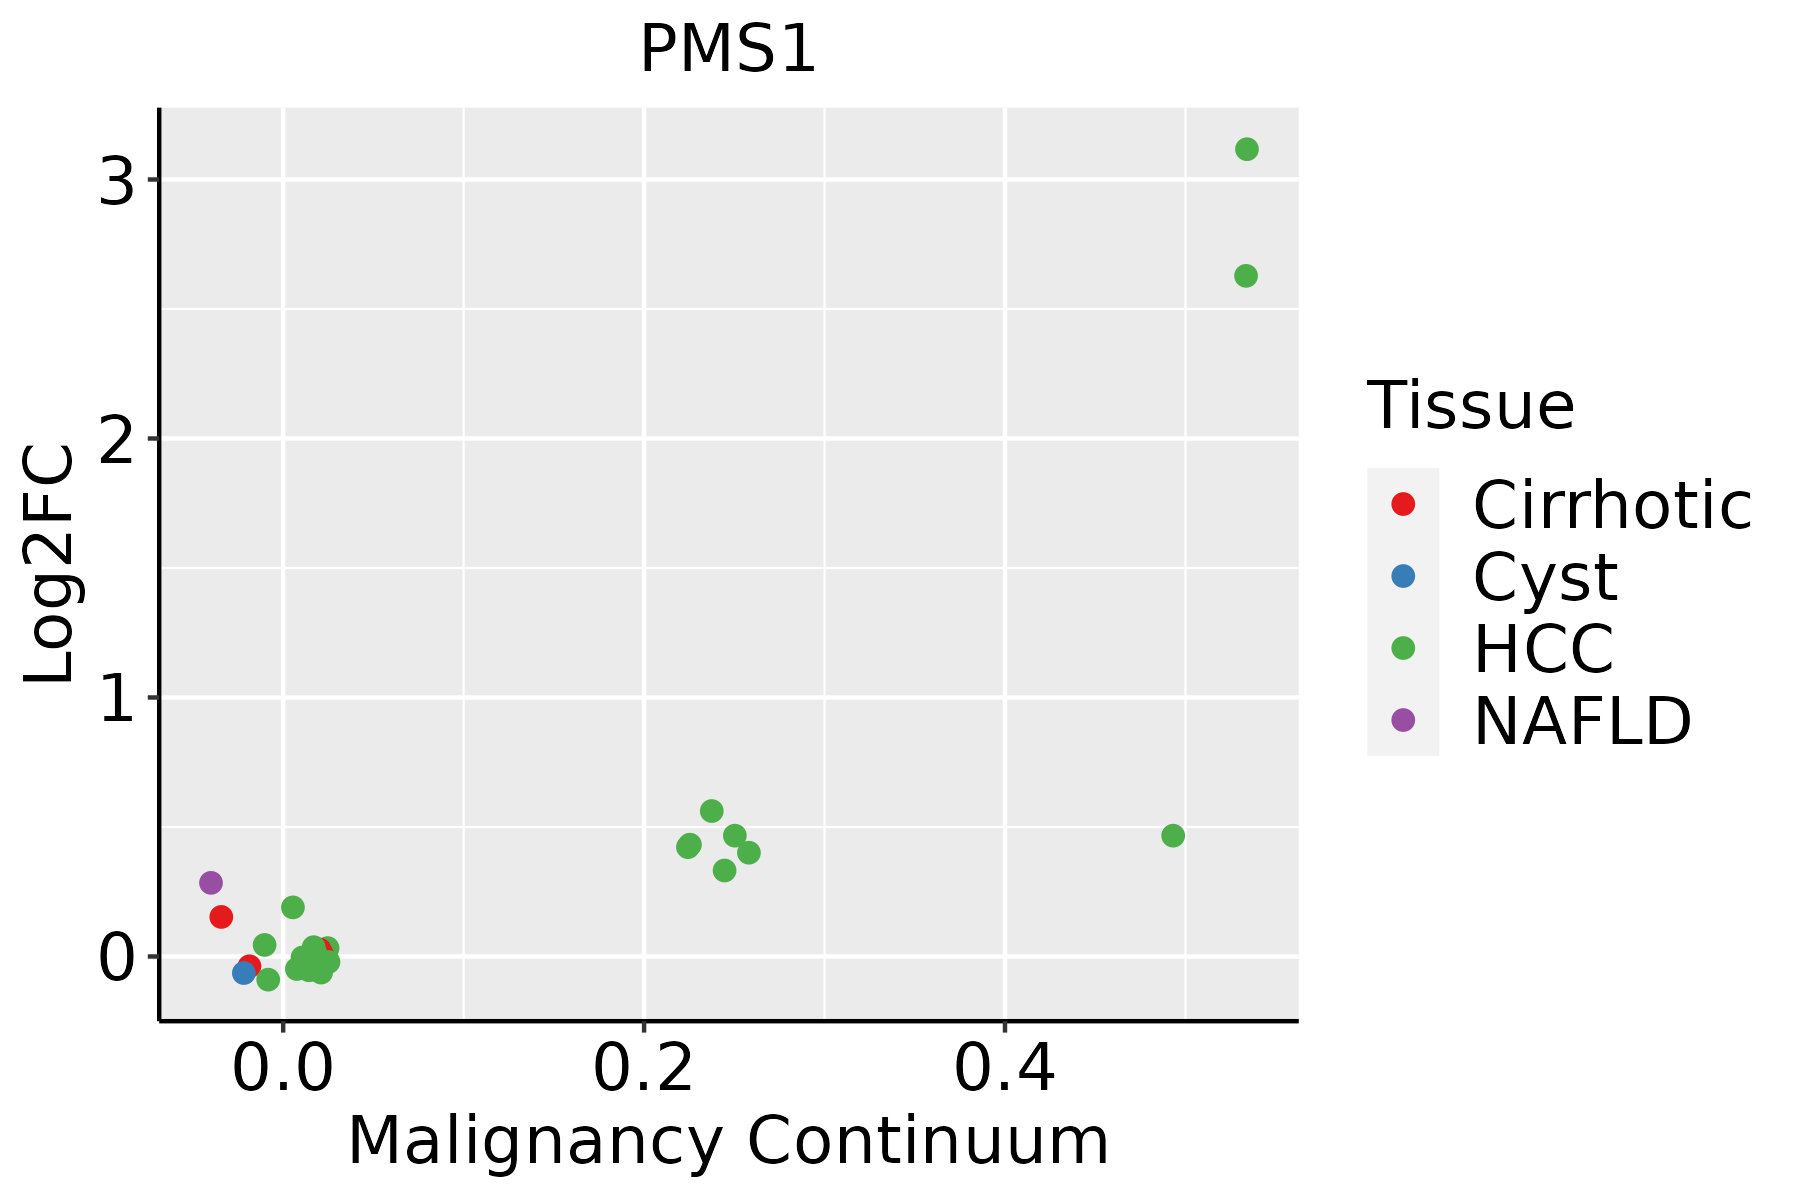 | HCC: Hepatocellular carcinoma |
| NAFLD: Non-alcoholic fatty liver disease |
| ∗log2FC in expression of this searched gene in stem-like cells from each diseased tissue sample relative to stem-like cells in normal samples in each tissue plotted against the malignancy continuum. Samples are colored based on if they are from different disease stage. |
Top |
Malignant transformation related pathway analysis |
| Find out the enriched GO biological processes and KEGG pathways involved in transition from healthy to precancer to cancer |
| Tissue | Disease Stage | Enriched GO biological Processes |
| Colorectum | AD |  |
| Colorectum | SER |  |
| Colorectum | MSS |  |
| Colorectum | MSI-H |  |
| Colorectum | FAP |  |
| ∗Top 15 enriched GO BP terms are showed in the bar plot of each disease state in each tissue. Each row represents a significant GO biological process which is colored according to the -log10(p.adjust). |
| Page: 1 2 3 4 5 6 7 8 9 |
| GO ID | Tissue | Disease Stage | Description | Gene Ratio | Bg Ratio | pvalue | p.adjust | Count |
| GO:000941020 | Esophagus | ESCC | response to xenobiotic stimulus | 253/8552 | 462/18723 | 4.55e-05 | 3.58e-04 | 253 |
| GO:000941022 | Liver | HCC | response to xenobiotic stimulus | 248/7958 | 462/18723 | 6.47e-07 | 1.02e-05 | 248 |
| Page: 1 |
| Pathway ID | Tissue | Disease Stage | Description | Gene Ratio | Bg Ratio | pvalue | p.adjust | qvalue | Count |
| Page: 1 |
Top |
Cell-cell communication analysis |
| Identification of potential cell-cell interactions between two cell types and their ligand-receptor pairs for different disease states |
| Ligand | Receptor | LRpair | Pathway | Tissue | Disease Stage |
| Page: 1 |
Top |
Single-cell gene regulatory network inference analysis |
| Find out the significant the regulons (TFs) and the target genes of each regulon across cell types for different disease states |
| TF | Cell Type | Tissue | Disease Stage | Target Gene | RSS | Regulon Activity |
| ∗The dot plots of a searched regulon are shown for all cell subpopulations in each disease state of each tissue based on the regulon specific score inferred using pySCENIC and by calculating the average expression. |
| Page: 1 |
Top |
Somatic mutation of malignant transformation related genes |
| Annotation of somatic variants for genes involved in malignant transformation |
| Hugo Symbol | Variant Class | Variant Classification | dbSNP RS | HGVSc | HGVSp | HGVSp Short | SWISSPROT | BIOTYPE | SIFT | PolyPhen | Tumor Sample Barcode | Tissue | Histology | Sex | Age | Stage | Therapy Types | Drugs | Outcome |
| PMS1 | SNV | Missense_Mutation | c.1888N>G | p.Arg630Gly | p.R630G | P54277 | protein_coding | deleterious(0) | probably_damaging(0.976) | TCGA-A8-A06X-01 | Breast | breast invasive carcinoma | Female | >=65 | I/II | Unknown | Unknown | SD | |
| PMS1 | SNV | Missense_Mutation | c.2761N>G | p.Phe921Val | p.F921V | P54277 | protein_coding | deleterious(0) | possibly_damaging(0.729) | TCGA-AN-A0AJ-01 | Breast | breast invasive carcinoma | Female | >=65 | I/II | Unknown | Unknown | SD | |
| PMS1 | SNV | Missense_Mutation | rs753545002 | c.1472C>T | p.Ser491Leu | p.S491L | P54277 | protein_coding | tolerated(0.52) | benign(0) | TCGA-AR-A0TR-01 | Breast | breast invasive carcinoma | Female | >=65 | I/II | Hormone Therapy | tamoxiphen | SD |
| PMS1 | SNV | Missense_Mutation | rs773928881 | c.830N>A | p.Arg277Gln | p.R277Q | P54277 | protein_coding | deleterious(0.04) | possibly_damaging(0.581) | TCGA-BH-A0BW-01 | Breast | breast invasive carcinoma | Female | >=65 | I/II | Chemotherapy | adriamycin | CR |
| PMS1 | SNV | Missense_Mutation | c.2703N>G | p.Ile901Met | p.I901M | P54277 | protein_coding | tolerated(0.15) | benign(0.035) | TCGA-C8-A274-01 | Breast | breast invasive carcinoma | Female | <65 | I/II | Hormone Therapy | tamoxiphen | SD | |
| PMS1 | SNV | Missense_Mutation | c.1959N>C | p.Lys653Asn | p.K653N | P54277 | protein_coding | tolerated(0.09) | benign(0.145) | TCGA-E2-A1LG-01 | Breast | breast invasive carcinoma | Female | <65 | I/II | Chemotherapy | doxorubicin | SD | |
| PMS1 | SNV | Missense_Mutation | rs761453284 | c.305G>A | p.Cys102Tyr | p.C102Y | P54277 | protein_coding | deleterious(0) | benign(0.138) | TCGA-EW-A1J5-01 | Breast | breast invasive carcinoma | Female | <65 | I/II | Chemotherapy | adriamycin | SD |
| PMS1 | SNV | Missense_Mutation | novel | c.183N>G | p.Ile61Met | p.I61M | P54277 | protein_coding | deleterious(0) | probably_damaging(0.943) | TCGA-XX-A89A-01 | Breast | breast invasive carcinoma | Female | >=65 | I/II | Unknown | Unknown | SD |
| PMS1 | deletion | Frame_Shift_Del | novel | c.2757delN | p.Pro920HisfsTer6 | p.P920Hfs*6 | P54277 | protein_coding | TCGA-EW-A2FV-01 | Breast | breast invasive carcinoma | Female | <65 | III/IV | Chemotherapy | docetaxel | SD | ||
| PMS1 | SNV | Missense_Mutation | novel | c.176A>G | p.Glu59Gly | p.E59G | P54277 | protein_coding | tolerated(0.09) | benign(0.145) | TCGA-2W-A8YY-01 | Cervix | cervical & endocervical cancer | Female | <65 | I/II | Chemotherapy | cisplatin | CR |
| Page: 1 2 3 4 5 6 7 8 9 10 11 |
Top |
Related drugs of malignant transformation related genes |
| Identification of chemicals and drugs interact with genes involved in malignant transfromation |
| (DGIdb 4.0) |
| Entrez ID | Symbol | Category | Interaction Types | Drug Claim Name | Drug Name | PMIDs |
| Page: 1 |

Copyright 2023-Present -The University of Texas Health Science Center at Houston |