Schematic overview of the cellular and molecular mechanisms involved in the cancer progression, including the proposed cellular and molecular mechanisms in cancer cells trajectory. AT1: alveolar type 1 cells; AT2: alveolar type 2 cells; AAH: atypical adenomatous hyperplasia; AIS: adenocarcinoma in situ; MIA: minimally invasive adenocarcinoma; IA: invasive adenocarcinoma; EMT: epithelial-mesenchymal transition

Home

Download

Statistics

Help

Contact

Center for Computational Systems Medicine
leaf

Gene summary

leaf

Malignant transformation analysis

leaf

Malignant transformation related pathway analysis

leaf

Cell-cell communication analysis

leaf

Single-cell gene regulatory network inference analysis

leaf

Somatic mutation of malignant transformation related genes

leaf

Related drugs of malignant transformation related genes

Gene: PMPCB

Gene summary for PMPCB

check button Gene summary.

Gene informationSpeciesHuman
Gene symbol

PMPCB

Gene ID

9512

Gene namepeptidase, mitochondrial processing subunit beta
Gene AliasBeta-MPP
Cytomap7q22.1
Gene Typeprotein-coding
GO ID

GO:0006508

UniProtAcc

B3KM34


Top

Malignant transformation analysis

check button Identification of the aberrant gene expression in precancerous and cancerous lesions by comparing the gene expression of stem-like cells in diseased tissues with normal stem cells
check button Malignant transformation involving gene list.
Entrez IDSymbolReplicatesSpeciesOrganTissueAdj P-valueLog2FCMalignancy
9512PMPCBLZE2THumanEsophagusESCC8.94e-106.52e-010.082
9512PMPCBLZE4THumanEsophagusESCC1.14e-123.81e-010.0811
9512PMPCBLZE5THumanEsophagusESCC5.38e-051.48e-010.0514
9512PMPCBLZE7THumanEsophagusESCC6.40e-095.69e-010.0667
9512PMPCBLZE8THumanEsophagusESCC3.65e-072.02e-010.067
9512PMPCBLZE20THumanEsophagusESCC7.50e-061.95e-010.0662
9512PMPCBLZE22THumanEsophagusESCC1.04e-033.21e-010.068
9512PMPCBLZE24THumanEsophagusESCC1.42e-206.05e-010.0596
9512PMPCBP1T-EHumanEsophagusESCC3.65e-065.09e-010.0875
9512PMPCBP2T-EHumanEsophagusESCC1.89e-801.47e+000.1177
9512PMPCBP4T-EHumanEsophagusESCC9.49e-411.02e+000.1323
9512PMPCBP5T-EHumanEsophagusESCC5.99e-225.01e-010.1327
9512PMPCBP8T-EHumanEsophagusESCC3.17e-223.29e-010.0889
9512PMPCBP9T-EHumanEsophagusESCC2.01e-164.61e-010.1131
9512PMPCBP10T-EHumanEsophagusESCC2.49e-325.49e-010.116
9512PMPCBP11T-EHumanEsophagusESCC2.16e-155.86e-010.1426
9512PMPCBP12T-EHumanEsophagusESCC1.01e-511.09e+000.1122
9512PMPCBP15T-EHumanEsophagusESCC3.38e-521.24e+000.1149
9512PMPCBP16T-EHumanEsophagusESCC9.40e-611.12e+000.1153
9512PMPCBP17T-EHumanEsophagusESCC1.09e-191.01e+000.1278
Page: 1 2 3 4 5 6 7 

check button Transcriptomic changes along malignancy continuum.
TissueExpression DynamicsAbbreviation
EsophagusThe image shows the transcriptomic changes along malignancy continuum.log2FC in expression of this searched gene in stem-like cells from each diseased tissue sample relative to stem-like cells in normal samples in each tissue plotted against the malignancy continuum. Samples are colored based on if they are from different disease stage.
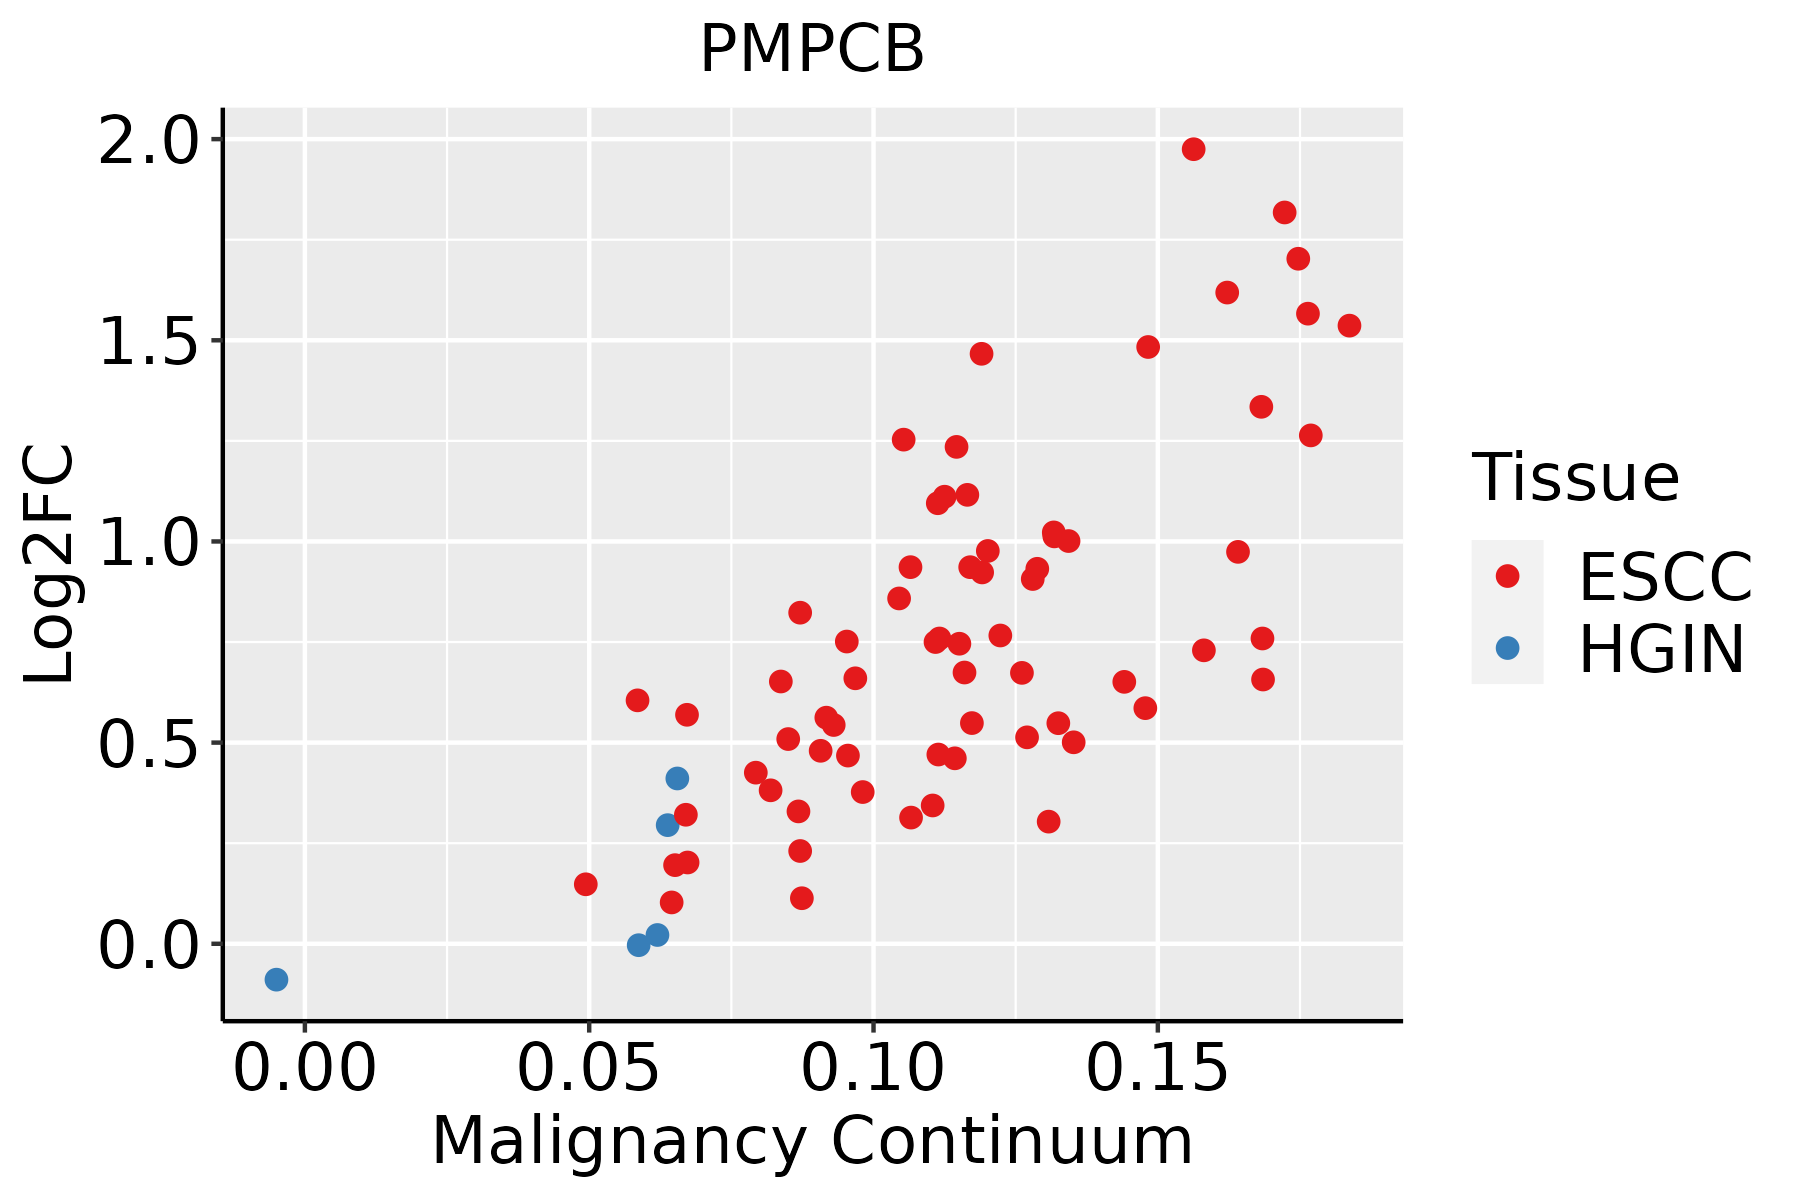
ESCC: Esophageal squamous cell carcinoma
HGIN: High-grade intraepithelial neoplasias
LGIN: Low-grade intraepithelial neoplasias
LiverThe image shows the transcriptomic changes along malignancy continuum.log2FC in expression of this searched gene in stem-like cells from each diseased tissue sample relative to stem-like cells in normal samples in each tissue plotted against the malignancy continuum. Samples are colored based on if they are from different disease stage.HCC: Hepatocellular carcinoma
NAFLD: Non-alcoholic fatty liver disease
Oral CavityThe image shows the transcriptomic changes along malignancy continuum.log2FC in expression of this searched gene in stem-like cells from each diseased tissue sample relative to stem-like cells in normal samples in each tissue plotted against the malignancy continuum. Samples are colored based on if they are from different disease stage.
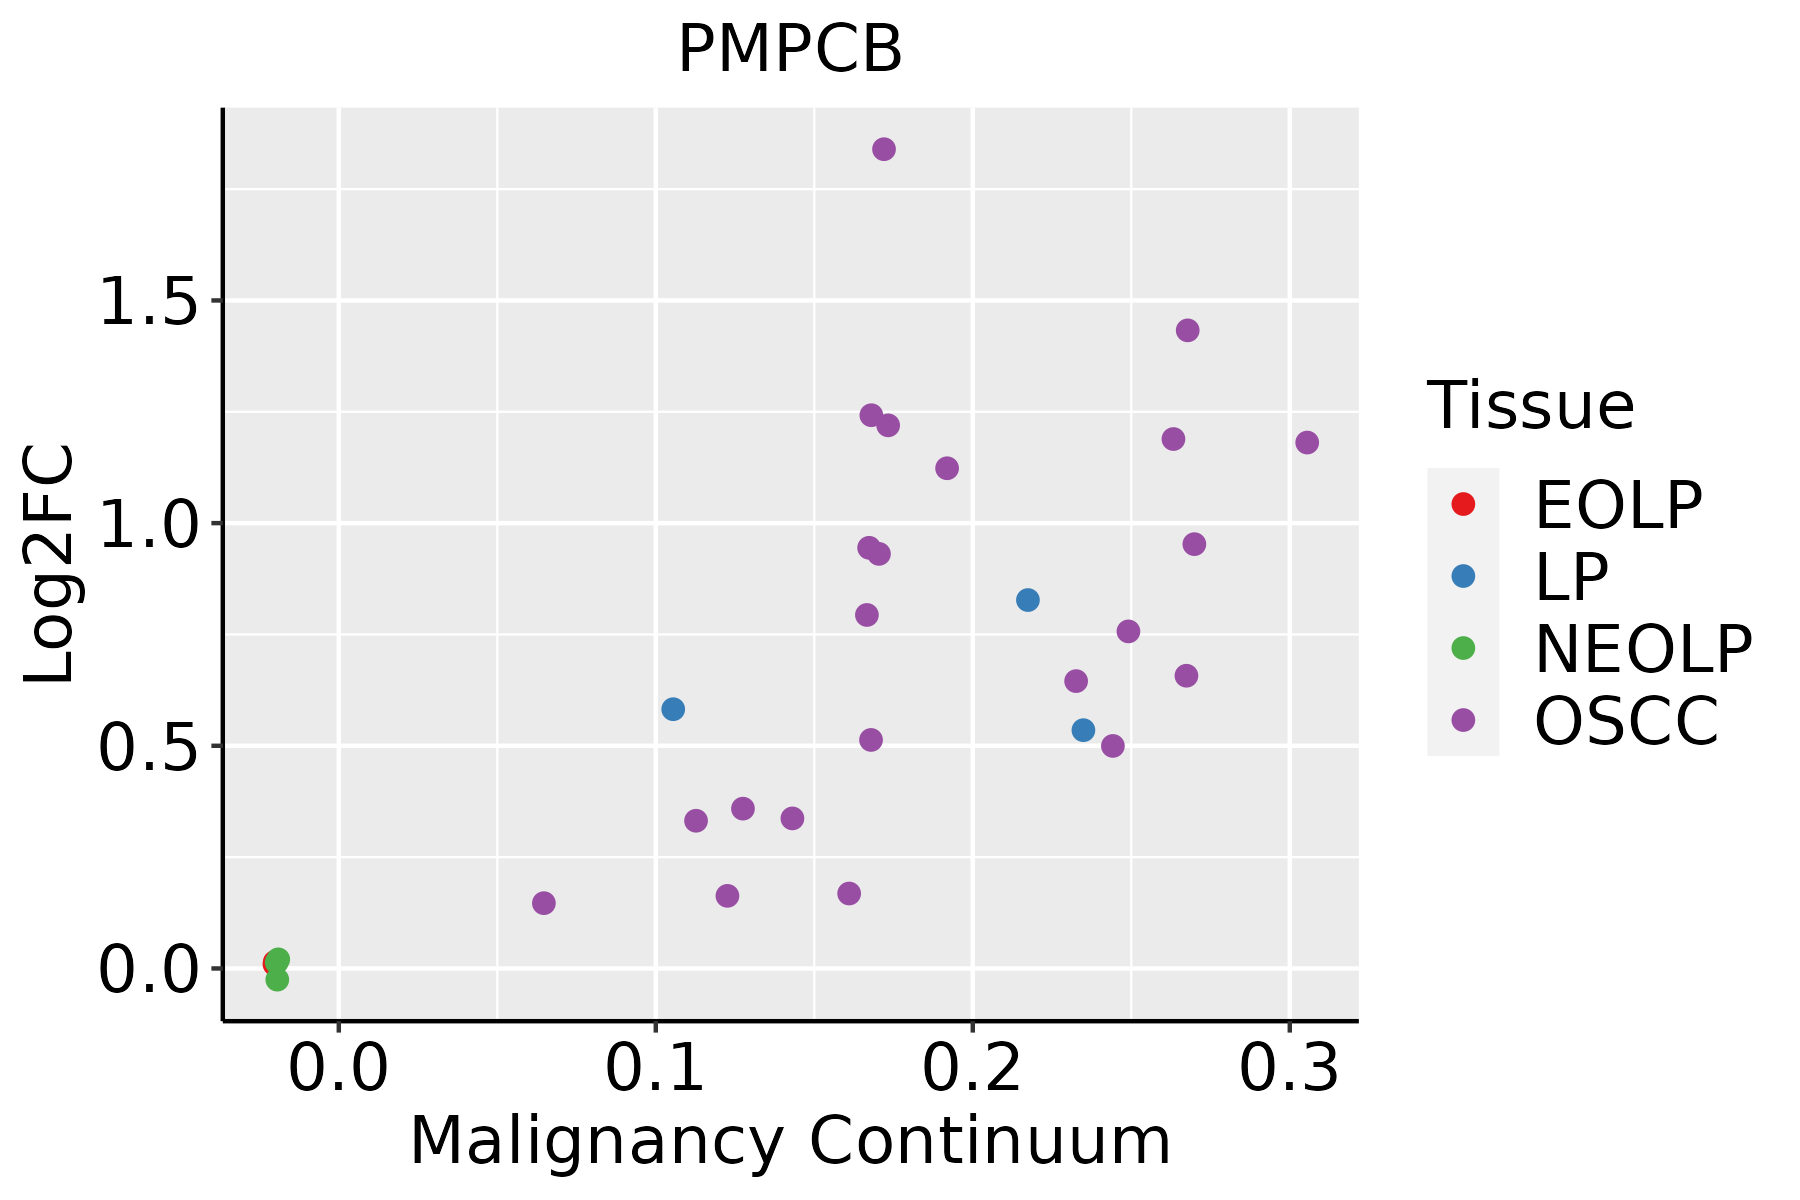
EOLP: Erosive Oral lichen planus
LP: leukoplakia
NEOLP: Non-erosive oral lichen planus
OSCC: Oral squamous cell carcinoma
ProstateThe image shows the transcriptomic changes along malignancy continuum.log2FC in expression of this searched gene in stem-like cells from each diseased tissue sample relative to stem-like cells in normal samples in each tissue plotted against the malignancy continuum. Samples are colored based on if they are from different disease stage.
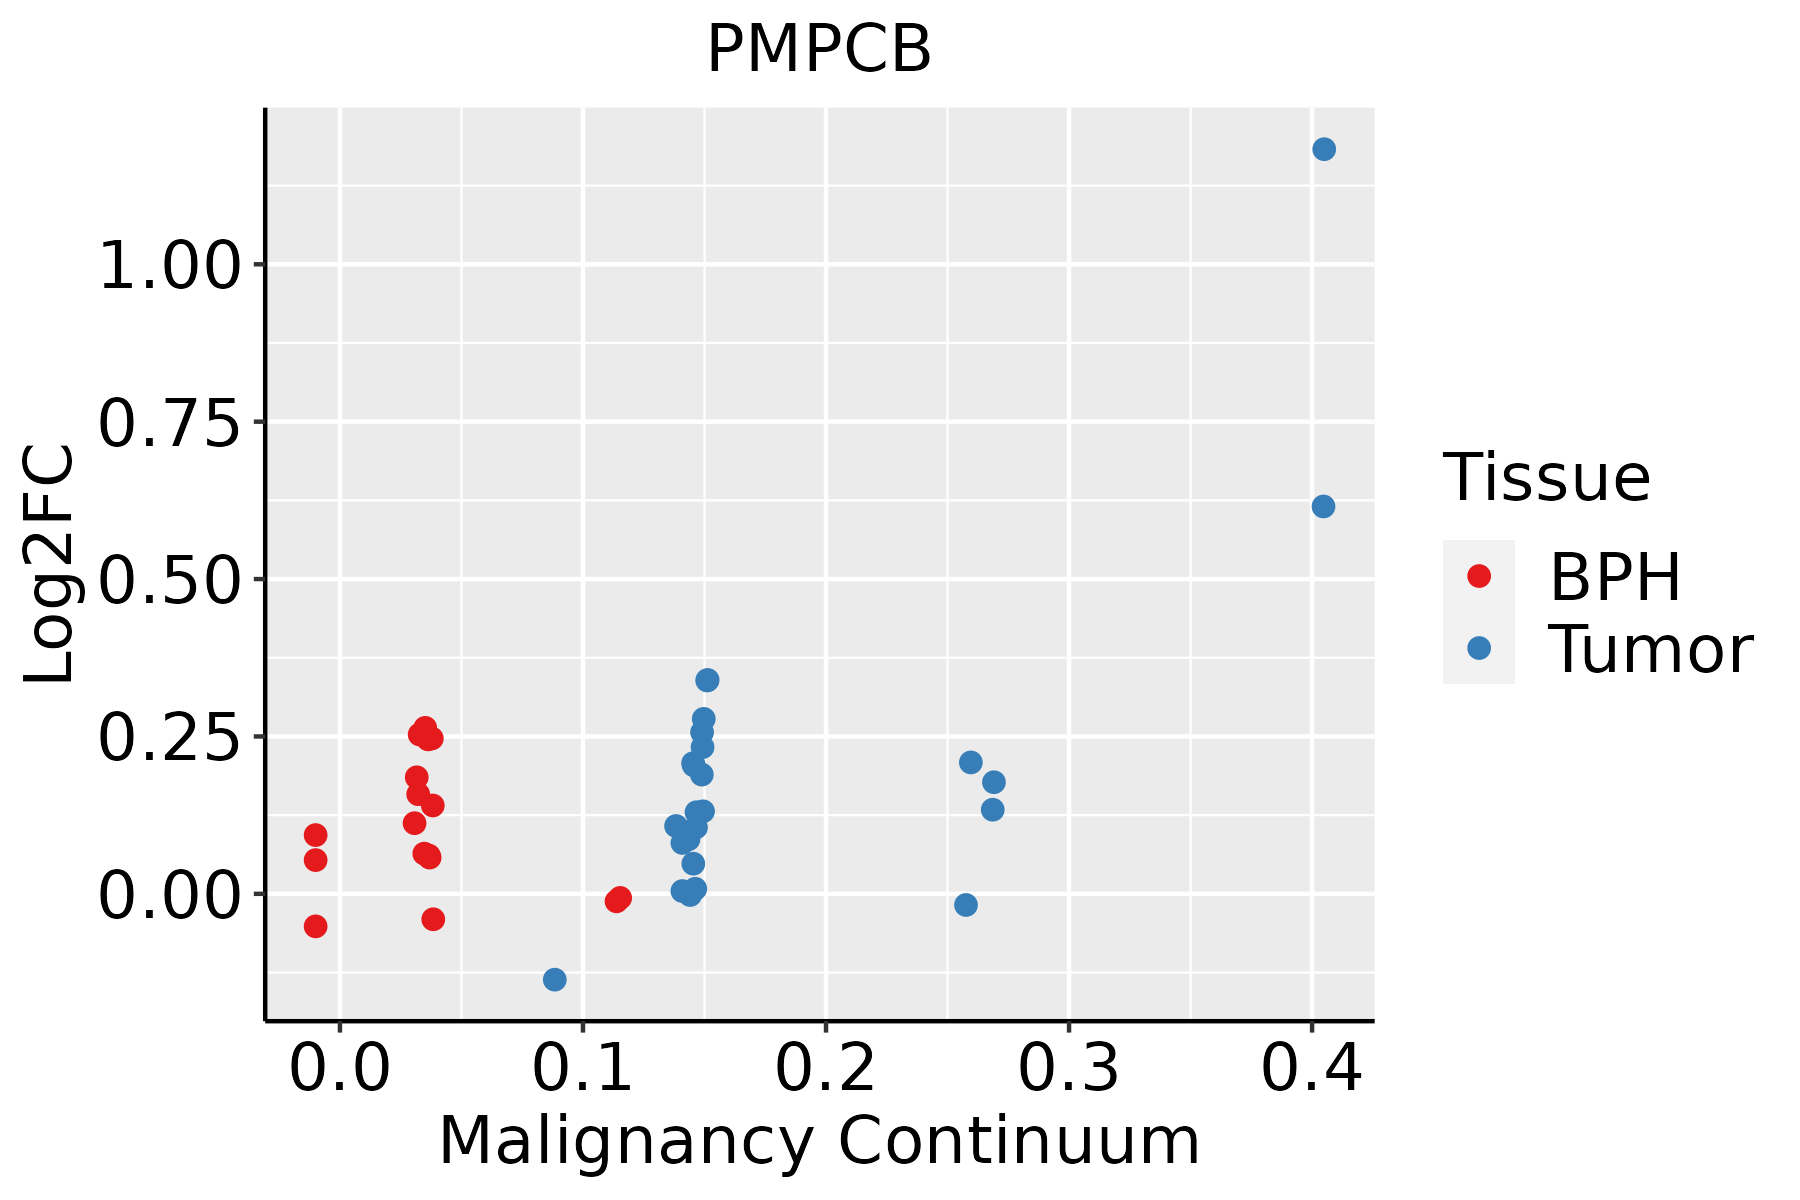
BPH: Benign Prostatic Hyperplasia
SkinThe image shows the transcriptomic changes along malignancy continuum.log2FC in expression of this searched gene in stem-like cells from each diseased tissue sample relative to stem-like cells in normal samples in each tissue plotted against the malignancy continuum. Samples are colored based on if they are from different disease stage.
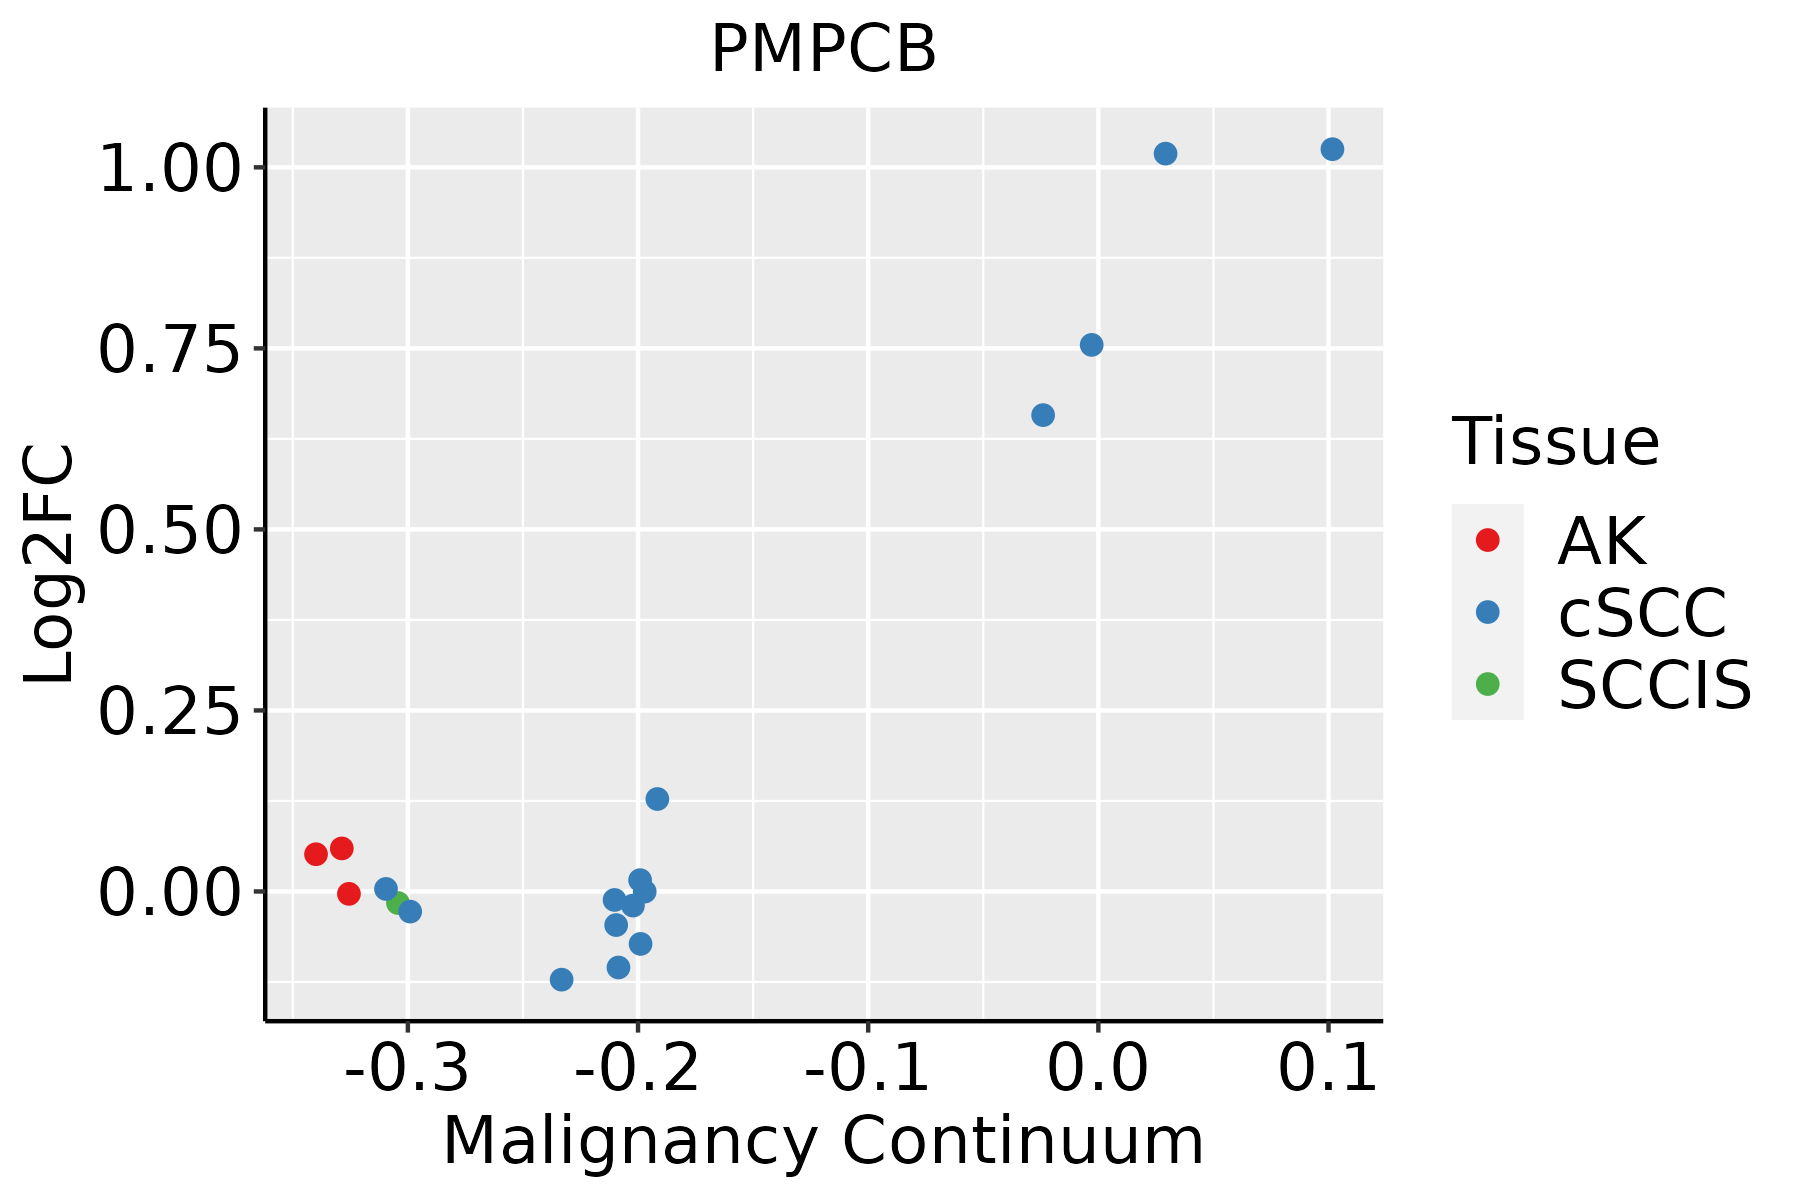
AK: Actinic keratosis
cSCC: Cutaneous squamous cell carcinoma
SCCIS:squamous cell carcinoma in situ
ThyroidThe image shows the transcriptomic changes along malignancy continuum.log2FC in expression of this searched gene in stem-like cells from each diseased tissue sample relative to stem-like cells in normal samples in each tissue plotted against the malignancy continuum. Samples are colored based on if they are from different disease stage.ATC: Anaplastic thyroid cancer
HT: Hashimoto's thyroiditis
PTC: Papillary thyroid cancer
∗log2FC in expression of this searched gene in stem-like cells from each diseased tissue sample relative to stem-like cells in normal samples in each tissue plotted against the malignancy continuum. Samples are colored based on if they are from different disease stage.

Top

Malignant transformation related pathway analysis

check buttonFind out the enriched GO biological processes and KEGG pathways involved in transition from healthy to precancer to cancer
check button Figure of enriched GO biological processes.
TissueDisease StageEnriched GO biological Processes
ColorectumADGO analysis - Figure of enriched GO biological processes: Top 15 enriched GO BP terms are showed in the bar plot of each disease state in each tissue. Each row represents a significant GO biological process which is colored according to the -log10(p.adjust).
ColorectumSERGO analysis - Figure of enriched GO biological processes: Top 15 enriched GO BP terms are showed in the bar plot of each disease state in each tissue. Each row represents a significant GO biological process which is colored according to the -log10(p.adjust).
ColorectumMSSGO analysis - Figure of enriched GO biological processes: Top 15 enriched GO BP terms are showed in the bar plot of each disease state in each tissue. Each row represents a significant GO biological process which is colored according to the -log10(p.adjust).
ColorectumMSI-HGO analysis - Figure of enriched GO biological processes: Top 15 enriched GO BP terms are showed in the bar plot of each disease state in each tissue. Each row represents a significant GO biological process which is colored according to the -log10(p.adjust).
ColorectumFAPGO analysis - Figure of enriched GO biological processes: Top 15 enriched GO BP terms are showed in the bar plot of each disease state in each tissue. Each row represents a significant GO biological process which is colored according to the -log10(p.adjust).
∗Top 15 enriched GO BP terms are showed in the bar plot of each disease state in each tissue. Each row represents a significant GO biological process which is colored according to the -log10(p.adjust).
Page: 1 2 3 4 5 6 7 8 9 

check button Enriched GO biological processes.
GO IDTissueDisease StageDescriptionGene RatioBg Ratiopvaluep.adjustCount
GO:0072594110EsophagusESCCestablishment of protein localization to organelle311/8552422/187233.02e-322.13e-29311
GO:0006605111EsophagusESCCprotein targeting229/8552314/187234.93e-231.01e-20229
GO:0006839110EsophagusESCCmitochondrial transport187/8552254/187238.35e-209.81e-18187
GO:0072655110EsophagusESCCestablishment of protein localization to mitochondrion97/8552120/187232.17e-151.33e-1397
GO:0070585110EsophagusESCCprotein localization to mitochondrion100/8552125/187232.96e-151.77e-13100
GO:0006626110EsophagusESCCprotein targeting to mitochondrion81/8552100/187233.60e-131.67e-1181
GO:005160418EsophagusESCCprotein maturation189/8552294/187237.64e-112.39e-09189
GO:001648514EsophagusESCCprotein processing134/8552225/187231.81e-051.60e-04134
GO:007259412LiverCirrhoticestablishment of protein localization to organelle189/4634422/187231.01e-192.45e-17189
GO:00066057LiverCirrhoticprotein targeting148/4634314/187233.86e-186.20e-16148
GO:00068397LiverCirrhoticmitochondrial transport112/4634254/187231.03e-116.66e-10112
GO:00705857LiverCirrhoticprotein localization to mitochondrion65/4634125/187234.91e-112.77e-0965
GO:00726557LiverCirrhoticestablishment of protein localization to mitochondrion63/4634120/187235.70e-113.19e-0963
GO:00516046LiverCirrhoticprotein maturation121/4634294/187233.54e-101.68e-08121
GO:00066267LiverCirrhoticprotein targeting to mitochondrion53/4634100/187231.19e-095.27e-0853
GO:00164853LiverCirrhoticprotein processing85/4634225/187239.01e-061.32e-0485
GO:007259422LiverHCCestablishment of protein localization to organelle299/7958422/187231.06e-326.10e-30299
GO:000660512LiverHCCprotein targeting219/7958314/187237.74e-231.49e-20219
GO:000683912LiverHCCmitochondrial transport184/7958254/187232.30e-223.83e-20184
GO:007265512LiverHCCestablishment of protein localization to mitochondrion98/7958120/187231.18e-181.46e-1698
Page: 1 2 3 4 

check button Enriched KEGG pathways.
Pathway IDTissueDisease StageDescriptionGene RatioBg Ratiopvaluep.adjustqvalueCount
Page: 1 

Top

Cell-cell communication analysis

check buttonIdentification of potential cell-cell interactions between two cell types and their ligand-receptor pairs for different disease states
LigandReceptorLRpairPathwayTissueDisease Stage
Page: 1 

Top

Single-cell gene regulatory network inference analysis

check buttonFind out the significant the regulons (TFs) and the target genes of each regulon across cell types for different disease states
TFCell TypeTissueDisease StageTarget GeneRSSRegulon Activity
∗The dot plots of a searched regulon are shown for all cell subpopulations in each disease state of each tissue based on the regulon specific score inferred using pySCENIC and by calculating the average expression.
Page: 1 

Top

Somatic mutation of malignant transformation related genes

check buttonAnnotation of somatic variants for genes involved in malignant transformation
Hugo SymbolVariant ClassVariant ClassificationdbSNP RSHGVScHGVSpHGVSp ShortSWISSPROTBIOTYPESIFTPolyPhenTumor Sample BarcodeTissueHistologySexAgeStageTherapy TypesDrugsOutcome
PMPCBSNVMissense_Mutationc.1300C>Gp.Pro434Alap.P434AO75439protein_codingdeleterious(0.02)possibly_damaging(0.899)TCGA-AO-A0JC-01Breastbreast invasive carcinomaFemale<65I/IIChemotherapyfluorouracilSD
PMPCBSNVMissense_Mutationc.1204N>Cp.Asn402Hisp.N402HO75439protein_codingdeleterious(0)probably_damaging(0.997)TCGA-E2-A1B5-01Breastbreast invasive carcinomaFemale<65I/IIHormone TherapytamoxiphenSD
PMPCBinsertionNonsense_Mutationnovelc.980_981insGTAATGTACATCACATTATACCACCTAGGGTTTAp.Phe327LeufsTer2p.F327Lfs*2O75439protein_codingTCGA-A2-A04V-01Breastbreast invasive carcinomaFemale<65I/IIChemotherapycytoxanPD
PMPCBinsertionIn_Frame_Insnovelc.150_151insCATCCTTCATCCTCTACCTTCCTTCTAGCAGAAATGGCGp.Gln50_Val51insHisProSerSerSerThrPheLeuLeuAlaGluMetAlap.Q50_V51insHPSSSTFLLAEMAO75439protein_codingTCGA-A8-A07W-01Breastbreast invasive carcinomaFemale>=65III/IVHormone TherapyexemestaneSD
PMPCBinsertionIn_Frame_Insnovelc.327_327+1insTTTAATATCAGATTAGTAATGTGTTTTp.Lys109_Gly110insPheAsnIleArgLeuValMetCysPhep.K109_G110insFNIRLVMCFO75439protein_codingTCGA-BH-A0B1-01Breastbreast invasive carcinomaFemale>=65I/IIChemotherapyadriamycinSD
PMPCBSNVMissense_Mutationnovelc.1196N>Ap.Arg399Glnp.R399QO75439protein_codingdeleterious(0.02)probably_damaging(0.968)TCGA-VS-A9V3-01Cervixcervical & endocervical cancerFemale<65I/IIChemotherapycisplatinPD
PMPCBSNVMissense_Mutationc.339G>Cp.Lys113Asnp.K113NO75439protein_codingtolerated(0.25)benign(0.047)TCGA-AG-A026-01Colorectumrectum adenocarcinomaMale>=65I/IIUnknownUnknownPD
PMPCBSNVMissense_Mutationnovelc.1342N>Cp.Glu448Glnp.E448QO75439protein_codingtolerated(0.64)benign(0)TCGA-AH-6544-01Colorectumrectum adenocarcinomaMale<65III/IVChemotherapyoxaliplatinSD
PMPCBSNVMissense_Mutationrs139269263c.212C>Tp.Ser71Leup.S71LO75439protein_codingdeleterious(0)probably_damaging(0.999)TCGA-F5-6814-01Colorectumrectum adenocarcinomaMale<65I/IIUnknownUnknownSD
PMPCBSNVMissense_Mutationrs200188353c.524N>Ap.Arg175Hisp.R175HO75439protein_codingdeleterious(0)probably_damaging(1)TCGA-AJ-A3OJ-01Endometriumuterine corpus endometrioid carcinomaFemale<65I/IIChemotherapycarboplatinCR
Page: 1 2 3 4 5 

Top

Related drugs of malignant transformation related genes

check buttonIdentification of chemicals and drugs interact with genes involved in malignant transfromation
(DGIdb 4.0)
Entrez IDSymbolCategoryInteraction TypesDrug Claim NameDrug NamePMIDs
Page: 1