
|
|||||
|
 | |
| |
| |
| |
| |
| |
|
Gene: PMP22 |
Gene summary for PMP22 |
| Gene information | Species | Human | Gene symbol | PMP22 | Gene ID | 5376 |
| Gene name | peripheral myelin protein 22 | |
| Gene Alias | CIDP | |
| Cytomap | 17p12 | |
| Gene Type | protein-coding | GO ID | GO:0007154 | UniProtAcc | Q01453 |
Top |
Malignant transformation analysis |
| Identification of the aberrant gene expression in precancerous and cancerous lesions by comparing the gene expression of stem-like cells in diseased tissues with normal stem cells |
| Entrez ID | Symbol | Replicates | Species | Organ | Tissue | Adj P-value | Log2FC | Malignancy |
| 5376 | PMP22 | GSM4909281 | Human | Breast | IDC | 1.03e-18 | 5.27e-01 | 0.21 |
| 5376 | PMP22 | GSM4909304 | Human | Breast | IDC | 6.33e-10 | 4.59e-01 | 0.1636 |
| 5376 | PMP22 | GSM4909307 | Human | Breast | IDC | 8.49e-16 | 5.35e-01 | 0.1569 |
| 5376 | PMP22 | GSM4909308 | Human | Breast | IDC | 9.57e-16 | 5.27e-01 | 0.158 |
| 5376 | PMP22 | GSM4909311 | Human | Breast | IDC | 2.80e-02 | -2.84e-02 | 0.1534 |
| 5376 | PMP22 | GSM4909312 | Human | Breast | IDC | 7.81e-03 | 2.57e-01 | 0.1552 |
| 5376 | PMP22 | GSM4909319 | Human | Breast | IDC | 2.30e-08 | -7.60e-03 | 0.1563 |
| 5376 | PMP22 | brca2 | Human | Breast | Precancer | 1.17e-04 | 2.37e-01 | -0.024 |
| 5376 | PMP22 | DCIS2 | Human | Breast | DCIS | 2.20e-08 | -3.34e-02 | 0.0085 |
| 5376 | PMP22 | P2T-E | Human | Esophagus | ESCC | 7.32e-20 | 2.46e-01 | 0.1177 |
| 5376 | PMP22 | P4T-E | Human | Esophagus | ESCC | 2.06e-11 | 1.10e+00 | 0.1323 |
| 5376 | PMP22 | P5T-E | Human | Esophagus | ESCC | 1.61e-03 | 4.12e-01 | 0.1327 |
| 5376 | PMP22 | P8T-E | Human | Esophagus | ESCC | 3.80e-02 | 6.14e-01 | 0.0889 |
| 5376 | PMP22 | P9T-E | Human | Esophagus | ESCC | 2.05e-17 | 1.22e+00 | 0.1131 |
| 5376 | PMP22 | P10T-E | Human | Esophagus | ESCC | 1.29e-36 | 1.08e+00 | 0.116 |
| 5376 | PMP22 | P11T-E | Human | Esophagus | ESCC | 2.62e-21 | 2.23e+00 | 0.1426 |
| 5376 | PMP22 | P12T-E | Human | Esophagus | ESCC | 2.59e-26 | 1.06e+00 | 0.1122 |
| 5376 | PMP22 | P15T-E | Human | Esophagus | ESCC | 5.58e-04 | 3.92e-01 | 0.1149 |
| 5376 | PMP22 | P16T-E | Human | Esophagus | ESCC | 1.07e-17 | 4.92e-01 | 0.1153 |
| 5376 | PMP22 | P19T-E | Human | Esophagus | ESCC | 9.75e-15 | 2.61e+00 | 0.1662 |
| Page: 1 2 3 4 5 |
| Tissue | Expression Dynamics | Abbreviation |
| Breast | 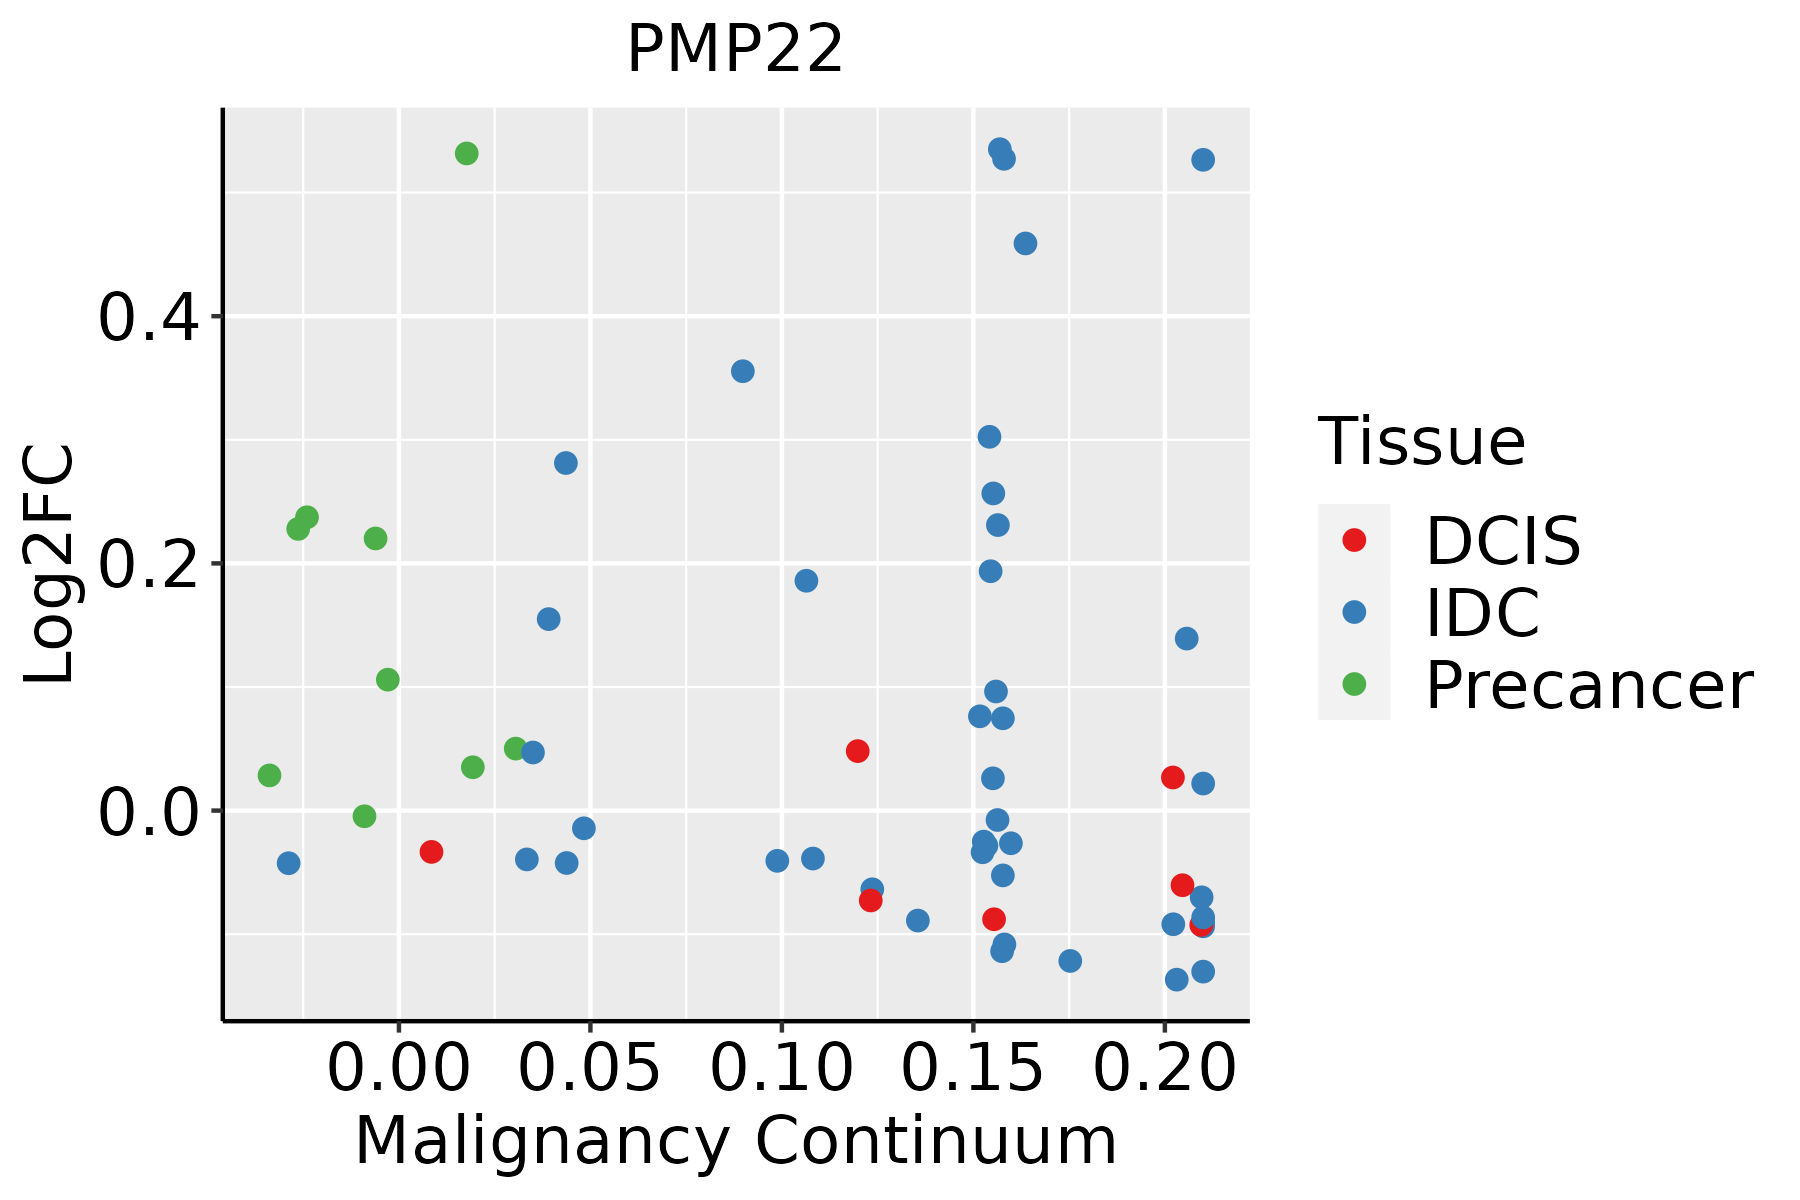 | IDC: Invasive ductal carcinoma |
| DCIS: Ductal carcinoma in situ | ||
| Precancer(BRCA1-mut): Precancerous lesion from BRCA1 mutation carriers | ||
| Esophagus |  | ESCC: Esophageal squamous cell carcinoma |
| HGIN: High-grade intraepithelial neoplasias | ||
| LGIN: Low-grade intraepithelial neoplasias | ||
| GC | 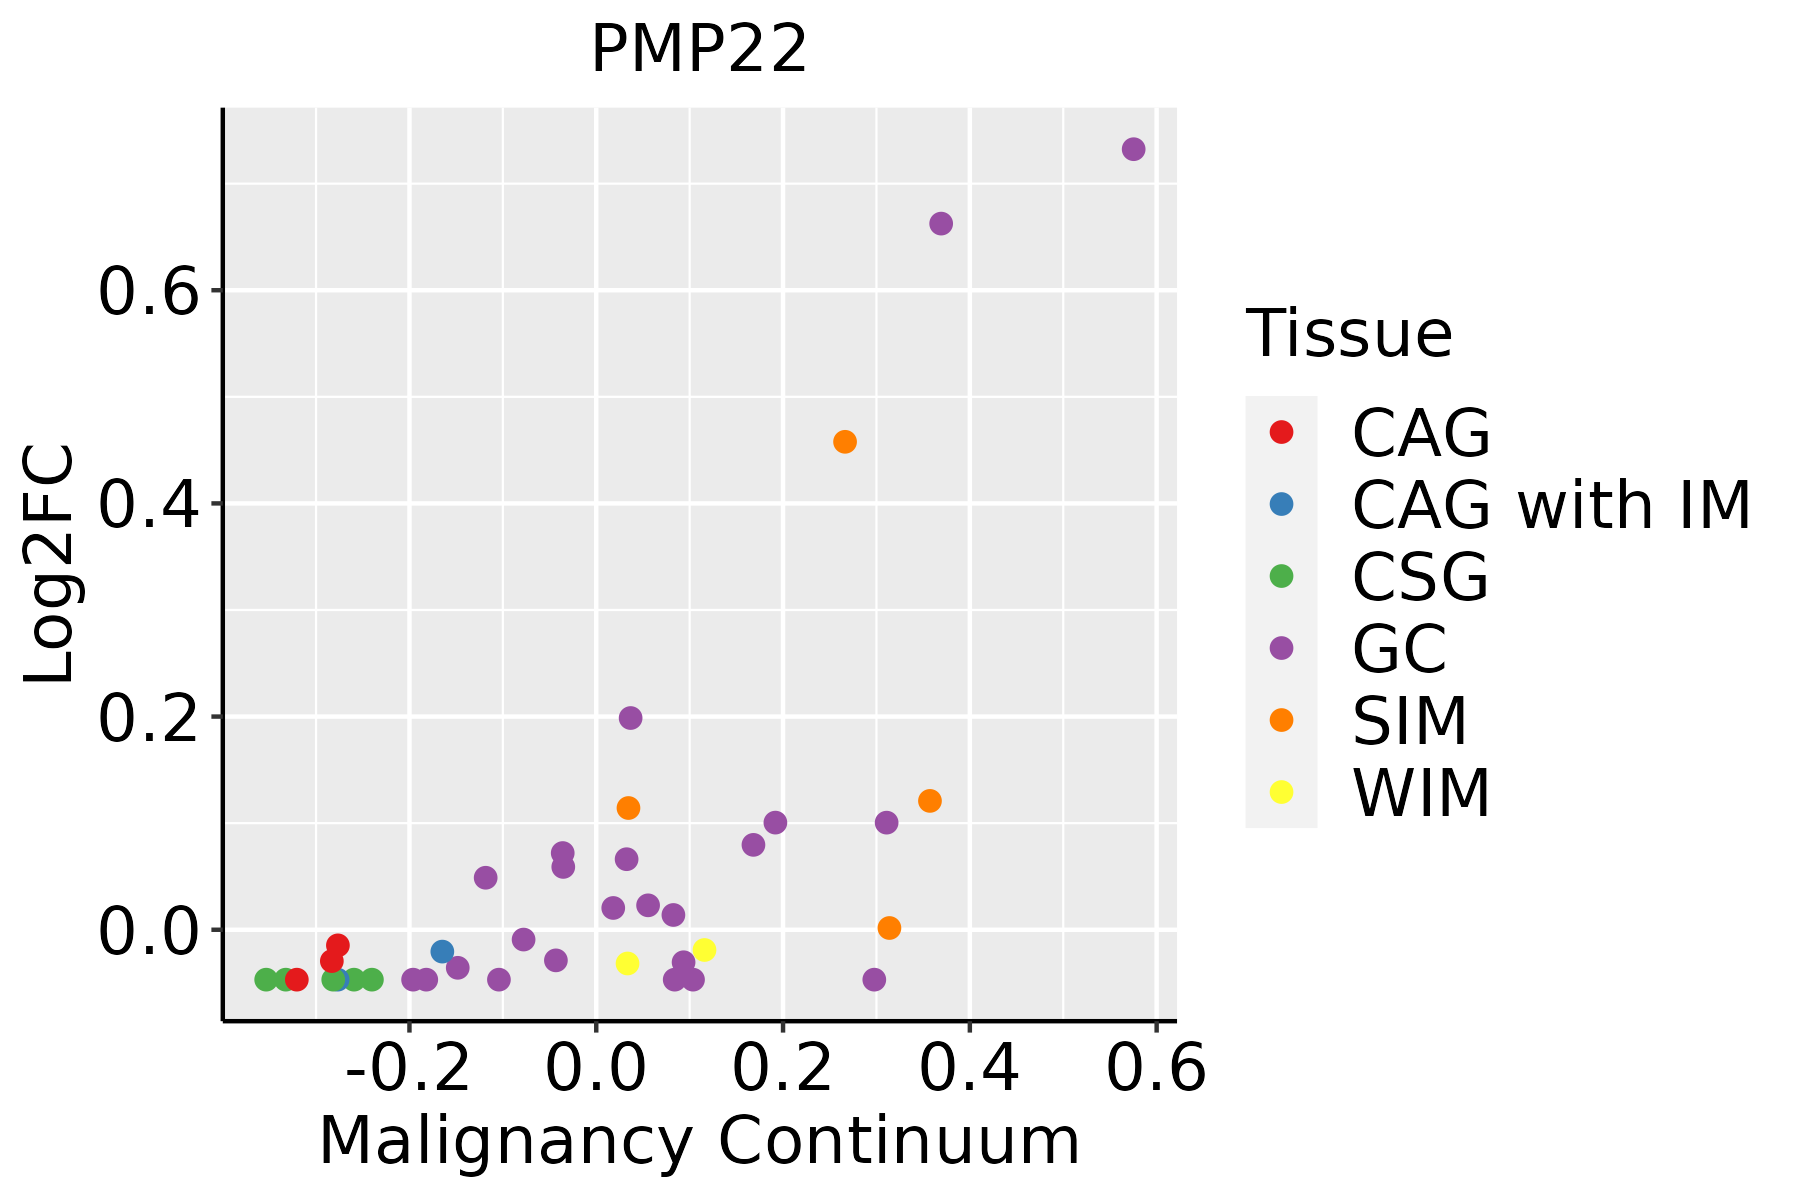 | CAG: Chronic atrophic gastritis |
| CAG with IM: Chronic atrophic gastritis with intestinal metaplasia | ||
| CSG: Chronic superficial gastritis | ||
| GC: Gastric cancer | ||
| SIM: Severe intestinal metaplasia | ||
| WIM: Wild intestinal metaplasia | ||
| Liver | 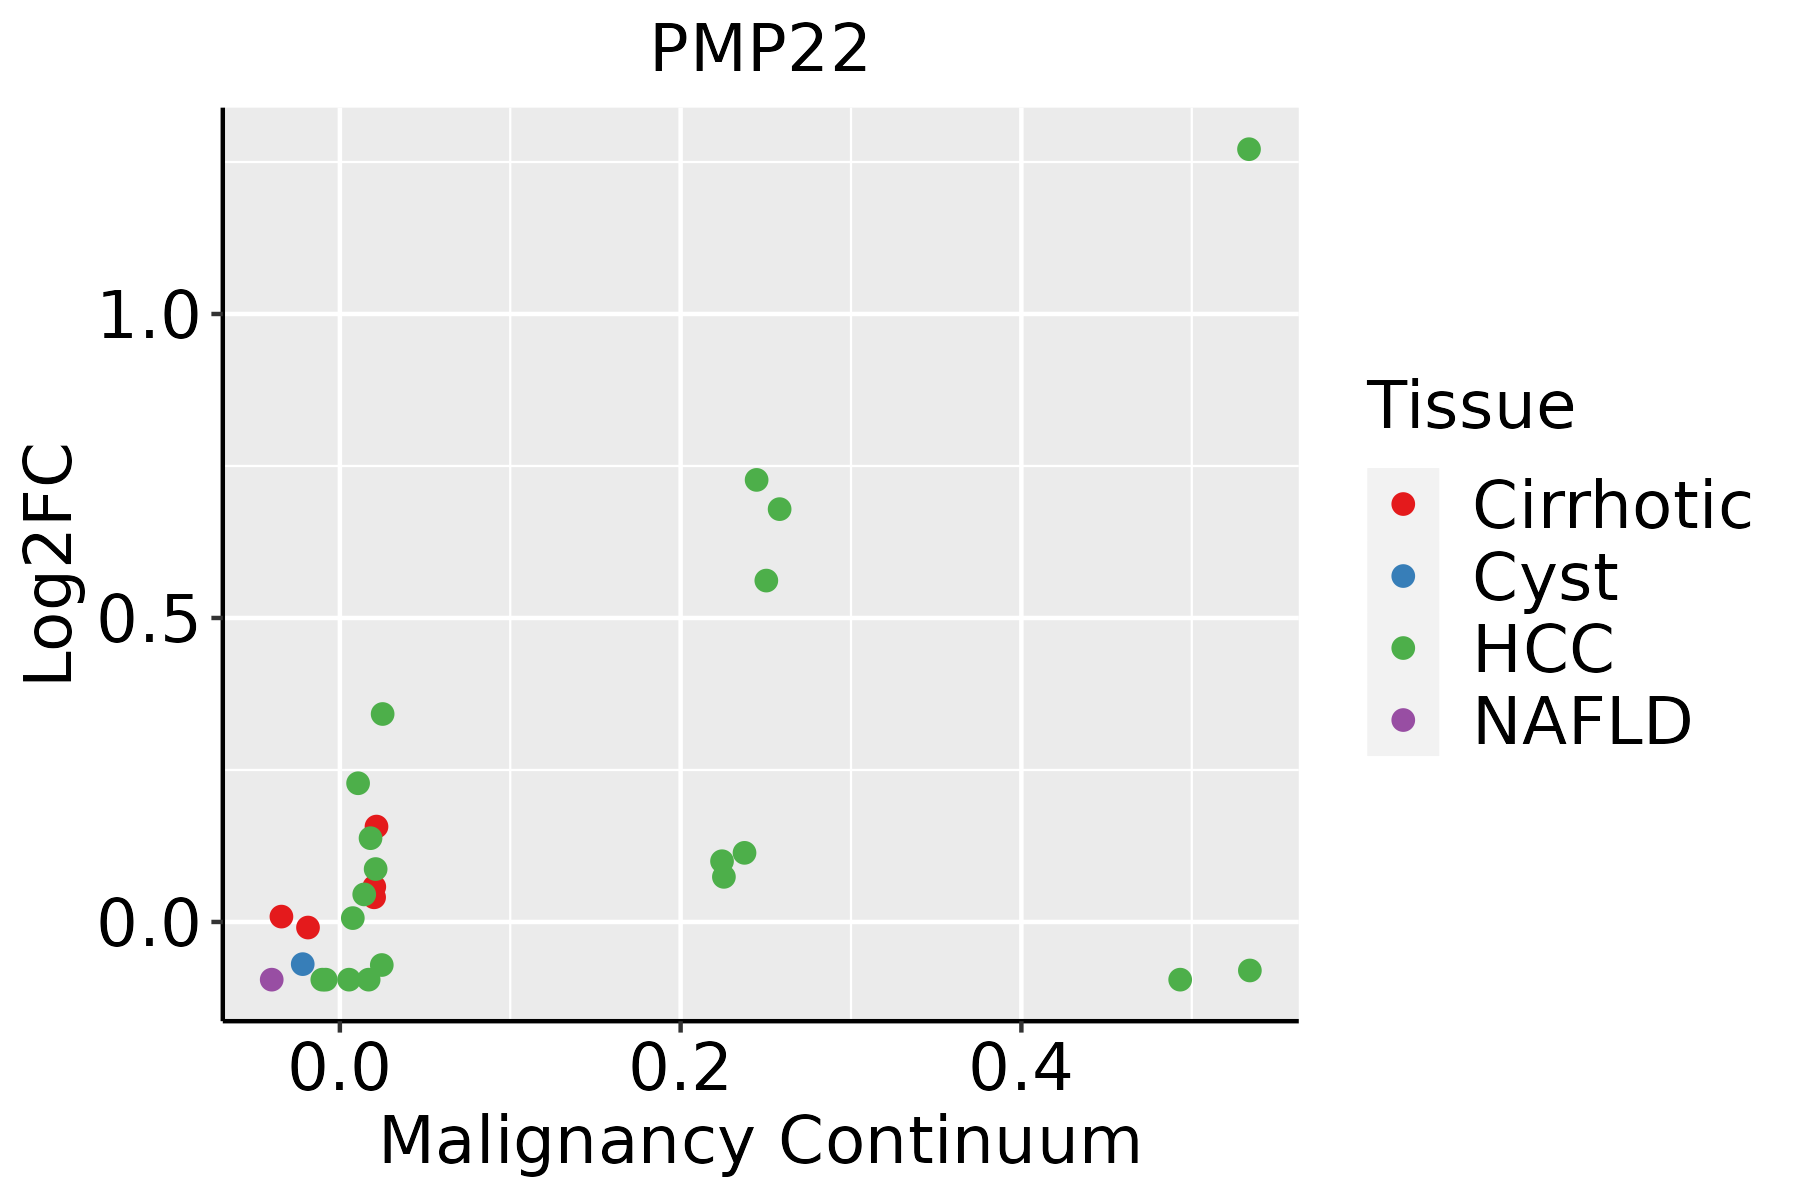 | HCC: Hepatocellular carcinoma |
| NAFLD: Non-alcoholic fatty liver disease | ||
| Oral Cavity |  | EOLP: Erosive Oral lichen planus |
| LP: leukoplakia | ||
| NEOLP: Non-erosive oral lichen planus | ||
| OSCC: Oral squamous cell carcinoma | ||
| Skin | 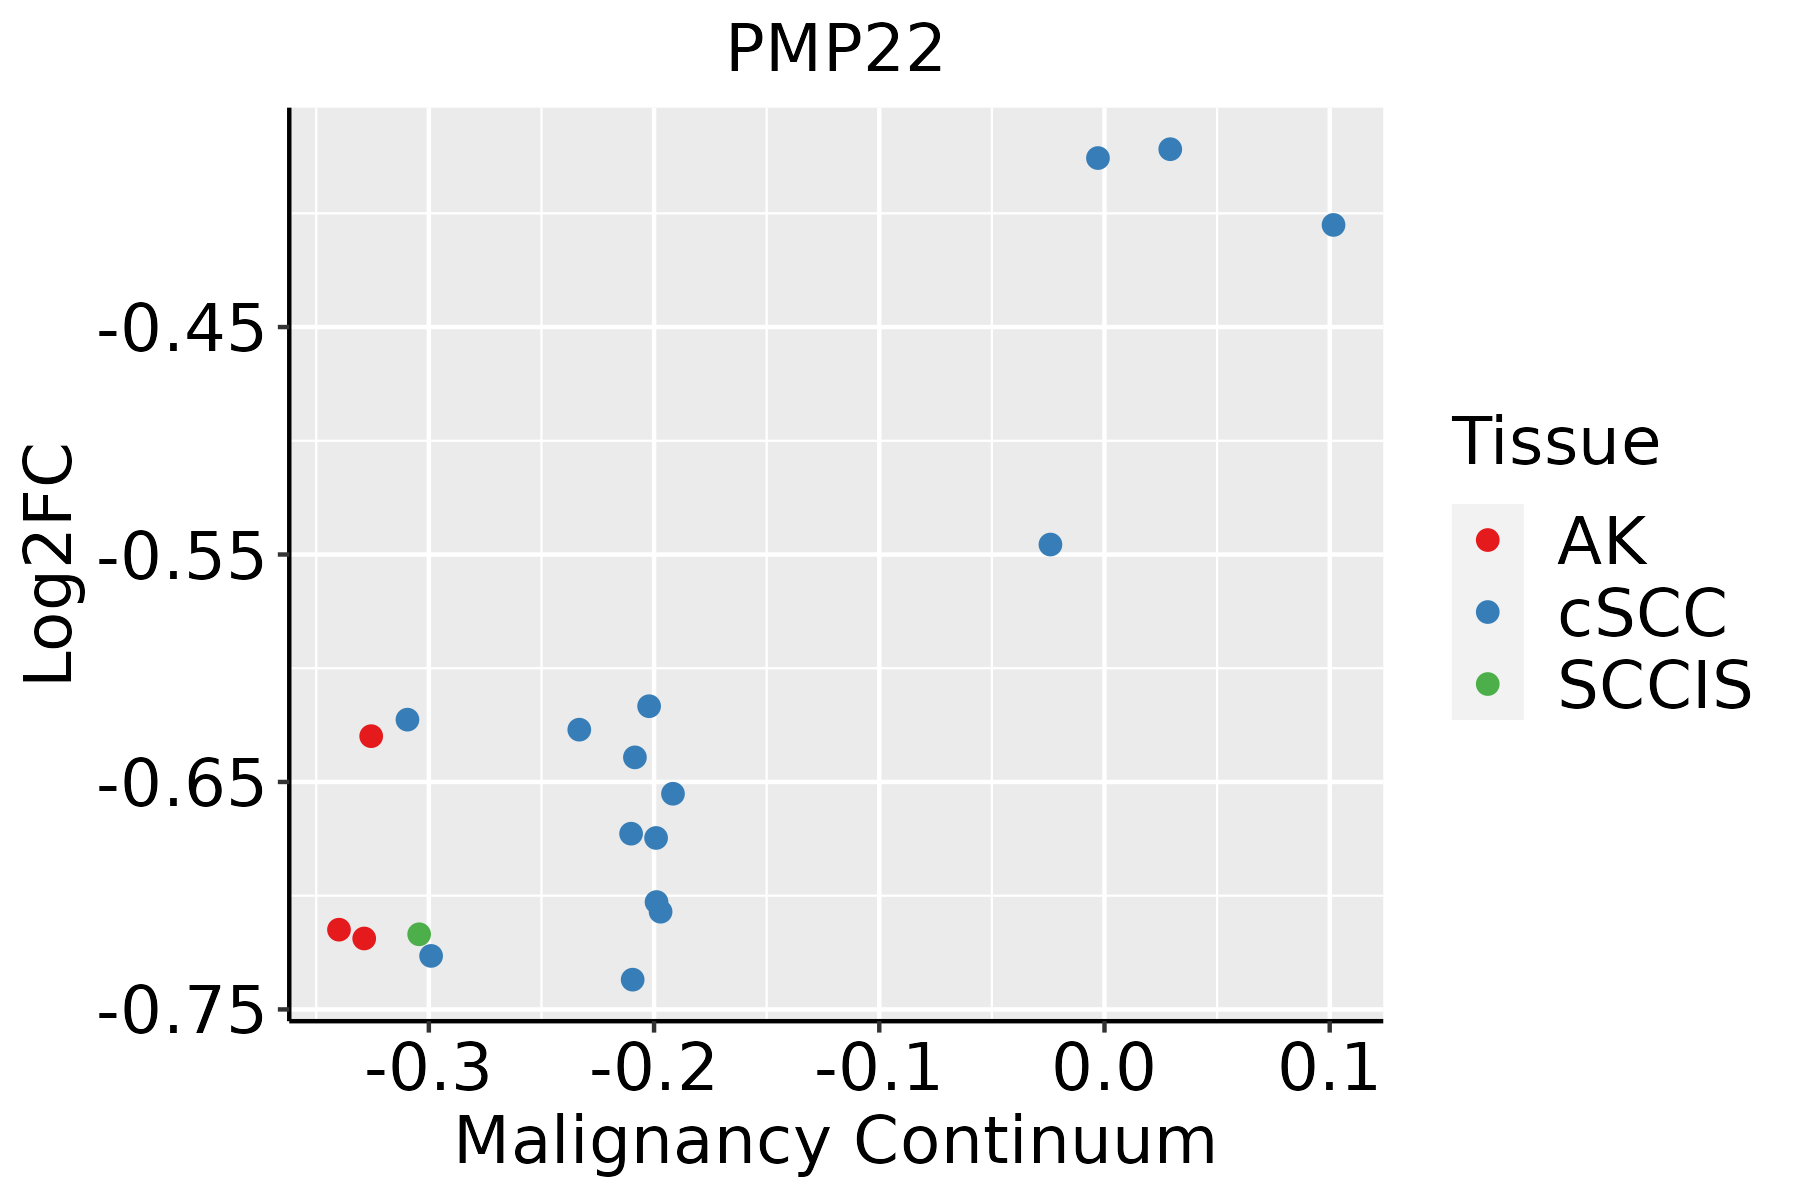 | AK: Actinic keratosis |
| cSCC: Cutaneous squamous cell carcinoma | ||
| SCCIS:squamous cell carcinoma in situ | ||
| Thyroid |  | ATC: Anaplastic thyroid cancer |
| HT: Hashimoto's thyroiditis | ||
| PTC: Papillary thyroid cancer |
| ∗log2FC in expression of this searched gene in stem-like cells from each diseased tissue sample relative to stem-like cells in normal samples in each tissue plotted against the malignancy continuum. Samples are colored based on if they are from different disease stage. |
Top |
Malignant transformation related pathway analysis |
| Find out the enriched GO biological processes and KEGG pathways involved in transition from healthy to precancer to cancer |
| Tissue | Disease Stage | Enriched GO biological Processes |
| Colorectum | AD |  |
| Colorectum | SER |  |
| Colorectum | MSS |  |
| Colorectum | MSI-H |  |
| Colorectum | FAP |  |
| ∗Top 15 enriched GO BP terms are showed in the bar plot of each disease state in each tissue. Each row represents a significant GO biological process which is colored according to the -log10(p.adjust). |
| Page: 1 2 3 4 5 6 7 8 9 |
| GO ID | Tissue | Disease Stage | Description | Gene Ratio | Bg Ratio | pvalue | p.adjust | Count |
| GO:00425524 | Esophagus | ESCC | myelination | 85/8552 | 134/18723 | 2.51e-05 | 2.13e-04 | 85 |
| GO:00072724 | Esophagus | ESCC | ensheathment of neurons | 86/8552 | 136/18723 | 2.68e-05 | 2.24e-04 | 86 |
| GO:00083664 | Esophagus | ESCC | axon ensheathment | 86/8552 | 136/18723 | 2.68e-05 | 2.24e-04 | 86 |
| GO:001097516 | Esophagus | ESCC | regulation of neuron projection development | 240/8552 | 445/18723 | 2.48e-04 | 1.53e-03 | 240 |
| GO:0042552 | Liver | Cirrhotic | myelination | 46/4634 | 134/18723 | 8.04e-03 | 3.77e-02 | 46 |
| GO:0007272 | Liver | Cirrhotic | ensheathment of neurons | 46/4634 | 136/18723 | 1.08e-02 | 4.75e-02 | 46 |
| GO:0008366 | Liver | Cirrhotic | axon ensheathment | 46/4634 | 136/18723 | 1.08e-02 | 4.75e-02 | 46 |
| GO:001097511 | Liver | HCC | regulation of neuron projection development | 220/7958 | 445/18723 | 1.68e-03 | 8.78e-03 | 220 |
| GO:00072721 | Liver | HCC | ensheathment of neurons | 72/7958 | 136/18723 | 8.87e-03 | 3.44e-02 | 72 |
| GO:00083661 | Liver | HCC | axon ensheathment | 72/7958 | 136/18723 | 8.87e-03 | 3.44e-02 | 72 |
| GO:00425521 | Liver | HCC | myelination | 71/7958 | 134/18723 | 9.08e-03 | 3.49e-02 | 71 |
| GO:001097510 | Oral cavity | OSCC | regulation of neuron projection development | 210/7305 | 445/18723 | 2.35e-04 | 1.52e-03 | 210 |
| GO:00072723 | Oral cavity | OSCC | ensheathment of neurons | 72/7305 | 136/18723 | 6.59e-04 | 3.70e-03 | 72 |
| GO:00083663 | Oral cavity | OSCC | axon ensheathment | 72/7305 | 136/18723 | 6.59e-04 | 3.70e-03 | 72 |
| GO:00425523 | Oral cavity | OSCC | myelination | 71/7305 | 134/18723 | 6.93e-04 | 3.86e-03 | 71 |
| GO:00313458 | Oral cavity | OSCC | negative regulation of cell projection organization | 89/7305 | 186/18723 | 8.51e-03 | 3.09e-02 | 89 |
| GO:001097515 | Oral cavity | EOLP | regulation of neuron projection development | 86/2218 | 445/18723 | 2.75e-06 | 6.05e-05 | 86 |
| GO:000727211 | Oral cavity | EOLP | ensheathment of neurons | 27/2218 | 136/18723 | 4.73e-03 | 2.54e-02 | 27 |
| GO:000836611 | Oral cavity | EOLP | axon ensheathment | 27/2218 | 136/18723 | 4.73e-03 | 2.54e-02 | 27 |
| GO:004255211 | Oral cavity | EOLP | myelination | 26/2218 | 134/18723 | 7.48e-03 | 3.61e-02 | 26 |
| Page: 1 2 3 |
| Pathway ID | Tissue | Disease Stage | Description | Gene Ratio | Bg Ratio | pvalue | p.adjust | qvalue | Count |
| Page: 1 |
Top |
Cell-cell communication analysis |
| Identification of potential cell-cell interactions between two cell types and their ligand-receptor pairs for different disease states |
| Ligand | Receptor | LRpair | Pathway | Tissue | Disease Stage |
| Page: 1 |
Top |
Single-cell gene regulatory network inference analysis |
| Find out the significant the regulons (TFs) and the target genes of each regulon across cell types for different disease states |
| TF | Cell Type | Tissue | Disease Stage | Target Gene | RSS | Regulon Activity |
| ∗The dot plots of a searched regulon are shown for all cell subpopulations in each disease state of each tissue based on the regulon specific score inferred using pySCENIC and by calculating the average expression. |
| Page: 1 |
Top |
Somatic mutation of malignant transformation related genes |
| Annotation of somatic variants for genes involved in malignant transformation |
| Hugo Symbol | Variant Class | Variant Classification | dbSNP RS | HGVSc | HGVSp | HGVSp Short | SWISSPROT | BIOTYPE | SIFT | PolyPhen | Tumor Sample Barcode | Tissue | Histology | Sex | Age | Stage | Therapy Types | Drugs | Outcome |
| PMP22 | SNV | Missense_Mutation | novel | c.259N>A | p.Leu87Ile | p.L87I | Q01453 | protein_coding | deleterious(0) | probably_damaging(0.998) | TCGA-FU-A3HZ-01 | Cervix | cervical & endocervical cancer | Female | <65 | I/II | Chemotherapy | cisplatin | CR |
| PMP22 | SNV | Missense_Mutation | c.249C>G | p.Phe83Leu | p.F83L | Q01453 | protein_coding | deleterious(0) | probably_damaging(0.992) | TCGA-IR-A3LH-01 | Cervix | cervical & endocervical cancer | Female | <65 | I/II | Chemotherapy | cisplatin | CR | |
| PMP22 | SNV | Missense_Mutation | c.361N>T | p.His121Tyr | p.H121Y | Q01453 | protein_coding | tolerated(0.77) | benign(0.007) | TCGA-AA-3811-01 | Colorectum | colon adenocarcinoma | Female | >=65 | III/IV | Unknown | Unknown | PD | |
| PMP22 | SNV | Missense_Mutation | c.143N>A | p.Gly48Glu | p.G48E | Q01453 | protein_coding | tolerated(0.57) | possibly_damaging(0.782) | TCGA-AZ-6598-01 | Colorectum | colon adenocarcinoma | Female | >=65 | I/II | Unknown | Unknown | SD | |
| PMP22 | SNV | Missense_Mutation | rs750000952 | c.103N>A | p.Ala35Thr | p.A35T | Q01453 | protein_coding | tolerated(0.73) | benign(0.003) | TCGA-G4-6302-01 | Colorectum | colon adenocarcinoma | Female | >=65 | I/II | Unknown | Unknown | SD |
| PMP22 | insertion | Frame_Shift_Ins | novel | c.289_290insT | p.Tyr97LeufsTer126 | p.Y97Lfs*126 | Q01453 | protein_coding | TCGA-WS-AB45-01 | Colorectum | colon adenocarcinoma | Female | <65 | I/II | Unknown | Unknown | SD | ||
| PMP22 | SNV | Missense_Mutation | c.448N>A | p.Gly150Ser | p.G150S | Q01453 | protein_coding | deleterious(0.04) | probably_damaging(1) | TCGA-A5-A0G2-01 | Endometrium | uterine corpus endometrioid carcinoma | Female | <65 | III/IV | Unknown | Unknown | SD | |
| PMP22 | SNV | Missense_Mutation | rs749165928 | c.475N>T | p.Arg159Cys | p.R159C | Q01453 | protein_coding | deleterious(0) | probably_damaging(0.997) | TCGA-AP-A051-01 | Endometrium | uterine corpus endometrioid carcinoma | Female | >=65 | I/II | Unknown | Unknown | SD |
| PMP22 | SNV | Missense_Mutation | novel | c.340N>A | p.Ala114Thr | p.A114T | Q01453 | protein_coding | deleterious(0) | probably_damaging(0.999) | TCGA-AX-A0IZ-01 | Endometrium | uterine corpus endometrioid carcinoma | Female | <65 | I/II | Unknown | Unknown | SD |
| PMP22 | SNV | Missense_Mutation | c.191C>A | p.Ser64Tyr | p.S64Y | Q01453 | protein_coding | deleterious(0) | probably_damaging(0.93) | TCGA-D1-A176-01 | Endometrium | uterine corpus endometrioid carcinoma | Female | >=65 | I/II | Unknown | Unknown | SD |
| Page: 1 2 |
Top |
Related drugs of malignant transformation related genes |
| Identification of chemicals and drugs interact with genes involved in malignant transfromation |
| (DGIdb 4.0) |
| Entrez ID | Symbol | Category | Interaction Types | Drug Claim Name | Drug Name | PMIDs |
| 5376 | PMP22 | DRUGGABLE GENOME, TRANSPORTER | PROGESTERONE | PROGESTERONE | 9751213 | |
| 5376 | PMP22 | DRUGGABLE GENOME, TRANSPORTER | KETOPROFEN | KETOPROFEN |
| Page: 1 |

Copyright 2023-Present -The University of Texas Health Science Center at Houston |