
|
|||||
|
 | |
| |
| |
| |
| |
| |
|
Gene: PML |
Gene summary for PML |
| Gene information | Species | Human | Gene symbol | PML | Gene ID | 5371 |
| Gene name | PML nuclear body scaffold | |
| Gene Alias | MYL | |
| Cytomap | 15q24.1 | |
| Gene Type | protein-coding | GO ID | GO:0000075 | UniProtAcc | P29590 |
Top |
Malignant transformation analysis |
| Identification of the aberrant gene expression in precancerous and cancerous lesions by comparing the gene expression of stem-like cells in diseased tissues with normal stem cells |
| Entrez ID | Symbol | Replicates | Species | Organ | Tissue | Adj P-value | Log2FC | Malignancy |
| 5371 | PML | LZE4T | Human | Esophagus | ESCC | 1.04e-09 | 1.61e-01 | 0.0811 |
| 5371 | PML | LZE7T | Human | Esophagus | ESCC | 3.26e-07 | 6.24e-01 | 0.0667 |
| 5371 | PML | LZE8T | Human | Esophagus | ESCC | 6.97e-08 | 2.19e-01 | 0.067 |
| 5371 | PML | LZE20T | Human | Esophagus | ESCC | 7.47e-10 | 2.99e-01 | 0.0662 |
| 5371 | PML | LZE22D1 | Human | Esophagus | HGIN | 3.84e-02 | 5.55e-03 | 0.0595 |
| 5371 | PML | LZE24D1 | Human | Esophagus | HGIN | 1.52e-02 | 3.48e-01 | 0.054 |
| 5371 | PML | LZE24T | Human | Esophagus | ESCC | 3.19e-06 | 3.12e-01 | 0.0596 |
| 5371 | PML | LZE22D3 | Human | Esophagus | HGIN | 1.14e-02 | 6.99e-01 | 0.0653 |
| 5371 | PML | LZE21T | Human | Esophagus | ESCC | 4.01e-07 | 6.37e-01 | 0.0655 |
| 5371 | PML | P1T-E | Human | Esophagus | ESCC | 7.79e-20 | 1.04e+00 | 0.0875 |
| 5371 | PML | P2T-E | Human | Esophagus | ESCC | 5.02e-34 | 8.01e-01 | 0.1177 |
| 5371 | PML | P4T-E | Human | Esophagus | ESCC | 1.26e-22 | 2.88e-01 | 0.1323 |
| 5371 | PML | P5T-E | Human | Esophagus | ESCC | 2.95e-13 | 3.19e-01 | 0.1327 |
| 5371 | PML | P8T-E | Human | Esophagus | ESCC | 1.59e-36 | 9.53e-01 | 0.0889 |
| 5371 | PML | P9T-E | Human | Esophagus | ESCC | 2.61e-26 | 6.79e-01 | 0.1131 |
| 5371 | PML | P10T-E | Human | Esophagus | ESCC | 9.89e-09 | 1.51e-01 | 0.116 |
| 5371 | PML | P11T-E | Human | Esophagus | ESCC | 1.54e-32 | 1.51e+00 | 0.1426 |
| 5371 | PML | P12T-E | Human | Esophagus | ESCC | 9.50e-15 | 3.31e-01 | 0.1122 |
| 5371 | PML | P15T-E | Human | Esophagus | ESCC | 1.36e-30 | 6.70e-01 | 0.1149 |
| 5371 | PML | P16T-E | Human | Esophagus | ESCC | 8.60e-18 | 4.39e-01 | 0.1153 |
| Page: 1 2 3 4 5 6 |
| Tissue | Expression Dynamics | Abbreviation |
| Esophagus | 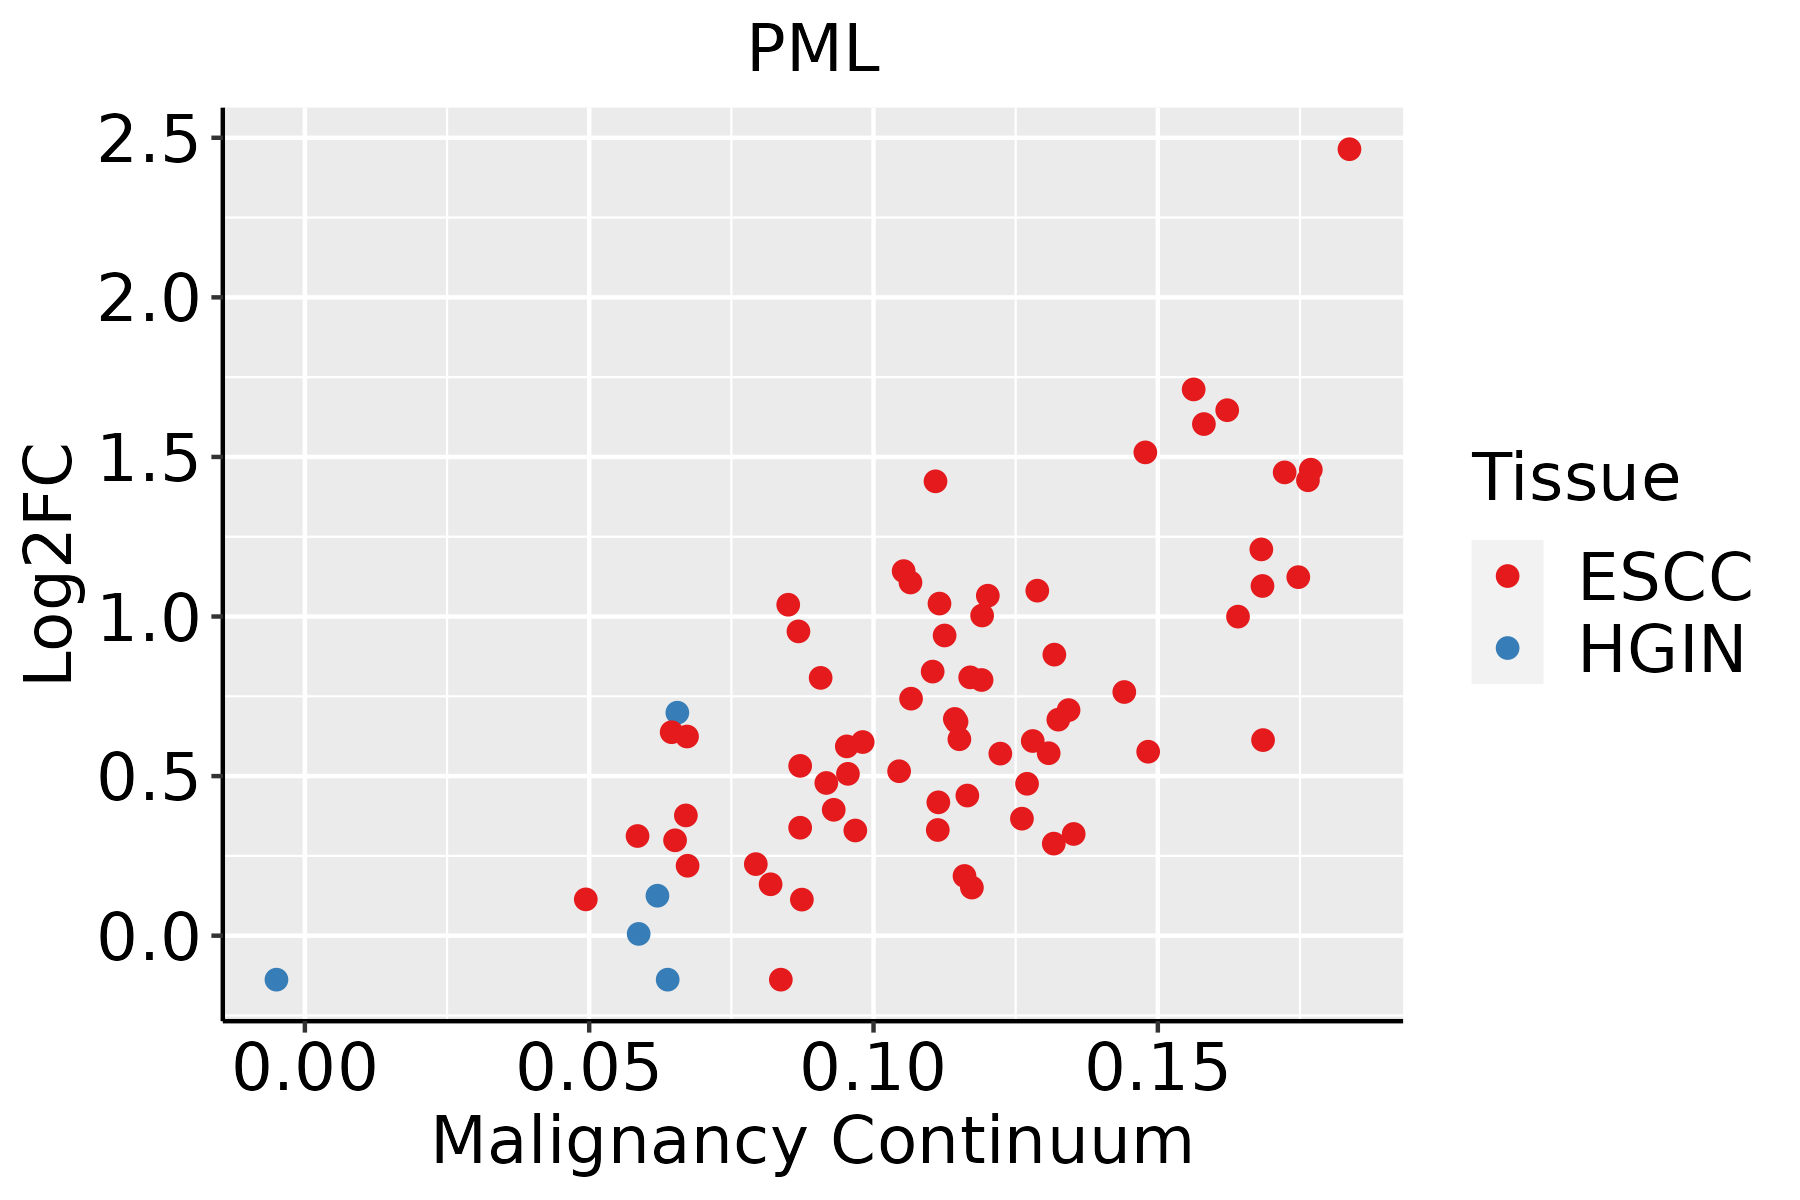 | ESCC: Esophageal squamous cell carcinoma |
| HGIN: High-grade intraepithelial neoplasias | ||
| LGIN: Low-grade intraepithelial neoplasias | ||
| Liver | 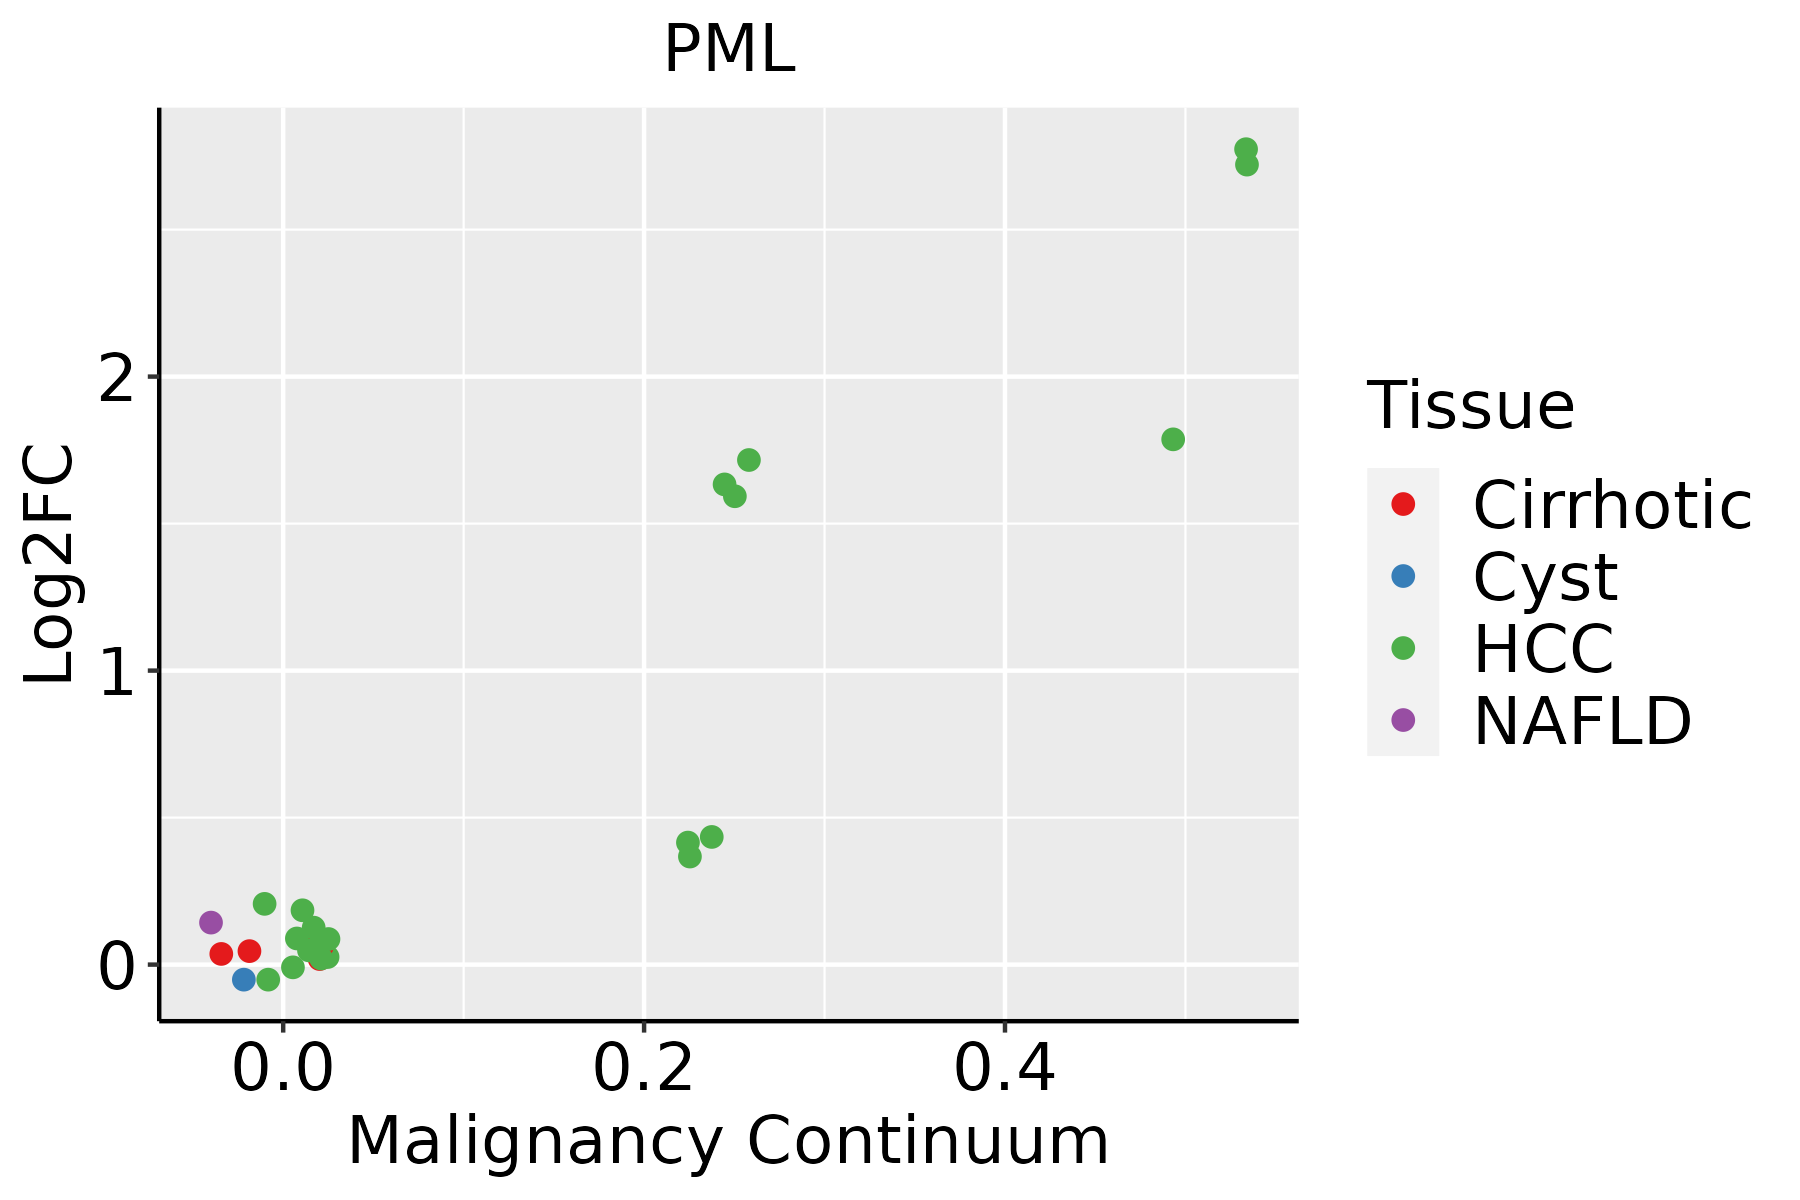 | HCC: Hepatocellular carcinoma |
| NAFLD: Non-alcoholic fatty liver disease | ||
| Oral Cavity | 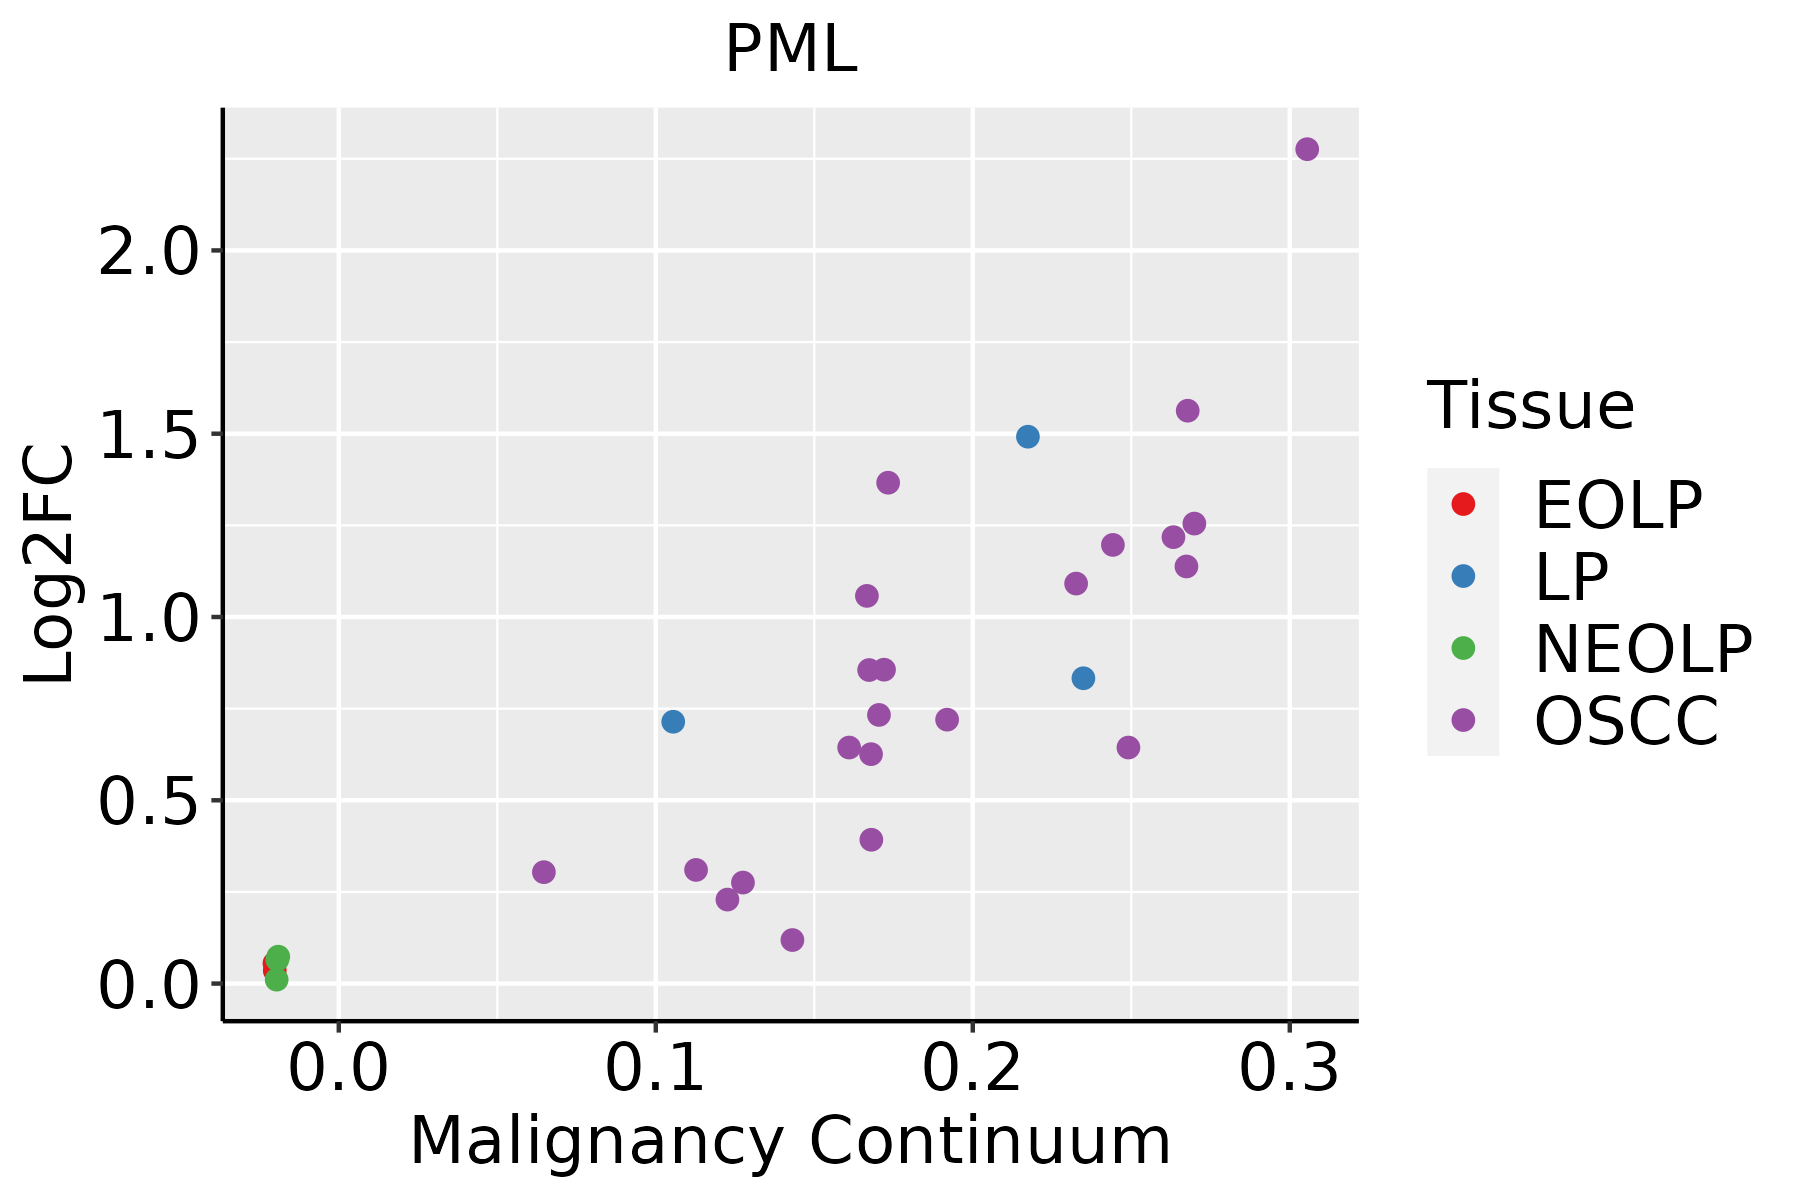 | EOLP: Erosive Oral lichen planus |
| LP: leukoplakia | ||
| NEOLP: Non-erosive oral lichen planus | ||
| OSCC: Oral squamous cell carcinoma | ||
| Skin |  | AK: Actinic keratosis |
| cSCC: Cutaneous squamous cell carcinoma | ||
| SCCIS:squamous cell carcinoma in situ | ||
| Thyroid | 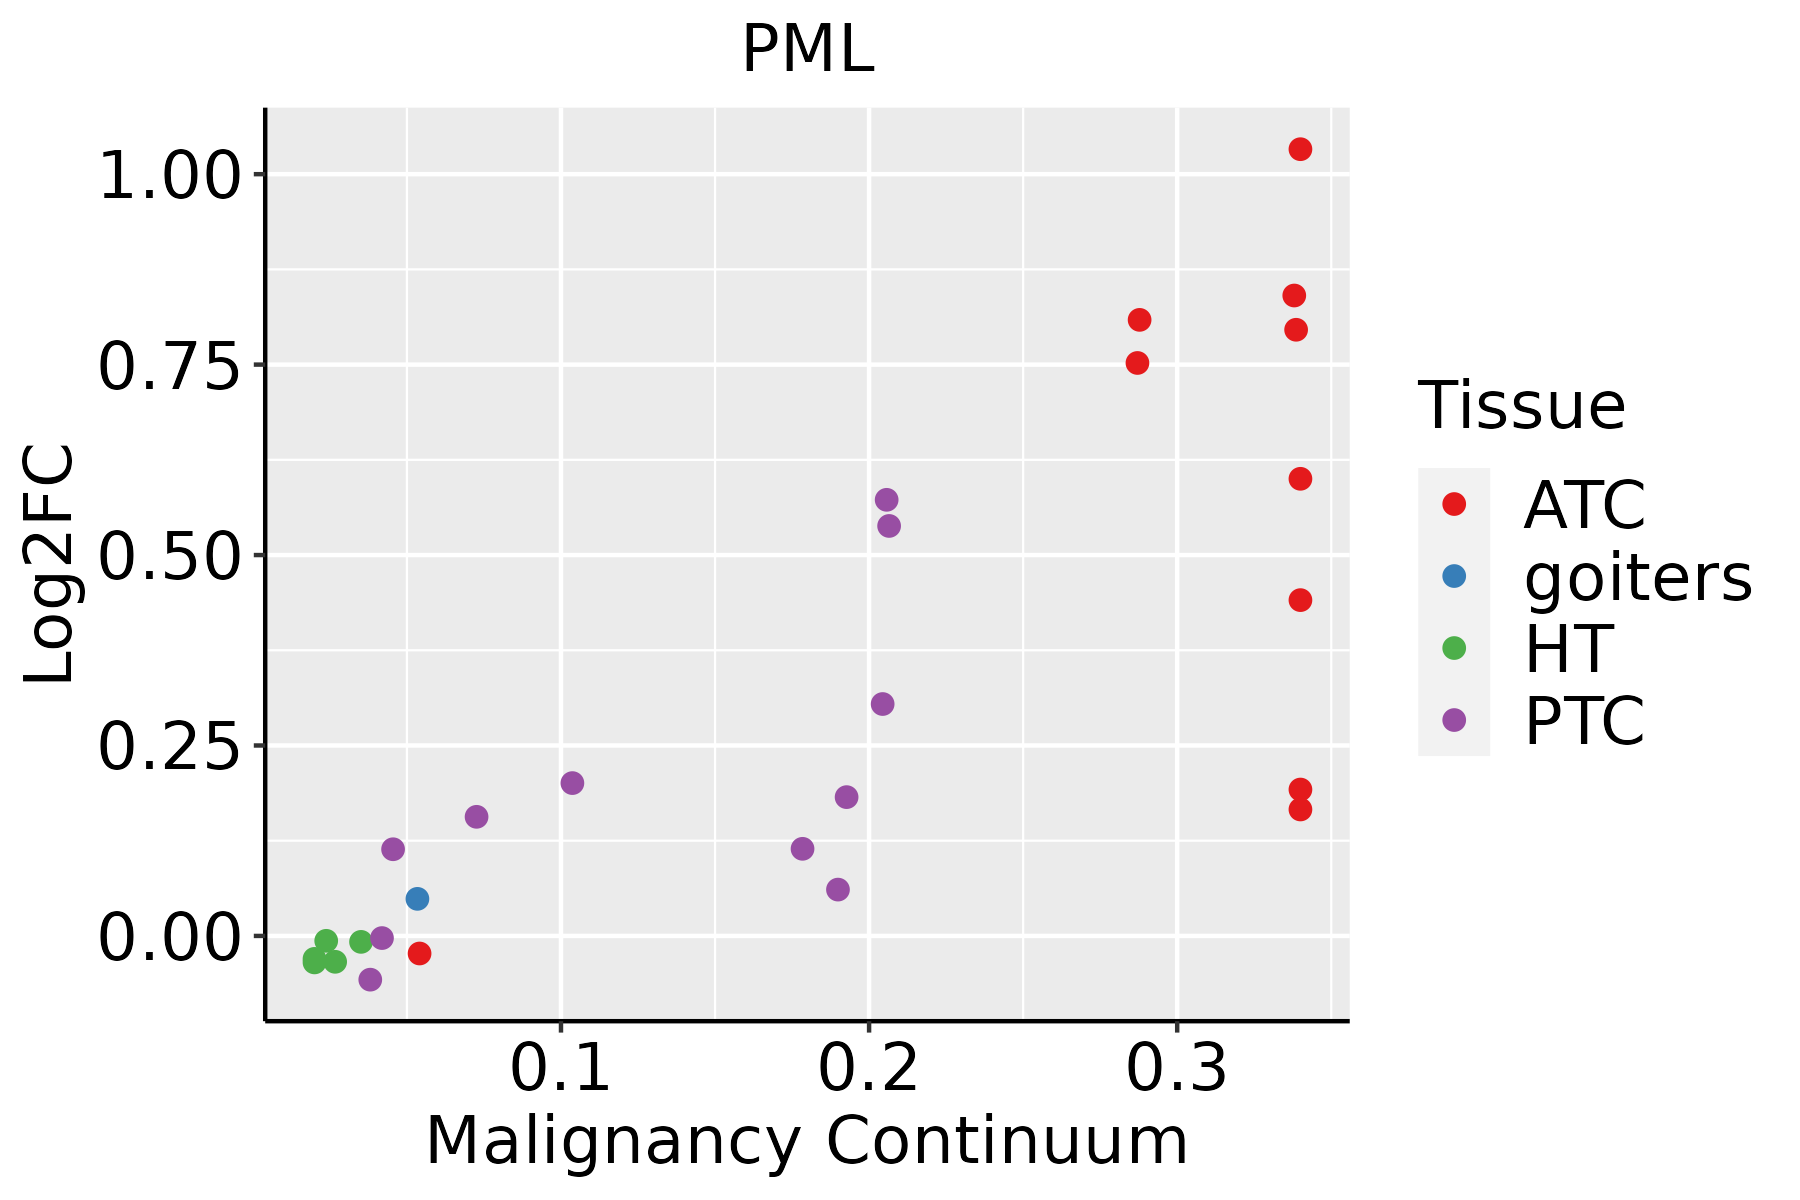 | ATC: Anaplastic thyroid cancer |
| HT: Hashimoto's thyroiditis | ||
| PTC: Papillary thyroid cancer |
| ∗log2FC in expression of this searched gene in stem-like cells from each diseased tissue sample relative to stem-like cells in normal samples in each tissue plotted against the malignancy continuum. Samples are colored based on if they are from different disease stage. |
Top |
Malignant transformation related pathway analysis |
| Find out the enriched GO biological processes and KEGG pathways involved in transition from healthy to precancer to cancer |
| Tissue | Disease Stage | Enriched GO biological Processes |
| Colorectum | AD |  |
| Colorectum | SER |  |
| Colorectum | MSS |  |
| Colorectum | MSI-H |  |
| Colorectum | FAP |  |
| ∗Top 15 enriched GO BP terms are showed in the bar plot of each disease state in each tissue. Each row represents a significant GO biological process which is colored according to the -log10(p.adjust). |
| Page: 1 2 3 4 5 6 7 8 9 |
| GO ID | Tissue | Disease Stage | Description | Gene Ratio | Bg Ratio | pvalue | p.adjust | Count |
| GO:004217627 | Esophagus | HGIN | regulation of protein catabolic process | 119/2587 | 391/18723 | 8.09e-18 | 2.43e-15 | 119 |
| GO:001049826 | Esophagus | HGIN | proteasomal protein catabolic process | 139/2587 | 490/18723 | 1.20e-17 | 3.41e-15 | 139 |
| GO:007259420 | Esophagus | HGIN | establishment of protein localization to organelle | 120/2587 | 422/18723 | 1.73e-15 | 4.00e-13 | 120 |
| GO:001603227 | Esophagus | HGIN | viral process | 118/2587 | 415/18723 | 3.01e-15 | 6.22e-13 | 118 |
| GO:009719327 | Esophagus | HGIN | intrinsic apoptotic signaling pathway | 90/2587 | 288/18723 | 1.50e-14 | 2.80e-12 | 90 |
| GO:004586227 | Esophagus | HGIN | positive regulation of proteolysis | 107/2587 | 372/18723 | 2.61e-14 | 4.60e-12 | 107 |
| GO:004316126 | Esophagus | HGIN | proteasome-mediated ubiquitin-dependent protein catabolic process | 114/2587 | 412/18723 | 7.00e-14 | 1.20e-11 | 114 |
| GO:190336227 | Esophagus | HGIN | regulation of cellular protein catabolic process | 81/2587 | 255/18723 | 1.16e-13 | 1.93e-11 | 81 |
| GO:003497625 | Esophagus | HGIN | response to endoplasmic reticulum stress | 81/2587 | 256/18723 | 1.47e-13 | 2.32e-11 | 81 |
| GO:001905827 | Esophagus | HGIN | viral life cycle | 93/2587 | 317/18723 | 3.66e-13 | 5.63e-11 | 93 |
| GO:190305027 | Esophagus | HGIN | regulation of proteolysis involved in cellular protein catabolic process | 70/2587 | 221/18723 | 6.21e-12 | 7.76e-10 | 70 |
| GO:003450417 | Esophagus | HGIN | protein localization to nucleus | 84/2587 | 290/18723 | 1.06e-11 | 1.24e-09 | 84 |
| GO:200123327 | Esophagus | HGIN | regulation of apoptotic signaling pathway | 97/2587 | 356/18723 | 1.36e-11 | 1.57e-09 | 97 |
| GO:000989520 | Esophagus | HGIN | negative regulation of catabolic process | 87/2587 | 320/18723 | 1.74e-10 | 1.68e-08 | 87 |
| GO:000691319 | Esophagus | HGIN | nucleocytoplasmic transport | 83/2587 | 301/18723 | 2.14e-10 | 1.97e-08 | 83 |
| GO:005116919 | Esophagus | HGIN | nuclear transport | 83/2587 | 301/18723 | 2.14e-10 | 1.97e-08 | 83 |
| GO:003133026 | Esophagus | HGIN | negative regulation of cellular catabolic process | 74/2587 | 262/18723 | 6.27e-10 | 5.30e-08 | 74 |
| GO:200005827 | Esophagus | HGIN | regulation of ubiquitin-dependent protein catabolic process | 53/2587 | 164/18723 | 9.89e-10 | 8.13e-08 | 53 |
| GO:000697927 | Esophagus | HGIN | response to oxidative stress | 107/2587 | 446/18723 | 3.91e-09 | 2.76e-07 | 107 |
| GO:005079225 | Esophagus | HGIN | regulation of viral process | 50/2587 | 164/18723 | 2.53e-08 | 1.49e-06 | 50 |
| Page: 1 2 3 4 5 6 7 8 9 10 11 12 13 14 15 16 17 18 19 20 21 22 23 24 25 26 27 28 29 30 31 32 33 34 35 36 37 38 39 40 41 42 43 44 45 46 47 48 49 50 51 52 53 54 55 56 57 58 59 60 61 62 63 64 65 66 67 68 |
| Pathway ID | Tissue | Disease Stage | Description | Gene Ratio | Bg Ratio | pvalue | p.adjust | qvalue | Count |
| hsa0414429 | Esophagus | HGIN | Endocytosis | 76/1383 | 251/8465 | 1.74e-08 | 3.34e-07 | 2.65e-07 | 76 |
| hsa0412026 | Esophagus | HGIN | Ubiquitin mediated proteolysis | 49/1383 | 142/8465 | 7.78e-08 | 1.33e-06 | 1.06e-06 | 49 |
| hsa0516420 | Esophagus | HGIN | Influenza A | 42/1383 | 171/8465 | 3.41e-03 | 2.54e-02 | 2.02e-02 | 42 |
| hsa04144113 | Esophagus | HGIN | Endocytosis | 76/1383 | 251/8465 | 1.74e-08 | 3.34e-07 | 2.65e-07 | 76 |
| hsa04120111 | Esophagus | HGIN | Ubiquitin mediated proteolysis | 49/1383 | 142/8465 | 7.78e-08 | 1.33e-06 | 1.06e-06 | 49 |
| hsa05164110 | Esophagus | HGIN | Influenza A | 42/1383 | 171/8465 | 3.41e-03 | 2.54e-02 | 2.02e-02 | 42 |
| hsa0412027 | Esophagus | ESCC | Ubiquitin mediated proteolysis | 122/4205 | 142/8465 | 6.53e-20 | 7.29e-18 | 3.74e-18 | 122 |
| hsa04144210 | Esophagus | ESCC | Endocytosis | 186/4205 | 251/8465 | 9.74e-16 | 4.66e-14 | 2.39e-14 | 186 |
| hsa0516425 | Esophagus | ESCC | Influenza A | 122/4205 | 171/8465 | 5.01e-09 | 4.79e-08 | 2.45e-08 | 122 |
| hsa052215 | Esophagus | ESCC | Acute myeloid leukemia | 49/4205 | 67/8465 | 7.43e-05 | 3.07e-04 | 1.57e-04 | 49 |
| hsa052028 | Esophagus | ESCC | Transcriptional misregulation in cancer | 116/4205 | 193/8465 | 2.08e-03 | 5.95e-03 | 3.05e-03 | 116 |
| hsa0412036 | Esophagus | ESCC | Ubiquitin mediated proteolysis | 122/4205 | 142/8465 | 6.53e-20 | 7.29e-18 | 3.74e-18 | 122 |
| hsa0414437 | Esophagus | ESCC | Endocytosis | 186/4205 | 251/8465 | 9.74e-16 | 4.66e-14 | 2.39e-14 | 186 |
| hsa0516435 | Esophagus | ESCC | Influenza A | 122/4205 | 171/8465 | 5.01e-09 | 4.79e-08 | 2.45e-08 | 122 |
| hsa0522113 | Esophagus | ESCC | Acute myeloid leukemia | 49/4205 | 67/8465 | 7.43e-05 | 3.07e-04 | 1.57e-04 | 49 |
| hsa0520213 | Esophagus | ESCC | Transcriptional misregulation in cancer | 116/4205 | 193/8465 | 2.08e-03 | 5.95e-03 | 3.05e-03 | 116 |
| hsa0414412 | Liver | Cirrhotic | Endocytosis | 119/2530 | 251/8465 | 2.33e-09 | 4.56e-08 | 2.81e-08 | 119 |
| hsa0412021 | Liver | Cirrhotic | Ubiquitin mediated proteolysis | 72/2530 | 142/8465 | 1.32e-07 | 1.97e-06 | 1.21e-06 | 72 |
| hsa0516410 | Liver | Cirrhotic | Influenza A | 66/2530 | 171/8465 | 8.56e-03 | 2.91e-02 | 1.79e-02 | 66 |
| hsa0414413 | Liver | Cirrhotic | Endocytosis | 119/2530 | 251/8465 | 2.33e-09 | 4.56e-08 | 2.81e-08 | 119 |
| Page: 1 2 3 |
Top |
Cell-cell communication analysis |
| Identification of potential cell-cell interactions between two cell types and their ligand-receptor pairs for different disease states |
| Ligand | Receptor | LRpair | Pathway | Tissue | Disease Stage |
| Page: 1 |
Top |
Single-cell gene regulatory network inference analysis |
| Find out the significant the regulons (TFs) and the target genes of each regulon across cell types for different disease states |
| TF | Cell Type | Tissue | Disease Stage | Target Gene | RSS | Regulon Activity |
| PML | PMC | Stomach | ADJ | APOL1,MUC1,RNF213, etc. | 3.30e-01 |  |
| PML | PMC | Stomach | WIM | APOL1,MUC1,RNF213, etc. | 5.86e-01 |  |
| ∗The dot plots of a searched regulon are shown for all cell subpopulations in each disease state of each tissue based on the regulon specific score inferred using pySCENIC and by calculating the average expression. |
| Page: 1 |
Top |
Somatic mutation of malignant transformation related genes |
| Annotation of somatic variants for genes involved in malignant transformation |
| Hugo Symbol | Variant Class | Variant Classification | dbSNP RS | HGVSc | HGVSp | HGVSp Short | SWISSPROT | BIOTYPE | SIFT | PolyPhen | Tumor Sample Barcode | Tissue | Histology | Sex | Age | Stage | Therapy Types | Drugs | Outcome |
| PML | SNV | Missense_Mutation | novel | c.1022C>T | p.Ser341Leu | p.S341L | P29590 | protein_coding | deleterious(0.03) | probably_damaging(0.983) | TCGA-A2-A0EY-01 | Breast | breast invasive carcinoma | Female | <65 | I/II | Chemotherapy | adriamycin | SD |
| PML | SNV | Missense_Mutation | c.1228N>G | p.Pro410Ala | p.P410A | P29590 | protein_coding | tolerated(0.06) | probably_damaging(0.95) | TCGA-D8-A1JA-01 | Breast | breast invasive carcinoma | Female | <65 | III/IV | Chemotherapy | adriamycin | PD | |
| PML | deletion | Frame_Shift_Del | c.208delN | p.Leu70CysfsTer28 | p.L70Cfs*28 | P29590 | protein_coding | TCGA-EW-A2FV-01 | Breast | breast invasive carcinoma | Female | <65 | III/IV | Chemotherapy | docetaxel | SD | |||
| PML | SNV | Missense_Mutation | rs769540520 | c.2221N>T | p.Arg741Cys | p.R741C | P29590 | protein_coding | deleterious(0.03) | benign(0.003) | TCGA-2W-A8YY-01 | Cervix | cervical & endocervical cancer | Female | <65 | I/II | Chemotherapy | cisplatin | CR |
| PML | SNV | Missense_Mutation | rs765869727 | c.973C>T | p.Arg325Cys | p.R325C | P29590 | protein_coding | deleterious(0) | probably_damaging(0.999) | TCGA-C5-A1M5-01 | Cervix | cervical & endocervical cancer | Female | <65 | I/II | Unknown | Unknown | PD |
| PML | SNV | Missense_Mutation | c.895G>C | p.Glu299Gln | p.E299Q | P29590 | protein_coding | tolerated(0.23) | benign(0.3) | TCGA-DR-A0ZM-01 | Cervix | cervical & endocervical cancer | Female | <65 | III/IV | Unspecific | Cisplatin | SD | |
| PML | SNV | Missense_Mutation | c.1702N>A | p.Glu568Lys | p.E568K | P29590 | protein_coding | deleterious(0) | probably_damaging(0.976) | TCGA-EA-A97N-01 | Cervix | cervical & endocervical cancer | Female | <65 | I/II | Unknown | Unknown | SD | |
| PML | SNV | Missense_Mutation | c.502N>A | p.Glu168Lys | p.E168K | P29590 | protein_coding | deleterious(0) | possibly_damaging(0.606) | TCGA-JX-A3Q0-01 | Cervix | cervical & endocervical cancer | Female | <65 | III/IV | Unknown | Unknown | SD | |
| PML | SNV | Missense_Mutation | novel | c.1015N>A | p.Tyr339Asn | p.Y339N | P29590 | protein_coding | deleterious(0) | probably_damaging(0.999) | TCGA-MA-AA43-01 | Cervix | cervical & endocervical cancer | Female | <65 | III/IV | Unknown | Unknown | SD |
| PML | SNV | Missense_Mutation | rs745678082 | c.2218N>A | p.Glu740Lys | p.E740K | P29590 | protein_coding | tolerated(0.2) | benign(0.007) | TCGA-MY-A5BD-01 | Cervix | cervical & endocervical cancer | Female | <65 | I/II | Chemotherapy | cisplatin | CR |
| Page: 1 2 3 4 5 6 7 8 |
Top |
Related drugs of malignant transformation related genes |
| Identification of chemicals and drugs interact with genes involved in malignant transfromation |
| (DGIdb 4.0) |
| Entrez ID | Symbol | Category | Interaction Types | Drug Claim Name | Drug Name | PMIDs |
| 5371 | PML | CLINICALLY ACTIONABLE, TRANSCRIPTION FACTOR, DRUG RESISTANCE | GEMTUZUMAB OZOGAMICIN | 15187030 | ||
| 5371 | PML | CLINICALLY ACTIONABLE, TRANSCRIPTION FACTOR, DRUG RESISTANCE | TRETINOIN | TRETINOIN | 21505136,8674046,21613260,23670176,11704842,30289902 | |
| 5371 | PML | CLINICALLY ACTIONABLE, TRANSCRIPTION FACTOR, DRUG RESISTANCE | arsenic trioxide | 24433361 | ||
| 5371 | PML | CLINICALLY ACTIONABLE, TRANSCRIPTION FACTOR, DRUG RESISTANCE | tretinoin | TRETINOIN | ||
| 5371 | PML | CLINICALLY ACTIONABLE, TRANSCRIPTION FACTOR, DRUG RESISTANCE | TAMIBAROTENE | TAMIBAROTENE | 30289902 | |
| 5371 | PML | CLINICALLY ACTIONABLE, TRANSCRIPTION FACTOR, DRUG RESISTANCE | TAZAROTENE | TAZAROTENE | 16939905 | |
| 5371 | PML | CLINICALLY ACTIONABLE, TRANSCRIPTION FACTOR, DRUG RESISTANCE | Tretinoin | TRETINOIN | ||
| 5371 | PML | CLINICALLY ACTIONABLE, TRANSCRIPTION FACTOR, DRUG RESISTANCE | ARSENIC TRIOXIDE | 26537301,11704842 |
| Page: 1 |

Copyright 2023-Present -The University of Texas Health Science Center at Houston |