
|
|||||
|
 | |
| |
| |
| |
| |
| |
|
Gene: PLXNC1 |
Gene summary for PLXNC1 |
| Gene information | Species | Human | Gene symbol | PLXNC1 | Gene ID | 10154 |
| Gene name | plexin C1 | |
| Gene Alias | CD232 | |
| Cytomap | 12q22 | |
| Gene Type | protein-coding | GO ID | GO:0000902 | UniProtAcc | O60486 |
Top |
Malignant transformation analysis |
| Identification of the aberrant gene expression in precancerous and cancerous lesions by comparing the gene expression of stem-like cells in diseased tissues with normal stem cells |
| Entrez ID | Symbol | Replicates | Species | Organ | Tissue | Adj P-value | Log2FC | Malignancy |
| 10154 | PLXNC1 | NAFLD1 | Human | Liver | NAFLD | 1.16e-02 | 3.77e-01 | -0.04 |
| 10154 | PLXNC1 | HCC1_Meng | Human | Liver | HCC | 6.20e-07 | 1.67e-02 | 0.0246 |
| 10154 | PLXNC1 | HCC2 | Human | Liver | HCC | 6.95e-10 | 1.97e+00 | 0.5341 |
| 10154 | PLXNC1 | S014 | Human | Liver | HCC | 9.66e-12 | 4.11e-01 | 0.2254 |
| 10154 | PLXNC1 | S015 | Human | Liver | HCC | 3.78e-11 | 5.51e-01 | 0.2375 |
| 10154 | PLXNC1 | S016 | Human | Liver | HCC | 1.97e-12 | 3.94e-01 | 0.2243 |
| 10154 | PLXNC1 | HTA12-23-1 | Human | Pancreas | PDAC | 8.83e-07 | 5.46e-01 | 0.3405 |
| 10154 | PLXNC1 | HTA12-25-1 | Human | Pancreas | PDAC | 3.33e-07 | 4.77e-01 | 0.313 |
| 10154 | PLXNC1 | HTA12-26-1 | Human | Pancreas | PDAC | 6.68e-09 | 4.55e-01 | 0.3728 |
| 10154 | PLXNC1 | HTA12-29-1 | Human | Pancreas | PDAC | 1.17e-22 | 5.16e-01 | 0.3722 |
| 10154 | PLXNC1 | HTA12-32-1 | Human | Pancreas | PDAC | 1.46e-03 | 8.62e-01 | 0.3624 |
| 10154 | PLXNC1 | male-WTA | Human | Thyroid | PTC | 2.90e-24 | 2.66e-01 | 0.1037 |
| 10154 | PLXNC1 | female-WTA | Human | Thyroid | PTC | 4.92e-03 | 2.76e-01 | 0.0726 |
| 10154 | PLXNC1 | PTC01 | Human | Thyroid | PTC | 1.13e-11 | 2.64e-01 | 0.1899 |
| 10154 | PLXNC1 | PTC04 | Human | Thyroid | PTC | 3.90e-05 | 1.69e-01 | 0.1927 |
| 10154 | PLXNC1 | PTC05 | Human | Thyroid | PTC | 6.16e-17 | 6.86e-01 | 0.2065 |
| 10154 | PLXNC1 | PTC06 | Human | Thyroid | PTC | 2.00e-32 | 6.79e-01 | 0.2057 |
| 10154 | PLXNC1 | PTC07 | Human | Thyroid | PTC | 2.31e-21 | 5.36e-01 | 0.2044 |
| 10154 | PLXNC1 | ATC12 | Human | Thyroid | ATC | 2.86e-04 | 2.28e-01 | 0.34 |
| 10154 | PLXNC1 | ATC13 | Human | Thyroid | ATC | 2.85e-04 | 1.17e-01 | 0.34 |
| Page: 1 2 |
| Tissue | Expression Dynamics | Abbreviation |
| Liver | 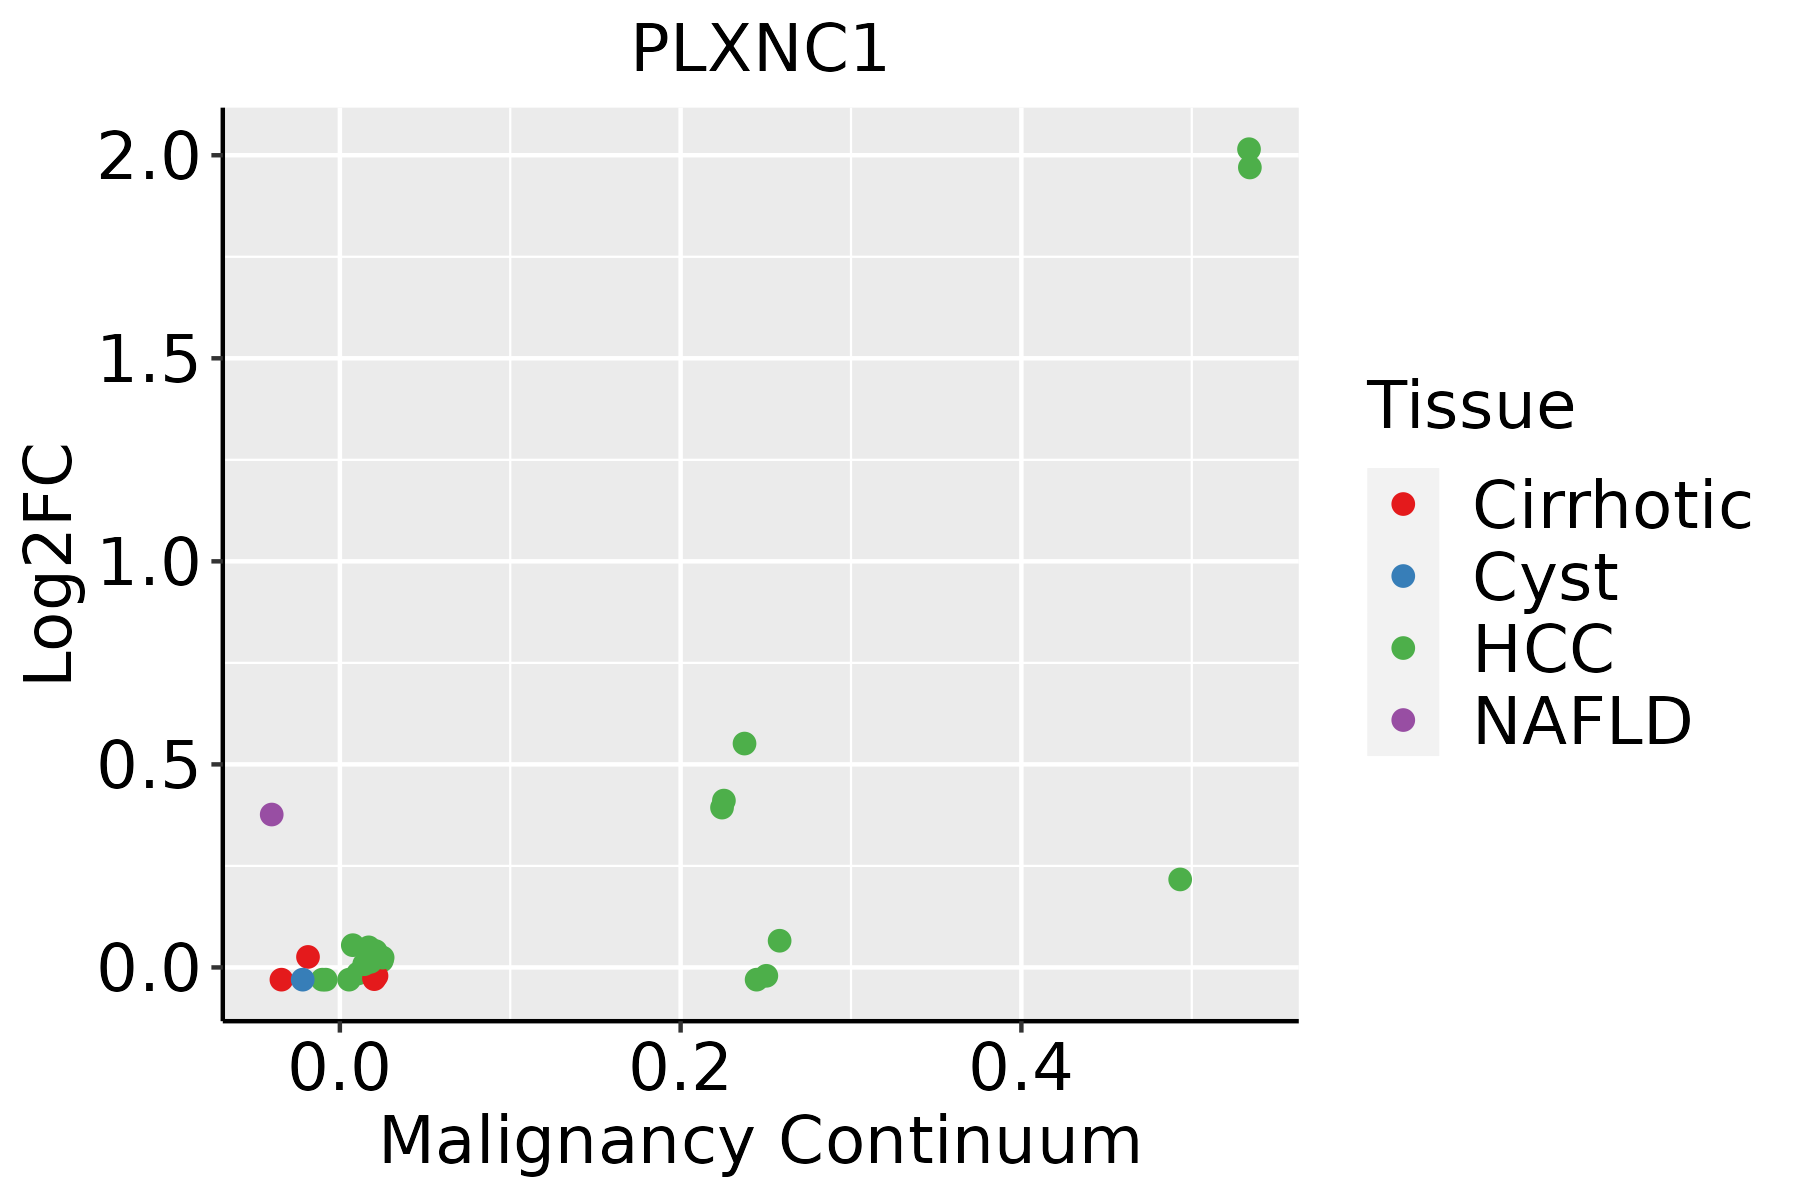 | HCC: Hepatocellular carcinoma |
| NAFLD: Non-alcoholic fatty liver disease | ||
| Thyroid | 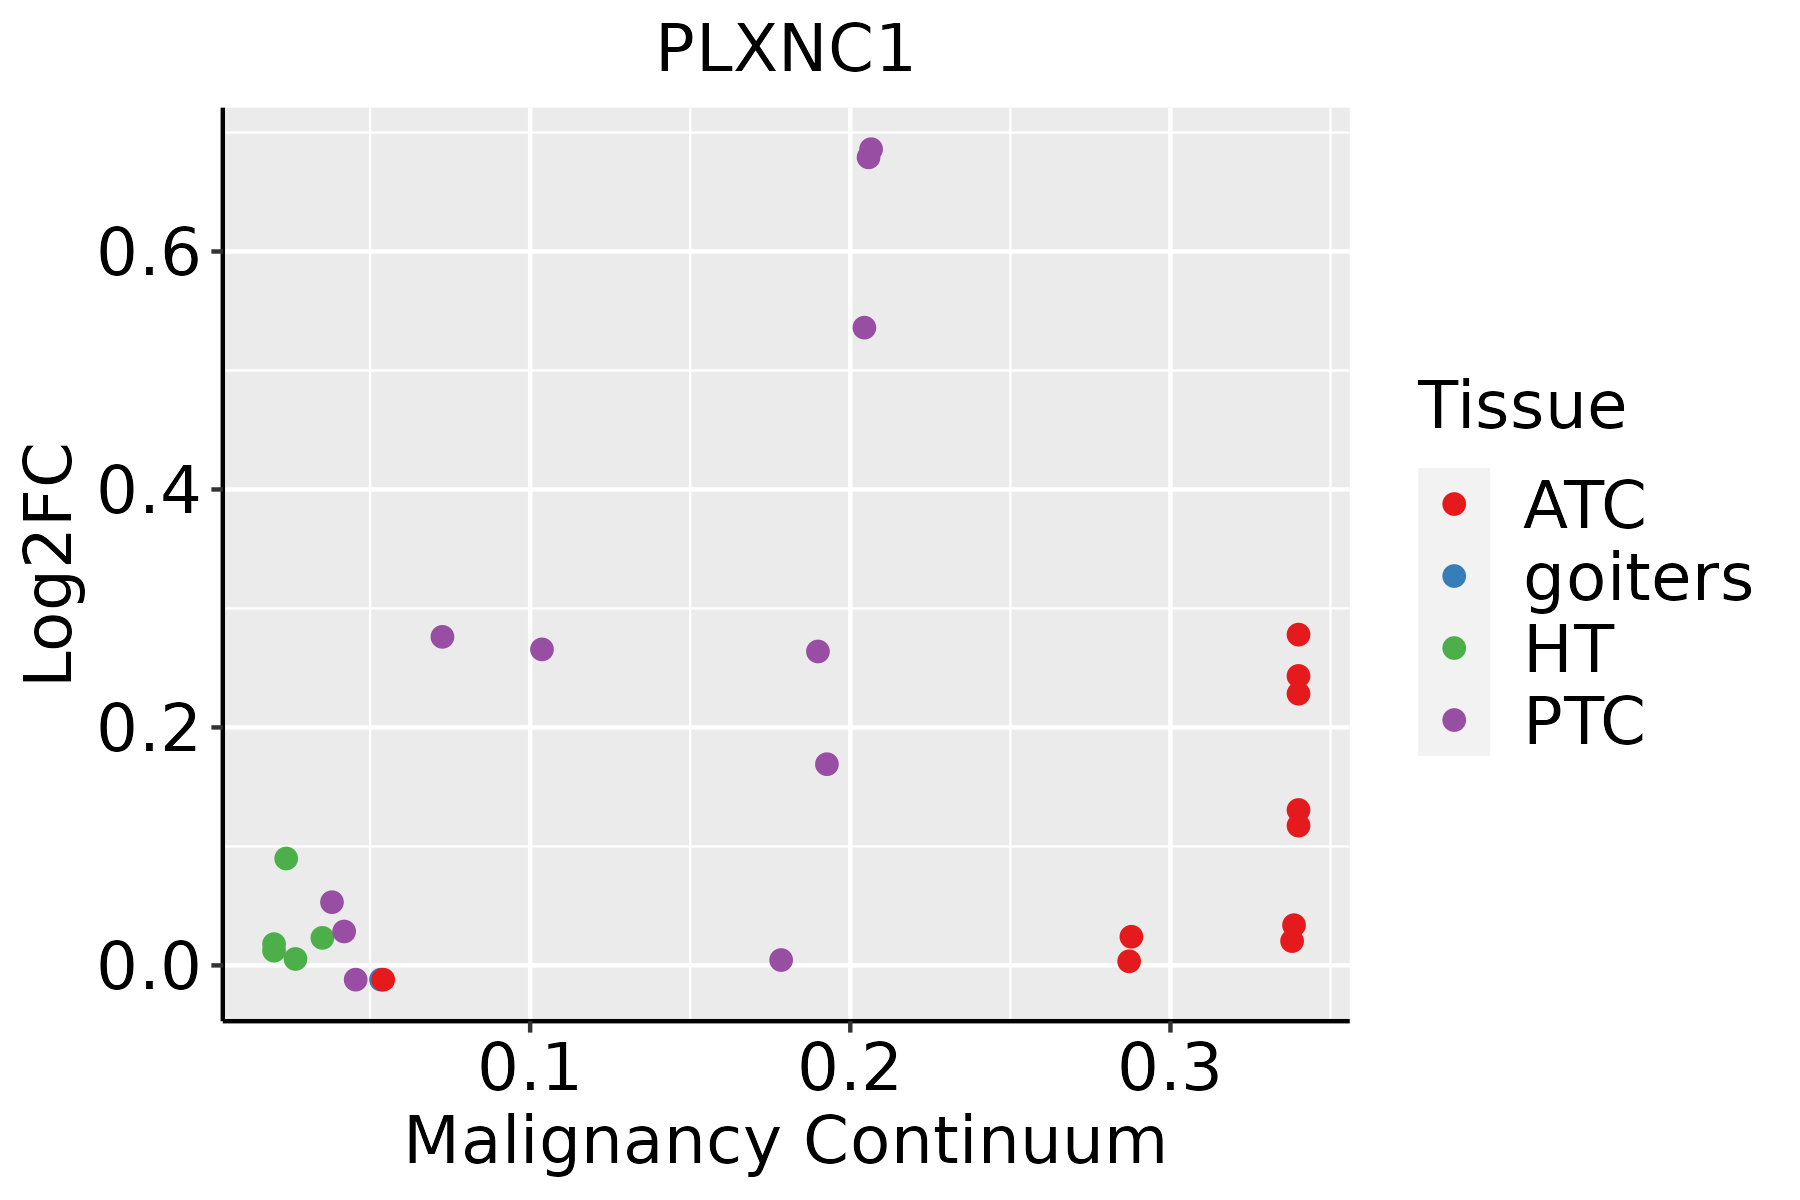 | ATC: Anaplastic thyroid cancer |
| HT: Hashimoto's thyroiditis | ||
| PTC: Papillary thyroid cancer |
| ∗log2FC in expression of this searched gene in stem-like cells from each diseased tissue sample relative to stem-like cells in normal samples in each tissue plotted against the malignancy continuum. Samples are colored based on if they are from different disease stage. |
Top |
Malignant transformation related pathway analysis |
| Find out the enriched GO biological processes and KEGG pathways involved in transition from healthy to precancer to cancer |
| Tissue | Disease Stage | Enriched GO biological Processes |
| Colorectum | AD |  |
| Colorectum | SER |  |
| Colorectum | MSS |  |
| Colorectum | MSI-H |  |
| Colorectum | FAP |  |
| ∗Top 15 enriched GO BP terms are showed in the bar plot of each disease state in each tissue. Each row represents a significant GO biological process which is colored according to the -log10(p.adjust). |
| Page: 1 2 3 4 5 6 7 8 9 |
| GO ID | Tissue | Disease Stage | Description | Gene Ratio | Bg Ratio | pvalue | p.adjust | Count |
| GO:00226047 | Liver | NAFLD | regulation of cell morphogenesis | 62/1882 | 309/18723 | 8.35e-08 | 7.09e-06 | 62 |
| GO:00430875 | Liver | NAFLD | regulation of GTPase activity | 62/1882 | 348/18723 | 5.65e-06 | 2.03e-04 | 62 |
| GO:00313465 | Liver | NAFLD | positive regulation of cell projection organization | 57/1882 | 353/18723 | 2.19e-04 | 3.73e-03 | 57 |
| GO:00109755 | Liver | NAFLD | regulation of neuron projection development | 64/1882 | 445/18723 | 2.12e-03 | 2.08e-02 | 64 |
| GO:00083606 | Liver | NAFLD | regulation of cell shape | 27/1882 | 154/18723 | 2.92e-03 | 2.65e-02 | 27 |
| GO:00615645 | Liver | NAFLD | axon development | 64/1882 | 467/18723 | 6.48e-03 | 4.69e-02 | 64 |
| GO:00074095 | Liver | NAFLD | axonogenesis | 58/1882 | 418/18723 | 7.16e-03 | 4.96e-02 | 58 |
| GO:002260422 | Liver | HCC | regulation of cell morphogenesis | 188/7958 | 309/18723 | 4.84e-11 | 1.82e-09 | 188 |
| GO:003134611 | Liver | HCC | positive regulation of cell projection organization | 193/7958 | 353/18723 | 2.28e-06 | 3.08e-05 | 193 |
| GO:000836022 | Liver | HCC | regulation of cell shape | 92/7958 | 154/18723 | 1.15e-05 | 1.31e-04 | 92 |
| GO:001072011 | Liver | HCC | positive regulation of cell development | 155/7958 | 298/18723 | 5.39e-04 | 3.48e-03 | 155 |
| GO:001097511 | Liver | HCC | regulation of neuron projection development | 220/7958 | 445/18723 | 1.68e-03 | 8.78e-03 | 220 |
| GO:00507674 | Liver | HCC | regulation of neurogenesis | 181/7958 | 364/18723 | 3.00e-03 | 1.40e-02 | 181 |
| GO:00507693 | Liver | HCC | positive regulation of neurogenesis | 116/7958 | 225/18723 | 3.67e-03 | 1.63e-02 | 116 |
| GO:0022604112 | Thyroid | PTC | regulation of cell morphogenesis | 165/5968 | 309/18723 | 2.60e-15 | 1.82e-13 | 165 |
| GO:0031346110 | Thyroid | PTC | positive regulation of cell projection organization | 173/5968 | 353/18723 | 1.09e-11 | 4.40e-10 | 173 |
| GO:0008360111 | Thyroid | PTC | regulation of cell shape | 86/5968 | 154/18723 | 6.22e-10 | 1.95e-08 | 86 |
| GO:0010975110 | Thyroid | PTC | regulation of neuron projection development | 194/5968 | 445/18723 | 1.05e-07 | 2.08e-06 | 194 |
| GO:001072018 | Thyroid | PTC | positive regulation of cell development | 138/5968 | 298/18723 | 1.13e-07 | 2.22e-06 | 138 |
| GO:006156419 | Thyroid | PTC | axon development | 199/5968 | 467/18723 | 5.27e-07 | 8.53e-06 | 199 |
| Page: 1 2 3 |
| Pathway ID | Tissue | Disease Stage | Description | Gene Ratio | Bg Ratio | pvalue | p.adjust | qvalue | Count |
| Page: 1 |
Top |
Cell-cell communication analysis |
| Identification of potential cell-cell interactions between two cell types and their ligand-receptor pairs for different disease states |
| Ligand | Receptor | LRpair | Pathway | Tissue | Disease Stage |
| SEMA7A | PLXNC1 | SEMA7A_PLXNC1 | SEMA7 | Breast | DCIS |
| SEMA7A | PLXNC1 | SEMA7A_PLXNC1 | SEMA7 | CRC | AD |
| SEMA7A | PLXNC1 | SEMA7A_PLXNC1 | SEMA7 | Endometrium | AEH |
| SEMA7A | PLXNC1 | SEMA7A_PLXNC1 | SEMA7 | Esophagus | ESCC |
| SEMA7A | PLXNC1 | SEMA7A_PLXNC1 | SEMA7 | HNSCC | OSCC |
| SEMA7A | PLXNC1 | SEMA7A_PLXNC1 | SEMA7 | HNSCC | Precancer |
| SEMA7A | PLXNC1 | SEMA7A_PLXNC1 | SEMA7 | Lung | AAH |
| SEMA7A | PLXNC1 | SEMA7A_PLXNC1 | SEMA7 | Lung | ADJ |
| SEMA7A | PLXNC1 | SEMA7A_PLXNC1 | SEMA7 | Lung | IAC |
| SEMA7A | PLXNC1 | SEMA7A_PLXNC1 | SEMA7 | Skin | cSCC |
| SEMA7A | PLXNC1 | SEMA7A_PLXNC1 | SEMA7 | Skin | SCCIS |
| SEMA7A | PLXNC1 | SEMA7A_PLXNC1 | SEMA7 | THCA | Cancer |
| SEMA7A | PLXNC1 | SEMA7A_PLXNC1 | SEMA7 | THCA | Precancer |
| SEMA7A | PLXNC1 | SEMA7A_PLXNC1 | SEMA7 | THCA | PTC |
| Page: 1 |
Top |
Single-cell gene regulatory network inference analysis |
| Find out the significant the regulons (TFs) and the target genes of each regulon across cell types for different disease states |
| TF | Cell Type | Tissue | Disease Stage | Target Gene | RSS | Regulon Activity |
| ∗The dot plots of a searched regulon are shown for all cell subpopulations in each disease state of each tissue based on the regulon specific score inferred using pySCENIC and by calculating the average expression. |
| Page: 1 |
Top |
Somatic mutation of malignant transformation related genes |
| Annotation of somatic variants for genes involved in malignant transformation |
| Hugo Symbol | Variant Class | Variant Classification | dbSNP RS | HGVSc | HGVSp | HGVSp Short | SWISSPROT | BIOTYPE | SIFT | PolyPhen | Tumor Sample Barcode | Tissue | Histology | Sex | Age | Stage | Therapy Types | Drugs | Outcome |
| PLXNC1 | SNV | Missense_Mutation | c.2300G>T | p.Ser767Ile | p.S767I | O60486 | protein_coding | deleterious(0) | probably_damaging(0.961) | TCGA-A2-A25A-01 | Breast | breast invasive carcinoma | Female | <65 | I/II | Unspecific | Cytoxan | SD | |
| PLXNC1 | SNV | Missense_Mutation | rs751117319 | c.2540C>T | p.Thr847Met | p.T847M | O60486 | protein_coding | tolerated(0.05) | possibly_damaging(0.635) | TCGA-A8-A09C-01 | Breast | breast invasive carcinoma | Female | >=65 | I/II | Unknown | Unknown | SD |
| PLXNC1 | SNV | Missense_Mutation | novel | c.3726A>C | p.Leu1242Phe | p.L1242F | O60486 | protein_coding | tolerated(0.18) | benign(0.21) | TCGA-AC-A7VC-01 | Breast | breast invasive carcinoma | Female | <65 | I/II | Unknown | Unknown | SD |
| PLXNC1 | SNV | Missense_Mutation | novel | c.1886N>T | p.Arg629Ile | p.R629I | O60486 | protein_coding | tolerated(0.28) | benign(0.07) | TCGA-AN-A046-01 | Breast | breast invasive carcinoma | Female | >=65 | I/II | Unknown | Unknown | SD |
| PLXNC1 | SNV | Missense_Mutation | rs770261661 | c.2882N>T | p.Ala961Val | p.A961V | O60486 | protein_coding | tolerated(0.39) | benign(0.001) | TCGA-BH-A0BP-01 | Breast | breast invasive carcinoma | Female | >=65 | I/II | Unknown | Unknown | SD |
| PLXNC1 | SNV | Missense_Mutation | novel | c.4645N>A | p.Gln1549Lys | p.Q1549K | O60486 | protein_coding | tolerated(0.47) | benign(0.112) | TCGA-OL-A66L-01 | Breast | breast invasive carcinoma | Female | >=65 | I/II | Unknown | Unknown | SD |
| PLXNC1 | SNV | Missense_Mutation | novel | c.3537N>T | p.Lys1179Asn | p.K1179N | O60486 | protein_coding | deleterious(0) | probably_damaging(0.996) | TCGA-C5-A7UE-01 | Cervix | cervical & endocervical cancer | Female | <65 | I/II | Chemotherapy | cisplatin | SD |
| PLXNC1 | SNV | Missense_Mutation | c.702N>A | p.Phe234Leu | p.F234L | O60486 | protein_coding | deleterious(0) | probably_damaging(0.922) | TCGA-DR-A0ZM-01 | Cervix | cervical & endocervical cancer | Female | <65 | III/IV | Unspecific | Cisplatin | SD | |
| PLXNC1 | SNV | Missense_Mutation | rs376243881 | c.1819N>A | p.Ala607Thr | p.A607T | O60486 | protein_coding | tolerated(0.47) | benign(0.003) | TCGA-EA-A3HS-01 | Cervix | cervical & endocervical cancer | Female | <65 | I/II | Unknown | Unknown | SD |
| PLXNC1 | SNV | Missense_Mutation | c.3220N>A | p.Glu1074Lys | p.E1074K | O60486 | protein_coding | deleterious(0) | probably_damaging(0.998) | TCGA-EK-A2PM-01 | Cervix | cervical & endocervical cancer | Female | >=65 | I/II | Unknown | Unknown | SD |
| Page: 1 2 3 4 5 6 7 8 9 10 11 12 13 14 15 16 17 18 19 |
Top |
Related drugs of malignant transformation related genes |
| Identification of chemicals and drugs interact with genes involved in malignant transfromation |
| (DGIdb 4.0) |
| Entrez ID | Symbol | Category | Interaction Types | Drug Claim Name | Drug Name | PMIDs |
| Page: 1 |

Copyright 2023-Present -The University of Texas Health Science Center at Houston |