
|
|||||
|
 | |
| |
| |
| |
| |
| |
|
Gene: PLXNA3 |
Gene summary for PLXNA3 |
| Gene information | Species | Human | Gene symbol | PLXNA3 | Gene ID | 55558 |
| Gene name | plexin A3 | |
| Gene Alias | 6.3 | |
| Cytomap | Xq28 | |
| Gene Type | protein-coding | GO ID | GO:0000902 | UniProtAcc | P51805 |
Top |
Malignant transformation analysis |
| Identification of the aberrant gene expression in precancerous and cancerous lesions by comparing the gene expression of stem-like cells in diseased tissues with normal stem cells |
| Entrez ID | Symbol | Replicates | Species | Organ | Tissue | Adj P-value | Log2FC | Malignancy |
| 55558 | PLXNA3 | HTA11_3410_2000001011 | Human | Colorectum | AD | 1.01e-02 | 9.00e-02 | 0.0155 |
| 55558 | PLXNA3 | HTA11_2487_2000001011 | Human | Colorectum | SER | 2.72e-07 | 3.44e-01 | -0.1808 |
| 55558 | PLXNA3 | HTA11_1938_2000001011 | Human | Colorectum | AD | 2.16e-03 | 2.07e-01 | -0.0811 |
| 55558 | PLXNA3 | HTA11_347_2000001011 | Human | Colorectum | AD | 7.41e-07 | 2.24e-01 | -0.1954 |
| 55558 | PLXNA3 | HTA11_411_2000001011 | Human | Colorectum | SER | 2.49e-07 | 7.15e-01 | -0.2602 |
| 55558 | PLXNA3 | HTA11_1391_2000001011 | Human | Colorectum | AD | 4.06e-04 | 2.33e-01 | -0.059 |
| 55558 | PLXNA3 | HTA11_2992_2000001011 | Human | Colorectum | SER | 1.84e-02 | 2.52e-01 | -0.1706 |
| 55558 | PLXNA3 | HTA11_99999971662_82457 | Human | Colorectum | MSS | 1.12e-03 | 2.32e-01 | 0.3859 |
| 55558 | PLXNA3 | HTA11_99999973899_84307 | Human | Colorectum | MSS | 3.20e-04 | 4.24e-01 | 0.2585 |
| 55558 | PLXNA3 | HTA11_99999974143_84620 | Human | Colorectum | MSS | 4.97e-06 | 2.63e-01 | 0.3005 |
| 55558 | PLXNA3 | HCC1_Meng | Human | Liver | HCC | 3.42e-10 | -1.76e-02 | 0.0246 |
| 55558 | PLXNA3 | HCC2_Meng | Human | Liver | HCC | 9.01e-12 | 1.13e-01 | 0.0107 |
| 55558 | PLXNA3 | S014 | Human | Liver | HCC | 4.90e-06 | 2.95e-01 | 0.2254 |
| 55558 | PLXNA3 | S015 | Human | Liver | HCC | 6.81e-07 | 3.93e-01 | 0.2375 |
| 55558 | PLXNA3 | S016 | Human | Liver | HCC | 7.44e-04 | 1.99e-01 | 0.2243 |
| 55558 | PLXNA3 | S027 | Human | Liver | HCC | 7.86e-22 | 1.47e+00 | 0.2446 |
| 55558 | PLXNA3 | S028 | Human | Liver | HCC | 9.54e-32 | 1.21e+00 | 0.2503 |
| 55558 | PLXNA3 | S029 | Human | Liver | HCC | 1.15e-27 | 1.24e+00 | 0.2581 |
| 55558 | PLXNA3 | C21 | Human | Oral cavity | OSCC | 1.97e-14 | 5.14e-01 | 0.2678 |
| 55558 | PLXNA3 | C30 | Human | Oral cavity | OSCC | 1.53e-11 | 6.16e-01 | 0.3055 |
| Page: 1 2 3 |
| Tissue | Expression Dynamics | Abbreviation |
| Colorectum (GSE201348) |  | FAP: Familial adenomatous polyposis |
| CRC: Colorectal cancer | ||
| Colorectum (HTA11) |  | AD: Adenomas |
| SER: Sessile serrated lesions | ||
| MSI-H: Microsatellite-high colorectal cancer | ||
| MSS: Microsatellite stable colorectal cancer | ||
| Liver | 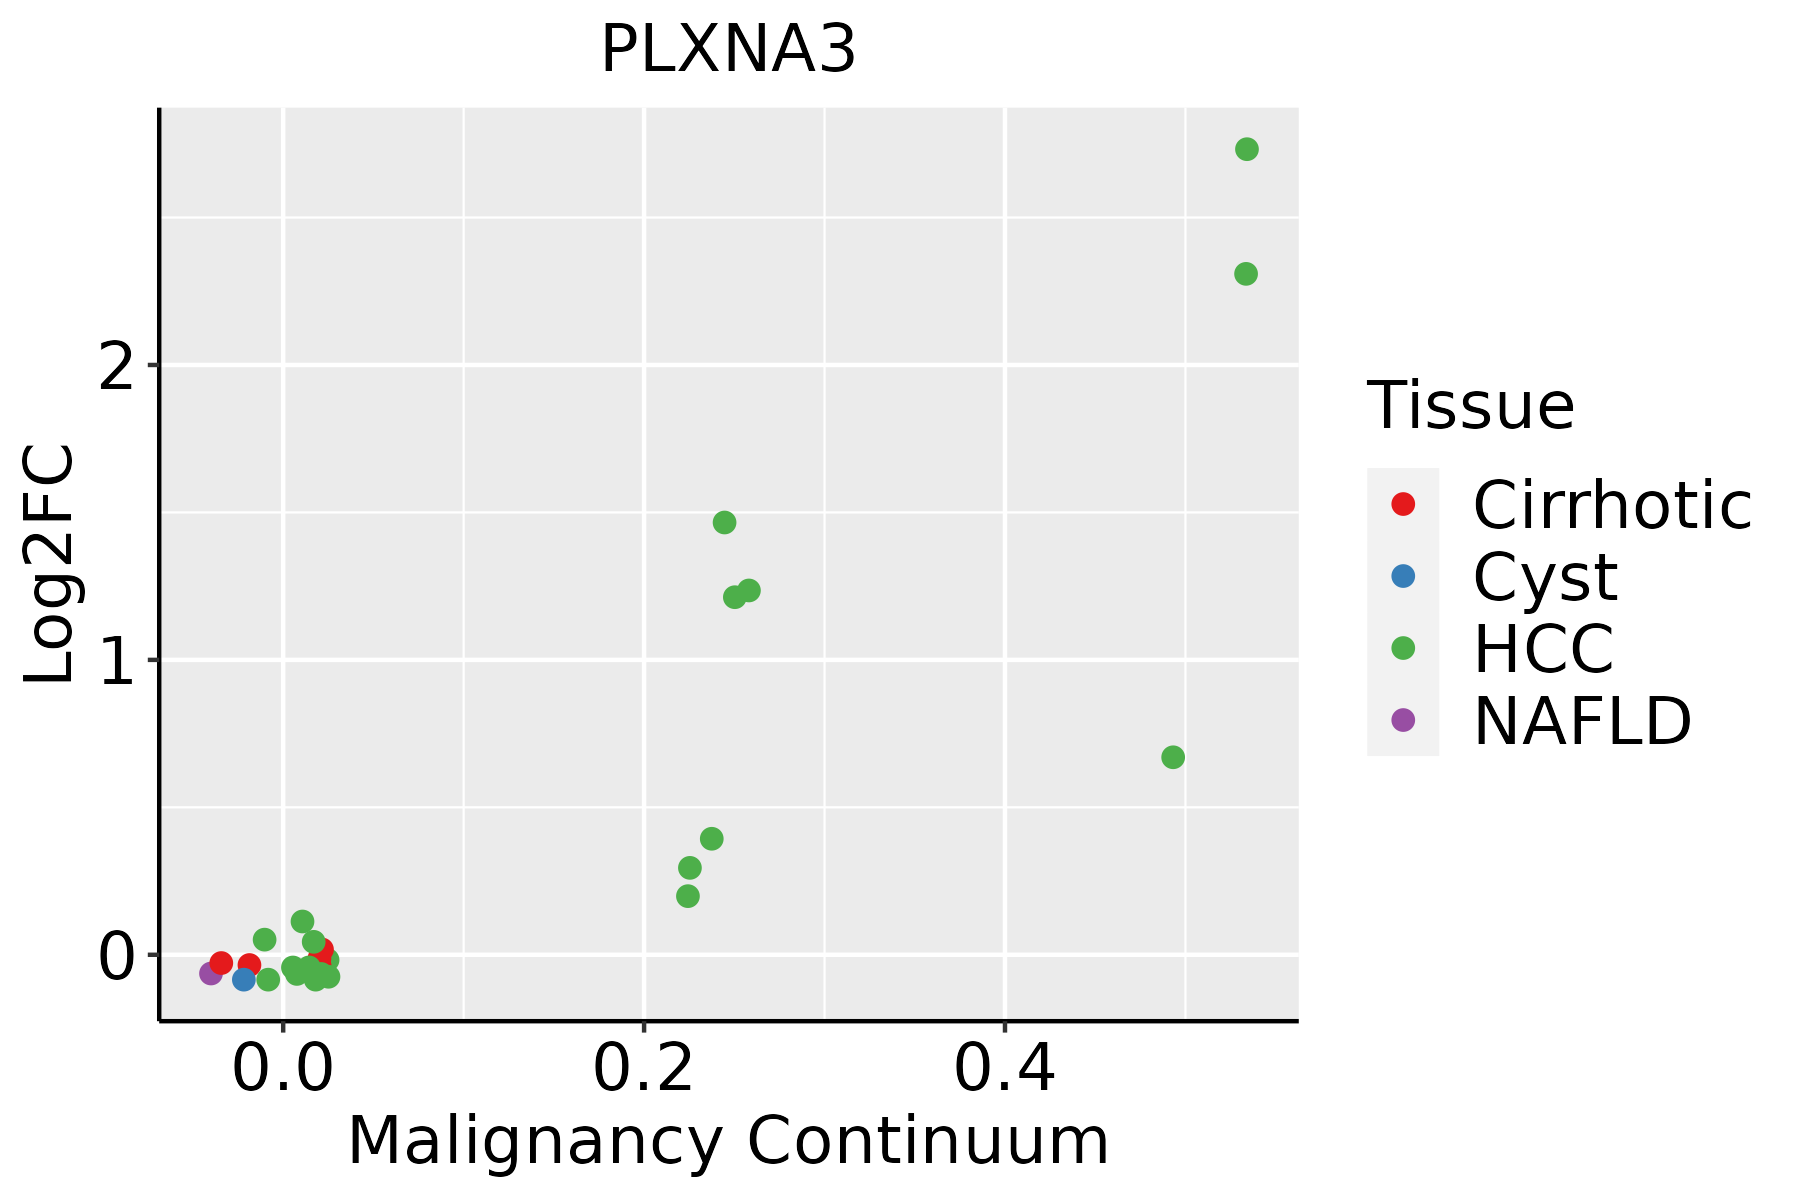 | HCC: Hepatocellular carcinoma |
| NAFLD: Non-alcoholic fatty liver disease | ||
| Oral Cavity | 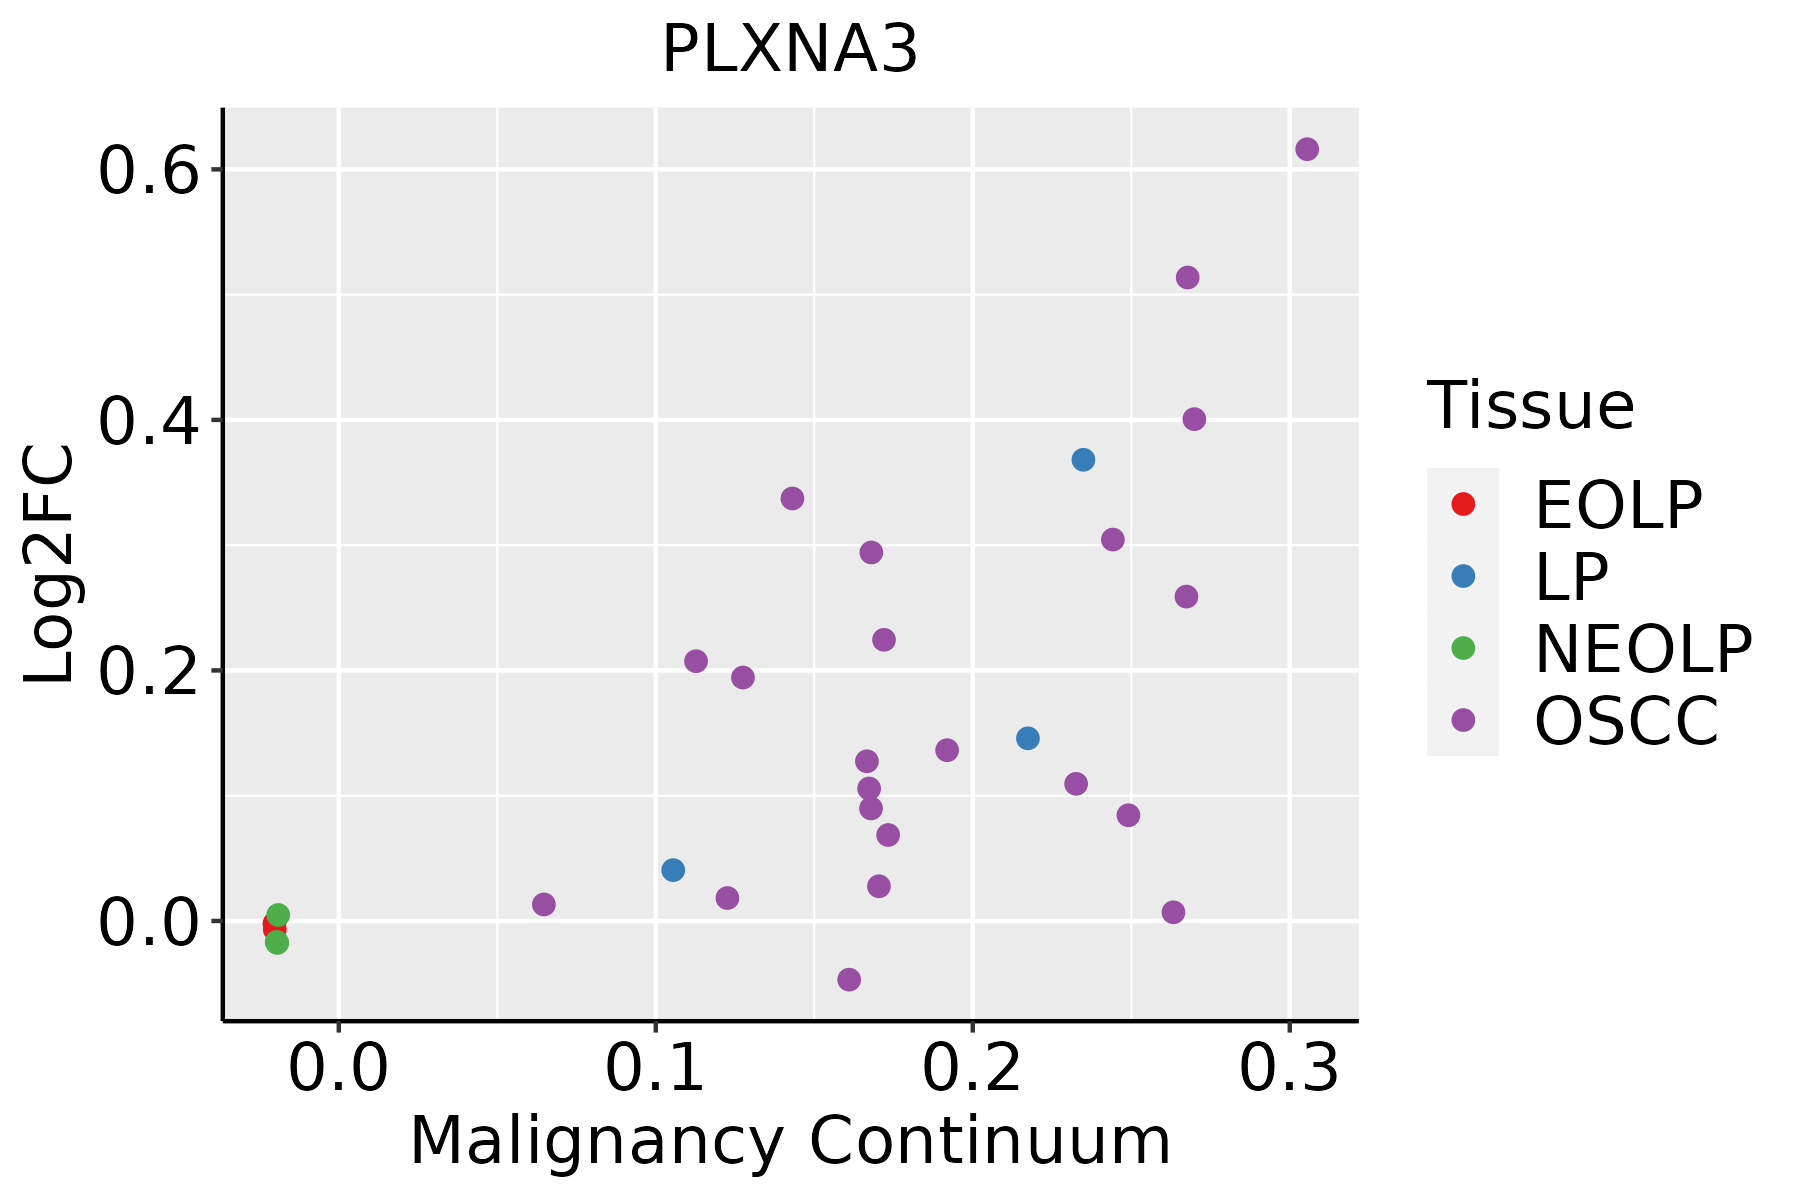 | EOLP: Erosive Oral lichen planus |
| LP: leukoplakia | ||
| NEOLP: Non-erosive oral lichen planus | ||
| OSCC: Oral squamous cell carcinoma | ||
| Thyroid | 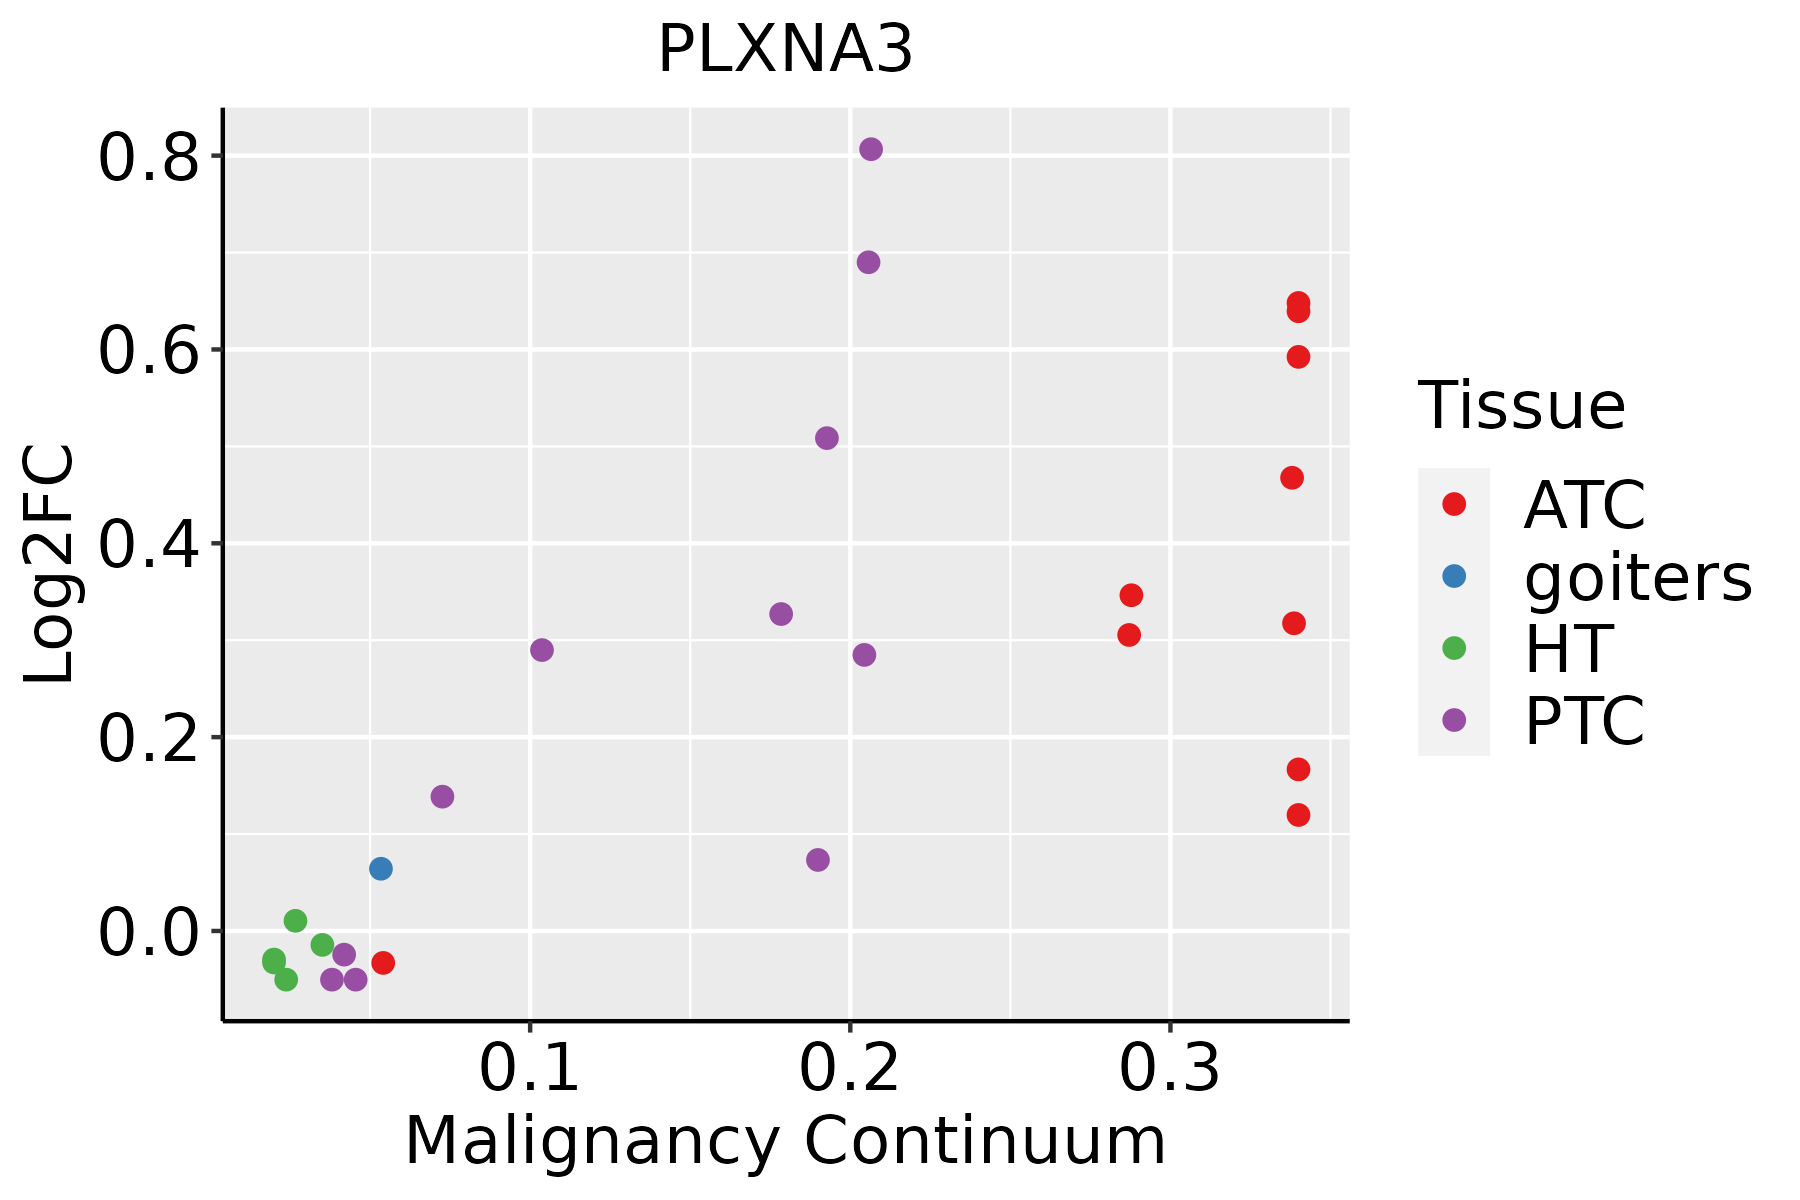 | ATC: Anaplastic thyroid cancer |
| HT: Hashimoto's thyroiditis | ||
| PTC: Papillary thyroid cancer |
| ∗log2FC in expression of this searched gene in stem-like cells from each diseased tissue sample relative to stem-like cells in normal samples in each tissue plotted against the malignancy continuum. Samples are colored based on if they are from different disease stage. |
Top |
Malignant transformation related pathway analysis |
| Find out the enriched GO biological processes and KEGG pathways involved in transition from healthy to precancer to cancer |
| Tissue | Disease Stage | Enriched GO biological Processes |
| Colorectum | AD |  |
| Colorectum | SER |  |
| Colorectum | MSS |  |
| Colorectum | MSI-H |  |
| Colorectum | FAP |  |
| ∗Top 15 enriched GO BP terms are showed in the bar plot of each disease state in each tissue. Each row represents a significant GO biological process which is colored according to the -log10(p.adjust). |
| Page: 1 2 3 4 5 6 7 8 9 |
| GO ID | Tissue | Disease Stage | Description | Gene Ratio | Bg Ratio | pvalue | p.adjust | Count |
| GO:0032535 | Colorectum | AD | regulation of cellular component size | 142/3918 | 383/18723 | 1.74e-13 | 3.41e-11 | 142 |
| GO:0051495 | Colorectum | AD | positive regulation of cytoskeleton organization | 89/3918 | 226/18723 | 1.61e-10 | 1.56e-08 | 89 |
| GO:0022604 | Colorectum | AD | regulation of cell morphogenesis | 109/3918 | 309/18723 | 3.08e-09 | 2.07e-07 | 109 |
| GO:0043087 | Colorectum | AD | regulation of GTPase activity | 110/3918 | 348/18723 | 1.64e-06 | 5.03e-05 | 110 |
| GO:0016049 | Colorectum | AD | cell growth | 143/3918 | 482/18723 | 2.83e-06 | 8.09e-05 | 143 |
| GO:0008360 | Colorectum | AD | regulation of cell shape | 56/3918 | 154/18723 | 7.01e-06 | 1.73e-04 | 56 |
| GO:0001558 | Colorectum | AD | regulation of cell growth | 124/3918 | 414/18723 | 7.67e-06 | 1.86e-04 | 124 |
| GO:0010975 | Colorectum | AD | regulation of neuron projection development | 129/3918 | 445/18723 | 2.88e-05 | 5.37e-04 | 129 |
| GO:0007409 | Colorectum | AD | axonogenesis | 122/3918 | 418/18723 | 3.36e-05 | 6.15e-04 | 122 |
| GO:0031346 | Colorectum | AD | positive regulation of cell projection organization | 104/3918 | 353/18723 | 8.26e-05 | 1.30e-03 | 104 |
| GO:0061564 | Colorectum | AD | axon development | 132/3918 | 467/18723 | 8.40e-05 | 1.31e-03 | 132 |
| GO:0021859 | Colorectum | AD | pyramidal neuron differentiation | 9/3918 | 13/18723 | 2.38e-04 | 3.03e-03 | 9 |
| GO:0021860 | Colorectum | AD | pyramidal neuron development | 8/3918 | 11/18723 | 3.26e-04 | 3.85e-03 | 8 |
| GO:0010720 | Colorectum | AD | positive regulation of cell development | 87/3918 | 298/18723 | 4.17e-04 | 4.71e-03 | 87 |
| GO:0031345 | Colorectum | AD | negative regulation of cell projection organization | 58/3918 | 186/18723 | 6.37e-04 | 6.58e-03 | 58 |
| GO:0008361 | Colorectum | AD | regulation of cell size | 56/3918 | 181/18723 | 9.61e-04 | 9.07e-03 | 56 |
| GO:0050770 | Colorectum | AD | regulation of axonogenesis | 49/3918 | 154/18723 | 9.88e-04 | 9.28e-03 | 49 |
| GO:0048638 | Colorectum | AD | regulation of developmental growth | 92/3918 | 330/18723 | 1.48e-03 | 1.25e-02 | 92 |
| GO:0050767 | Colorectum | AD | regulation of neurogenesis | 99/3918 | 364/18723 | 2.35e-03 | 1.82e-02 | 99 |
| GO:0030516 | Colorectum | AD | regulation of axon extension | 32/3918 | 95/18723 | 2.59e-03 | 1.96e-02 | 32 |
| Page: 1 2 3 4 5 6 7 8 9 10 |
| Pathway ID | Tissue | Disease Stage | Description | Gene Ratio | Bg Ratio | pvalue | p.adjust | qvalue | Count |
| hsa04360 | Colorectum | AD | Axon guidance | 61/2092 | 182/8465 | 4.36e-03 | 2.17e-02 | 1.38e-02 | 61 |
| hsa043601 | Colorectum | AD | Axon guidance | 61/2092 | 182/8465 | 4.36e-03 | 2.17e-02 | 1.38e-02 | 61 |
| hsa043602 | Colorectum | MSS | Axon guidance | 54/1875 | 182/8465 | 1.03e-02 | 3.69e-02 | 2.26e-02 | 54 |
| hsa043603 | Colorectum | MSS | Axon guidance | 54/1875 | 182/8465 | 1.03e-02 | 3.69e-02 | 2.26e-02 | 54 |
| hsa0436014 | Oral cavity | OSCC | Axon guidance | 97/3704 | 182/8465 | 5.59e-03 | 1.33e-02 | 6.76e-03 | 97 |
| hsa0436015 | Oral cavity | OSCC | Axon guidance | 97/3704 | 182/8465 | 5.59e-03 | 1.33e-02 | 6.76e-03 | 97 |
| Page: 1 |
Top |
Cell-cell communication analysis |
| Identification of potential cell-cell interactions between two cell types and their ligand-receptor pairs for different disease states |
| Ligand | Receptor | LRpair | Pathway | Tissue | Disease Stage |
| SEMA5A | PLXNA3 | SEMA5A_PLXNA3 | SEMA5 | CRC | AD |
| SEMA5A | PLXNA3 | SEMA5A_PLXNA3 | SEMA5 | CRC | MSI-H |
| SEMA5A | PLXNA3 | SEMA5A_PLXNA3 | SEMA5 | CRC | SER |
| SEMA5A | PLXNA3 | SEMA5A_PLXNA3 | SEMA5 | HNSCC | Precancer |
| SEMA4A | NRP1_PLXNA3 | SEMA4A_NRP1_PLXNA3 | SEMA4 | THCA | ADJ |
| SEMA3C | NRP1_PLXNA3 | SEMA3C_NRP1_PLXNA3 | SEMA3 | THCA | ADJ |
| SEMA3D | NRP1_PLXNA3 | SEMA3D_NRP1_PLXNA3 | SEMA3 | THCA | ADJ |
| SEMA3C | NRP2_PLXNA3 | SEMA3C_NRP2_PLXNA3 | SEMA3 | THCA | ADJ |
| SEMA3D | NRP2_PLXNA3 | SEMA3D_NRP2_PLXNA3 | SEMA3 | THCA | ADJ |
| SEMA3F | NRP2_PLXNA3 | SEMA3F_NRP2_PLXNA3 | SEMA3 | THCA | ADJ |
| SEMA3G | NRP2_PLXNA3 | SEMA3G_NRP2_PLXNA3 | SEMA3 | THCA | ADJ |
| SEMA4A | NRP1_PLXNA3 | SEMA4A_NRP1_PLXNA3 | SEMA4 | THCA | Cancer |
| SEMA3A | NRP1_PLXNA3 | SEMA3A_NRP1_PLXNA3 | SEMA3 | THCA | Cancer |
| SEMA3C | NRP1_PLXNA3 | SEMA3C_NRP1_PLXNA3 | SEMA3 | THCA | Cancer |
| SEMA3D | NRP1_PLXNA3 | SEMA3D_NRP1_PLXNA3 | SEMA3 | THCA | Cancer |
| SEMA3C | NRP2_PLXNA3 | SEMA3C_NRP2_PLXNA3 | SEMA3 | THCA | Cancer |
| SEMA3D | NRP2_PLXNA3 | SEMA3D_NRP2_PLXNA3 | SEMA3 | THCA | Cancer |
| SEMA3F | NRP2_PLXNA3 | SEMA3F_NRP2_PLXNA3 | SEMA3 | THCA | Cancer |
| SEMA5A | PLXNA3 | SEMA5A_PLXNA3 | SEMA5 | THCA | Cancer |
| Page: 1 |
Top |
Single-cell gene regulatory network inference analysis |
| Find out the significant the regulons (TFs) and the target genes of each regulon across cell types for different disease states |
| TF | Cell Type | Tissue | Disease Stage | Target Gene | RSS | Regulon Activity |
| ∗The dot plots of a searched regulon are shown for all cell subpopulations in each disease state of each tissue based on the regulon specific score inferred using pySCENIC and by calculating the average expression. |
| Page: 1 |
Top |
Somatic mutation of malignant transformation related genes |
| Annotation of somatic variants for genes involved in malignant transformation |
| Hugo Symbol | Variant Class | Variant Classification | dbSNP RS | HGVSc | HGVSp | HGVSp Short | SWISSPROT | BIOTYPE | SIFT | PolyPhen | Tumor Sample Barcode | Tissue | Histology | Sex | Age | Stage | Therapy Types | Drugs | Outcome |
| PLXNA3 | SNV | Missense_Mutation | c.3275N>A | p.Arg1092Gln | p.R1092Q | P51805 | protein_coding | tolerated(0.63) | benign(0) | TCGA-5T-A9QA-01 | Breast | breast invasive carcinoma | Female | <65 | I/II | Chemotherapy | taxol | SD | |
| PLXNA3 | SNV | Missense_Mutation | c.4825G>C | p.Asp1609His | p.D1609H | P51805 | protein_coding | deleterious(0.01) | benign(0.077) | TCGA-A1-A0SI-01 | Breast | breast invasive carcinoma | Female | <65 | I/II | Unknown | Unknown | SD | |
| PLXNA3 | SNV | Missense_Mutation | novel | c.3394N>G | p.Pro1132Ala | p.P1132A | P51805 | protein_coding | tolerated(0.07) | probably_damaging(0.999) | TCGA-A2-A0YH-01 | Breast | breast invasive carcinoma | Female | <65 | III/IV | Chemotherapy | adriamycin | SD |
| PLXNA3 | SNV | Missense_Mutation | novel | c.2191N>T | p.Arg731Trp | p.R731W | P51805 | protein_coding | deleterious(0.01) | probably_damaging(0.965) | TCGA-A2-A3Y0-01 | Breast | breast invasive carcinoma | Female | <65 | I/II | Chemotherapy | adriamycin | CR |
| PLXNA3 | SNV | Missense_Mutation | c.706N>A | p.Val236Met | p.V236M | P51805 | protein_coding | deleterious(0.01) | probably_damaging(0.999) | TCGA-A8-A09G-01 | Breast | breast invasive carcinoma | Female | >=65 | III/IV | Unknown | Unknown | SD | |
| PLXNA3 | SNV | Missense_Mutation | novel | c.3953N>G | p.Lys1318Arg | p.K1318R | P51805 | protein_coding | tolerated(0.97) | benign(0.027) | TCGA-A8-A09Z-01 | Breast | breast invasive carcinoma | Female | >=65 | I/II | Unknown | Unknown | SD |
| PLXNA3 | SNV | Missense_Mutation | novel | c.5208C>A | p.Phe1736Leu | p.F1736L | P51805 | protein_coding | deleterious(0) | probably_damaging(0.994) | TCGA-AN-A046-01 | Breast | breast invasive carcinoma | Female | >=65 | I/II | Unknown | Unknown | SD |
| PLXNA3 | SNV | Missense_Mutation | novel | c.3763N>A | p.Arg1255Ser | p.R1255S | P51805 | protein_coding | tolerated(0.13) | probably_damaging(0.999) | TCGA-AR-A0TT-01 | Breast | breast invasive carcinoma | Female | <65 | III/IV | Chemotherapy | doxorubicin | SD |
| PLXNA3 | SNV | Missense_Mutation | rs782020864 | c.763N>A | p.Glu255Lys | p.E255K | P51805 | protein_coding | deleterious(0.02) | probably_damaging(0.997) | TCGA-B6-A0I1-01 | Breast | breast invasive carcinoma | Female | >=65 | I/II | Unknown | Unknown | PD |
| PLXNA3 | SNV | Missense_Mutation | c.5309N>T | p.Ser1770Leu | p.S1770L | P51805 | protein_coding | deleterious(0) | probably_damaging(0.998) | TCGA-BH-A18G-01 | Breast | breast invasive carcinoma | Female | >=65 | I/II | Unknown | Unknown | SD |
| Page: 1 2 3 4 5 6 7 8 9 10 11 12 13 14 15 16 17 18 19 20 21 22 |
Top |
Related drugs of malignant transformation related genes |
| Identification of chemicals and drugs interact with genes involved in malignant transfromation |
| (DGIdb 4.0) |
| Entrez ID | Symbol | Category | Interaction Types | Drug Claim Name | Drug Name | PMIDs |
| Page: 1 |

Copyright 2023-Present -The University of Texas Health Science Center at Houston |