
|
|||||
|
 | |
| |
| |
| |
| |
| |
|
Gene: PLXNA2 |
Gene summary for PLXNA2 |
| Gene information | Species | Human | Gene symbol | PLXNA2 | Gene ID | 5362 |
| Gene name | plexin A2 | |
| Gene Alias | OCT | |
| Cytomap | 1q32.2 | |
| Gene Type | protein-coding | GO ID | GO:0000902 | UniProtAcc | O75051 |
Top |
Malignant transformation analysis |
| Identification of the aberrant gene expression in precancerous and cancerous lesions by comparing the gene expression of stem-like cells in diseased tissues with normal stem cells |
| Entrez ID | Symbol | Replicates | Species | Organ | Tissue | Adj P-value | Log2FC | Malignancy |
| 5362 | PLXNA2 | CCI_1 | Human | Cervix | CC | 1.82e-02 | 8.70e-01 | 0.528 |
| 5362 | PLXNA2 | CCI_3 | Human | Cervix | CC | 1.73e-29 | 1.52e+00 | 0.516 |
| 5362 | PLXNA2 | HTA11_3410_2000001011 | Human | Colorectum | AD | 2.58e-05 | -3.91e-01 | 0.0155 |
| 5362 | PLXNA2 | HTA11_347_2000001011 | Human | Colorectum | AD | 3.29e-14 | 7.73e-01 | -0.1954 |
| 5362 | PLXNA2 | HTA11_411_2000001011 | Human | Colorectum | SER | 1.72e-08 | 1.48e+00 | -0.2602 |
| 5362 | PLXNA2 | HTA11_83_2000001011 | Human | Colorectum | SER | 3.34e-04 | 6.40e-01 | -0.1526 |
| 5362 | PLXNA2 | HTA11_99999970781_79442 | Human | Colorectum | MSS | 1.64e-02 | -3.05e-01 | 0.294 |
| 5362 | PLXNA2 | HTA11_99999973899_84307 | Human | Colorectum | MSS | 3.86e-04 | -5.73e-01 | 0.2585 |
| 5362 | PLXNA2 | HTA11_99999974143_84620 | Human | Colorectum | MSS | 2.46e-07 | -4.15e-01 | 0.3005 |
| 5362 | PLXNA2 | F007 | Human | Colorectum | FAP | 1.55e-08 | -4.74e-01 | 0.1176 |
| 5362 | PLXNA2 | A002-C-010 | Human | Colorectum | FAP | 6.09e-06 | -3.91e-01 | 0.242 |
| 5362 | PLXNA2 | A001-C-207 | Human | Colorectum | FAP | 4.07e-06 | -2.26e-01 | 0.1278 |
| 5362 | PLXNA2 | A015-C-203 | Human | Colorectum | FAP | 1.83e-33 | -5.25e-01 | -0.1294 |
| 5362 | PLXNA2 | A015-C-204 | Human | Colorectum | FAP | 1.43e-12 | -4.77e-01 | -0.0228 |
| 5362 | PLXNA2 | A014-C-040 | Human | Colorectum | FAP | 9.99e-06 | -4.12e-01 | -0.1184 |
| 5362 | PLXNA2 | A002-C-201 | Human | Colorectum | FAP | 8.78e-23 | -5.36e-01 | 0.0324 |
| 5362 | PLXNA2 | A002-C-203 | Human | Colorectum | FAP | 3.59e-10 | -3.02e-01 | 0.2786 |
| 5362 | PLXNA2 | A001-C-119 | Human | Colorectum | FAP | 1.36e-17 | -6.70e-01 | -0.1557 |
| 5362 | PLXNA2 | A001-C-108 | Human | Colorectum | FAP | 2.18e-20 | -4.20e-01 | -0.0272 |
| 5362 | PLXNA2 | A002-C-205 | Human | Colorectum | FAP | 1.91e-31 | -6.48e-01 | -0.1236 |
| Page: 1 2 3 4 5 6 |
| Tissue | Expression Dynamics | Abbreviation |
| Cervix | 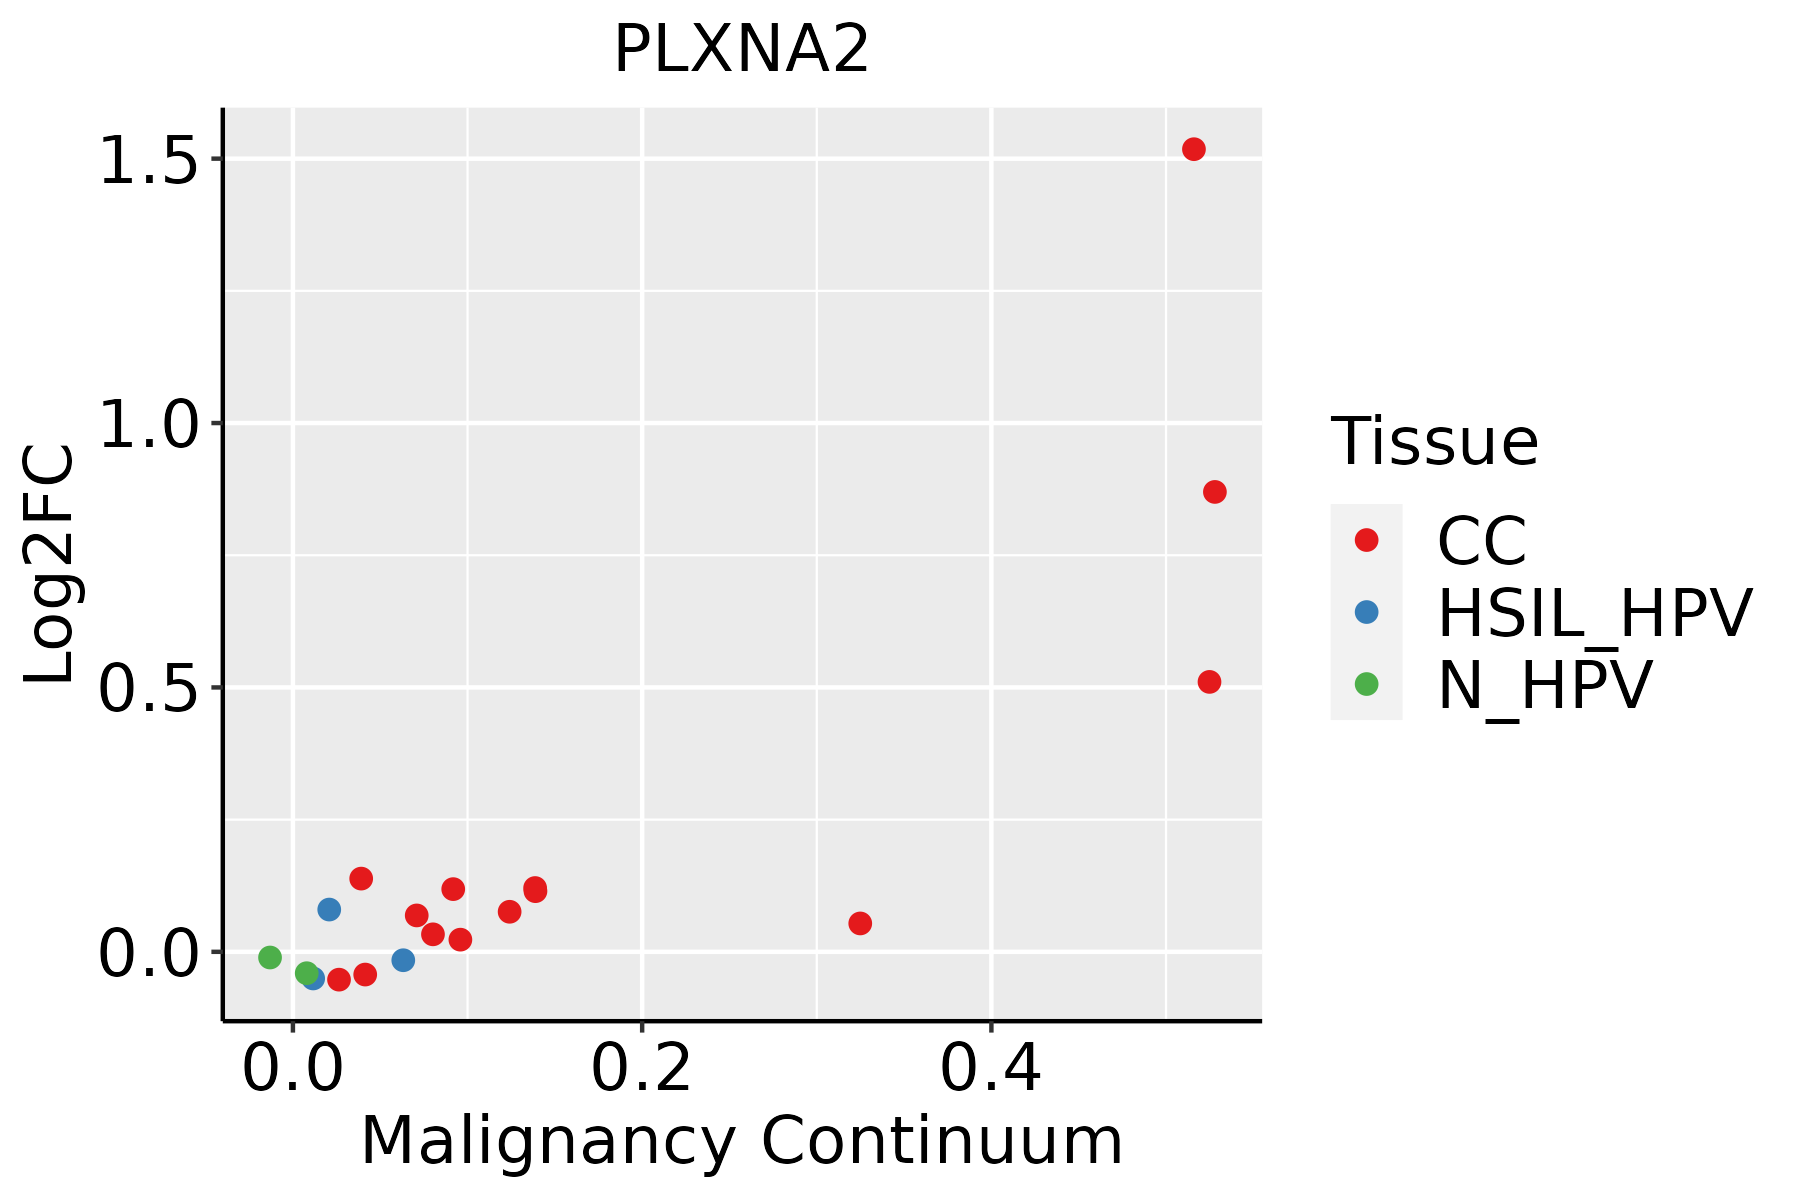 | CC: Cervix cancer |
| HSIL_HPV: HPV-infected high-grade squamous intraepithelial lesions | ||
| N_HPV: HPV-infected normal cervix | ||
| Colorectum (GSE201348) |  | FAP: Familial adenomatous polyposis |
| CRC: Colorectal cancer | ||
| Colorectum (HTA11) |  | AD: Adenomas |
| SER: Sessile serrated lesions | ||
| MSI-H: Microsatellite-high colorectal cancer | ||
| MSS: Microsatellite stable colorectal cancer | ||
| Esophagus | 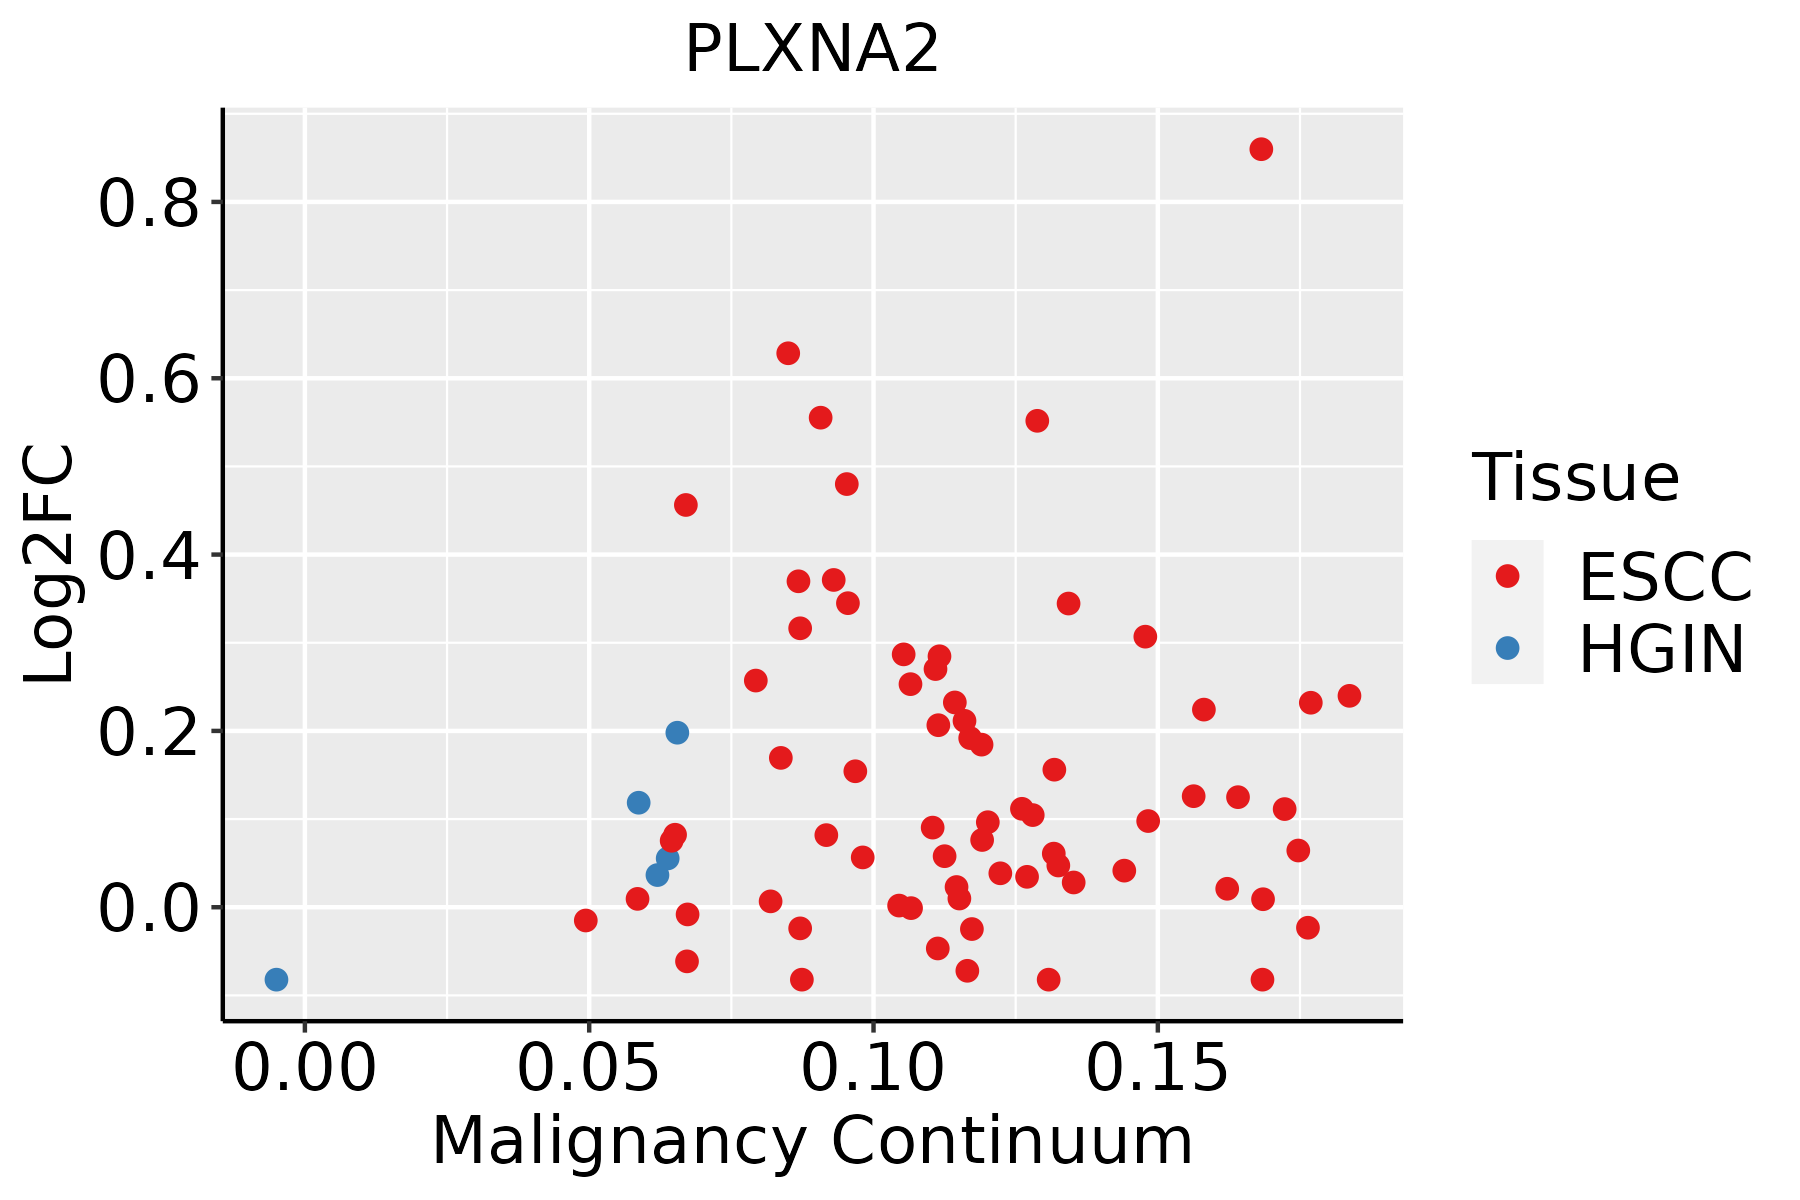 | ESCC: Esophageal squamous cell carcinoma |
| HGIN: High-grade intraepithelial neoplasias | ||
| LGIN: Low-grade intraepithelial neoplasias | ||
| Oral Cavity |  | EOLP: Erosive Oral lichen planus |
| LP: leukoplakia | ||
| NEOLP: Non-erosive oral lichen planus | ||
| OSCC: Oral squamous cell carcinoma | ||
| Thyroid |  | ATC: Anaplastic thyroid cancer |
| HT: Hashimoto's thyroiditis | ||
| PTC: Papillary thyroid cancer |
| ∗log2FC in expression of this searched gene in stem-like cells from each diseased tissue sample relative to stem-like cells in normal samples in each tissue plotted against the malignancy continuum. Samples are colored based on if they are from different disease stage. |
Top |
Malignant transformation related pathway analysis |
| Find out the enriched GO biological processes and KEGG pathways involved in transition from healthy to precancer to cancer |
| Tissue | Disease Stage | Enriched GO biological Processes |
| Colorectum | AD |  |
| Colorectum | SER |  |
| Colorectum | MSS |  |
| Colorectum | MSI-H |  |
| Colorectum | FAP |  |
| ∗Top 15 enriched GO BP terms are showed in the bar plot of each disease state in each tissue. Each row represents a significant GO biological process which is colored according to the -log10(p.adjust). |
| Page: 1 2 3 4 5 6 7 8 9 |
| GO ID | Tissue | Disease Stage | Description | Gene Ratio | Bg Ratio | pvalue | p.adjust | Count |
| GO:002260410 | Cervix | CC | regulation of cell morphogenesis | 84/2311 | 309/18723 | 1.00e-12 | 4.29e-10 | 84 |
| GO:00071626 | Cervix | CC | negative regulation of cell adhesion | 72/2311 | 303/18723 | 2.36e-08 | 1.70e-06 | 72 |
| GO:00430877 | Cervix | CC | regulation of GTPase activity | 79/2311 | 348/18723 | 4.21e-08 | 2.60e-06 | 79 |
| GO:00109757 | Cervix | CC | regulation of neuron projection development | 88/2311 | 445/18723 | 4.26e-06 | 1.09e-04 | 88 |
| GO:00107206 | Cervix | CC | positive regulation of cell development | 64/2311 | 298/18723 | 5.69e-06 | 1.41e-04 | 64 |
| GO:00313467 | Cervix | CC | positive regulation of cell projection organization | 72/2311 | 353/18723 | 1.04e-05 | 2.32e-04 | 72 |
| GO:00615647 | Cervix | CC | axon development | 89/2311 | 467/18723 | 1.71e-05 | 3.27e-04 | 89 |
| GO:00083608 | Cervix | CC | regulation of cell shape | 38/2311 | 154/18723 | 1.86e-05 | 3.46e-04 | 38 |
| GO:00074097 | Cervix | CC | axonogenesis | 78/2311 | 418/18723 | 1.14e-04 | 1.43e-03 | 78 |
| GO:00507705 | Cervix | CC | regulation of axonogenesis | 34/2311 | 154/18723 | 4.87e-04 | 4.76e-03 | 34 |
| GO:00519603 | Cervix | CC | regulation of nervous system development | 77/2311 | 443/18723 | 1.13e-03 | 9.30e-03 | 77 |
| GO:00507724 | Cervix | CC | positive regulation of axonogenesis | 20/2311 | 79/18723 | 1.19e-03 | 9.57e-03 | 20 |
| GO:00507676 | Cervix | CC | regulation of neurogenesis | 65/2311 | 364/18723 | 1.33e-03 | 1.05e-02 | 65 |
| GO:00618425 | Cervix | CC | microtubule organizing center localization | 11/2311 | 33/18723 | 1.42e-03 | 1.11e-02 | 11 |
| GO:00487365 | Cervix | CC | appendage development | 35/2311 | 172/18723 | 1.88e-03 | 1.39e-02 | 35 |
| GO:00601735 | Cervix | CC | limb development | 35/2311 | 172/18723 | 1.88e-03 | 1.39e-02 | 35 |
| GO:00507694 | Cervix | CC | positive regulation of neurogenesis | 43/2311 | 225/18723 | 2.25e-03 | 1.61e-02 | 43 |
| GO:00516425 | Cervix | CC | centrosome localization | 10/2311 | 32/18723 | 3.96e-03 | 2.48e-02 | 10 |
| GO:00219156 | Cervix | CC | neural tube development | 30/2311 | 152/18723 | 6.00e-03 | 3.43e-02 | 30 |
| GO:00519622 | Cervix | CC | positive regulation of nervous system development | 48/2311 | 272/18723 | 6.60e-03 | 3.65e-02 | 48 |
| Page: 1 2 3 4 5 6 7 8 9 10 |
| Pathway ID | Tissue | Disease Stage | Description | Gene Ratio | Bg Ratio | pvalue | p.adjust | qvalue | Count |
| hsa043609 | Cervix | CC | Axon guidance | 47/1267 | 182/8465 | 8.13e-05 | 5.38e-04 | 3.18e-04 | 47 |
| hsa0436012 | Cervix | CC | Axon guidance | 47/1267 | 182/8465 | 8.13e-05 | 5.38e-04 | 3.18e-04 | 47 |
| hsa04360 | Colorectum | AD | Axon guidance | 61/2092 | 182/8465 | 4.36e-03 | 2.17e-02 | 1.38e-02 | 61 |
| hsa043601 | Colorectum | AD | Axon guidance | 61/2092 | 182/8465 | 4.36e-03 | 2.17e-02 | 1.38e-02 | 61 |
| hsa043602 | Colorectum | MSS | Axon guidance | 54/1875 | 182/8465 | 1.03e-02 | 3.69e-02 | 2.26e-02 | 54 |
| hsa043603 | Colorectum | MSS | Axon guidance | 54/1875 | 182/8465 | 1.03e-02 | 3.69e-02 | 2.26e-02 | 54 |
| hsa043604 | Colorectum | FAP | Axon guidance | 47/1404 | 182/8465 | 9.09e-04 | 5.20e-03 | 3.16e-03 | 47 |
| hsa043605 | Colorectum | FAP | Axon guidance | 47/1404 | 182/8465 | 9.09e-04 | 5.20e-03 | 3.16e-03 | 47 |
| hsa043606 | Colorectum | CRC | Axon guidance | 43/1091 | 182/8465 | 4.38e-05 | 8.70e-04 | 5.90e-04 | 43 |
| hsa043607 | Colorectum | CRC | Axon guidance | 43/1091 | 182/8465 | 4.38e-05 | 8.70e-04 | 5.90e-04 | 43 |
| hsa0436016 | Esophagus | ESCC | Axon guidance | 108/4205 | 182/8465 | 5.13e-03 | 1.30e-02 | 6.67e-03 | 108 |
| hsa0436017 | Esophagus | ESCC | Axon guidance | 108/4205 | 182/8465 | 5.13e-03 | 1.30e-02 | 6.67e-03 | 108 |
| hsa0436014 | Oral cavity | OSCC | Axon guidance | 97/3704 | 182/8465 | 5.59e-03 | 1.33e-02 | 6.76e-03 | 97 |
| hsa0436015 | Oral cavity | OSCC | Axon guidance | 97/3704 | 182/8465 | 5.59e-03 | 1.33e-02 | 6.76e-03 | 97 |
| Page: 1 |
Top |
Cell-cell communication analysis |
| Identification of potential cell-cell interactions between two cell types and their ligand-receptor pairs for different disease states |
| Ligand | Receptor | LRpair | Pathway | Tissue | Disease Stage |
| SEMA3D | NRP1_PLXNA2 | SEMA3D_NRP1_PLXNA2 | SEMA3 | Breast | ADJ |
| SEMA3D | NRP2_PLXNA2 | SEMA3D_NRP2_PLXNA2 | SEMA3 | Breast | ADJ |
| SEMA6A | PLXNA2 | SEMA6A_PLXNA2 | SEMA6 | Breast | ADJ |
| SEMA3C | NRP1_PLXNA2 | SEMA3C_NRP1_PLXNA2 | SEMA3 | Breast | Healthy |
| SEMA3D | NRP1_PLXNA2 | SEMA3D_NRP1_PLXNA2 | SEMA3 | Breast | Healthy |
| SEMA3C | NRP2_PLXNA2 | SEMA3C_NRP2_PLXNA2 | SEMA3 | Breast | Healthy |
| SEMA3D | NRP2_PLXNA2 | SEMA3D_NRP2_PLXNA2 | SEMA3 | Breast | Healthy |
| SEMA6A | PLXNA2 | SEMA6A_PLXNA2 | SEMA6 | Breast | Healthy |
| SEMA6B | PLXNA2 | SEMA6B_PLXNA2 | SEMA6 | Breast | Healthy |
| SEMA3C | NRP1_PLXNA2 | SEMA3C_NRP1_PLXNA2 | SEMA3 | Cervix | CC |
| SEMA3C | NRP2_PLXNA2 | SEMA3C_NRP2_PLXNA2 | SEMA3 | Cervix | CC |
| SEMA3F | NRP2_PLXNA2 | SEMA3F_NRP2_PLXNA2 | SEMA3 | Cervix | CC |
| SEMA4A | NRP1_PLXNA2 | SEMA4A_NRP1_PLXNA2 | SEMA4 | Cervix | CC |
| SEMA6A | PLXNA2 | SEMA6A_PLXNA2 | SEMA6 | Cervix | CC |
| SEMA6B | PLXNA2 | SEMA6B_PLXNA2 | SEMA6 | Cervix | CC |
| SEMA3A | NRP1_PLXNA2 | SEMA3A_NRP1_PLXNA2 | SEMA3 | CRC | AD |
| SEMA3C | NRP1_PLXNA2 | SEMA3C_NRP1_PLXNA2 | SEMA3 | CRC | AD |
| SEMA3C | NRP2_PLXNA2 | SEMA3C_NRP2_PLXNA2 | SEMA3 | CRC | AD |
| SEMA3F | NRP2_PLXNA2 | SEMA3F_NRP2_PLXNA2 | SEMA3 | CRC | AD |
| SEMA6A | PLXNA2 | SEMA6A_PLXNA2 | SEMA6 | CRC | AD |
| Page: 1 |
Top |
Single-cell gene regulatory network inference analysis |
| Find out the significant the regulons (TFs) and the target genes of each regulon across cell types for different disease states |
| TF | Cell Type | Tissue | Disease Stage | Target Gene | RSS | Regulon Activity |
| ∗The dot plots of a searched regulon are shown for all cell subpopulations in each disease state of each tissue based on the regulon specific score inferred using pySCENIC and by calculating the average expression. |
| Page: 1 |
Top |
Somatic mutation of malignant transformation related genes |
| Annotation of somatic variants for genes involved in malignant transformation |
| Hugo Symbol | Variant Class | Variant Classification | dbSNP RS | HGVSc | HGVSp | HGVSp Short | SWISSPROT | BIOTYPE | SIFT | PolyPhen | Tumor Sample Barcode | Tissue | Histology | Sex | Age | Stage | Therapy Types | Drugs | Outcome |
| PLXNA2 | SNV | Missense_Mutation | novel | c.4015N>A | p.Glu1339Lys | p.E1339K | O75051 | protein_coding | tolerated(0.1) | possibly_damaging(0.848) | TCGA-5L-AAT1-01 | Breast | breast invasive carcinoma | Female | <65 | III/IV | Hormone Therapy | letrozol | SD |
| PLXNA2 | SNV | Missense_Mutation | c.2347N>A | p.Val783Met | p.V783M | O75051 | protein_coding | deleterious(0.03) | possibly_damaging(0.668) | TCGA-A2-A0YD-01 | Breast | breast invasive carcinoma | Female | <65 | I/II | Chemotherapy | cytoxan | SD | |
| PLXNA2 | SNV | Missense_Mutation | novel | c.4850N>T | p.Ser1617Phe | p.S1617F | O75051 | protein_coding | deleterious(0) | probably_damaging(0.995) | TCGA-A7-A13E-01 | Breast | breast invasive carcinoma | Female | <65 | I/II | Targeted Molecular therapy | bevacizumab | PD |
| PLXNA2 | SNV | Missense_Mutation | rs770880735 | c.2174N>A | p.Arg725Gln | p.R725Q | O75051 | protein_coding | tolerated(0.19) | benign(0.079) | TCGA-A8-A06Z-01 | Breast | breast invasive carcinoma | Female | >=65 | I/II | Unknown | Unknown | SD |
| PLXNA2 | SNV | Missense_Mutation | c.100N>A | p.Gly34Ser | p.G34S | O75051 | protein_coding | tolerated(0.25) | benign(0) | TCGA-A8-A09I-01 | Breast | breast invasive carcinoma | Female | >=65 | I/II | Hormone Therapy | anastrozole | SD | |
| PLXNA2 | SNV | Missense_Mutation | c.4151G>A | p.Gly1384Asp | p.G1384D | O75051 | protein_coding | tolerated(0.11) | probably_damaging(1) | TCGA-AC-A23H-01 | Breast | breast invasive carcinoma | Female | >=65 | I/II | Unknown | Unknown | PD | |
| PLXNA2 | SNV | Missense_Mutation | rs373585860 | c.4712N>T | p.Thr1571Ile | p.T1571I | O75051 | protein_coding | deleterious(0) | probably_damaging(0.998) | TCGA-AC-A2BK-01 | Breast | breast invasive carcinoma | Female | >=65 | III/IV | Chemotherapy | cytoxan | CR |
| PLXNA2 | SNV | Missense_Mutation | novel | c.4308G>T | p.Lys1436Asn | p.K1436N | O75051 | protein_coding | deleterious(0) | probably_damaging(1) | TCGA-AN-A046-01 | Breast | breast invasive carcinoma | Female | >=65 | I/II | Unknown | Unknown | SD |
| PLXNA2 | SNV | Missense_Mutation | rs538577214 | c.1375C>T | p.Arg459Trp | p.R459W | O75051 | protein_coding | tolerated(0.06) | probably_damaging(0.983) | TCGA-AN-A046-01 | Breast | breast invasive carcinoma | Female | >=65 | I/II | Unknown | Unknown | SD |
| PLXNA2 | SNV | Missense_Mutation | novel | c.132G>T | p.Glu44Asp | p.E44D | O75051 | protein_coding | tolerated(0.25) | benign(0.029) | TCGA-AN-A046-01 | Breast | breast invasive carcinoma | Female | >=65 | I/II | Unknown | Unknown | SD |
| Page: 1 2 3 4 5 6 7 8 9 10 11 12 13 14 15 16 17 18 19 20 21 22 23 24 25 |
Top |
Related drugs of malignant transformation related genes |
| Identification of chemicals and drugs interact with genes involved in malignant transfromation |
| (DGIdb 4.0) |
| Entrez ID | Symbol | Category | Interaction Types | Drug Claim Name | Drug Name | PMIDs |
| Page: 1 |

Copyright 2023-Present -The University of Texas Health Science Center at Houston |