
|
|||||
|
 | |
| |
| |
| |
| |
| |
|
Gene: PLXNA1 |
Gene summary for PLXNA1 |
| Gene information | Species | Human | Gene symbol | PLXNA1 | Gene ID | 5361 |
| Gene name | plexin A1 | |
| Gene Alias | NOV | |
| Cytomap | 3q21.3 | |
| Gene Type | protein-coding | GO ID | GO:0000902 | UniProtAcc | Q9UIW2 |
Top |
Malignant transformation analysis |
| Identification of the aberrant gene expression in precancerous and cancerous lesions by comparing the gene expression of stem-like cells in diseased tissues with normal stem cells |
| Entrez ID | Symbol | Replicates | Species | Organ | Tissue | Adj P-value | Log2FC | Malignancy |
| 5361 | PLXNA1 | LZE2T | Human | Esophagus | ESCC | 3.38e-05 | 5.92e-01 | 0.082 |
| 5361 | PLXNA1 | LZE7T | Human | Esophagus | ESCC | 2.75e-10 | 4.16e-01 | 0.0667 |
| 5361 | PLXNA1 | LZE8T | Human | Esophagus | ESCC | 2.28e-02 | 6.11e-02 | 0.067 |
| 5361 | PLXNA1 | LZE24T | Human | Esophagus | ESCC | 1.44e-07 | 1.45e-01 | 0.0596 |
| 5361 | PLXNA1 | P1T-E | Human | Esophagus | ESCC | 1.17e-13 | 6.10e-01 | 0.0875 |
| 5361 | PLXNA1 | P2T-E | Human | Esophagus | ESCC | 7.50e-10 | 2.25e-01 | 0.1177 |
| 5361 | PLXNA1 | P4T-E | Human | Esophagus | ESCC | 1.62e-04 | 4.13e-02 | 0.1323 |
| 5361 | PLXNA1 | P5T-E | Human | Esophagus | ESCC | 5.35e-10 | 2.01e-01 | 0.1327 |
| 5361 | PLXNA1 | P8T-E | Human | Esophagus | ESCC | 4.84e-26 | 5.33e-01 | 0.0889 |
| 5361 | PLXNA1 | P9T-E | Human | Esophagus | ESCC | 3.54e-06 | 1.35e-01 | 0.1131 |
| 5361 | PLXNA1 | P10T-E | Human | Esophagus | ESCC | 4.95e-33 | 6.63e-01 | 0.116 |
| 5361 | PLXNA1 | P11T-E | Human | Esophagus | ESCC | 9.46e-03 | 3.16e-01 | 0.1426 |
| 5361 | PLXNA1 | P12T-E | Human | Esophagus | ESCC | 7.47e-05 | 1.55e-01 | 0.1122 |
| 5361 | PLXNA1 | P15T-E | Human | Esophagus | ESCC | 8.77e-10 | 3.45e-01 | 0.1149 |
| 5361 | PLXNA1 | P16T-E | Human | Esophagus | ESCC | 3.84e-02 | 1.28e-01 | 0.1153 |
| 5361 | PLXNA1 | P17T-E | Human | Esophagus | ESCC | 1.76e-06 | 3.13e-01 | 0.1278 |
| 5361 | PLXNA1 | P20T-E | Human | Esophagus | ESCC | 1.21e-07 | 1.90e-01 | 0.1124 |
| 5361 | PLXNA1 | P21T-E | Human | Esophagus | ESCC | 7.87e-14 | 3.49e-01 | 0.1617 |
| 5361 | PLXNA1 | P22T-E | Human | Esophagus | ESCC | 2.86e-15 | 2.72e-01 | 0.1236 |
| 5361 | PLXNA1 | P23T-E | Human | Esophagus | ESCC | 6.60e-04 | 1.18e-01 | 0.108 |
| Page: 1 2 3 4 5 |
| Tissue | Expression Dynamics | Abbreviation |
| Esophagus | 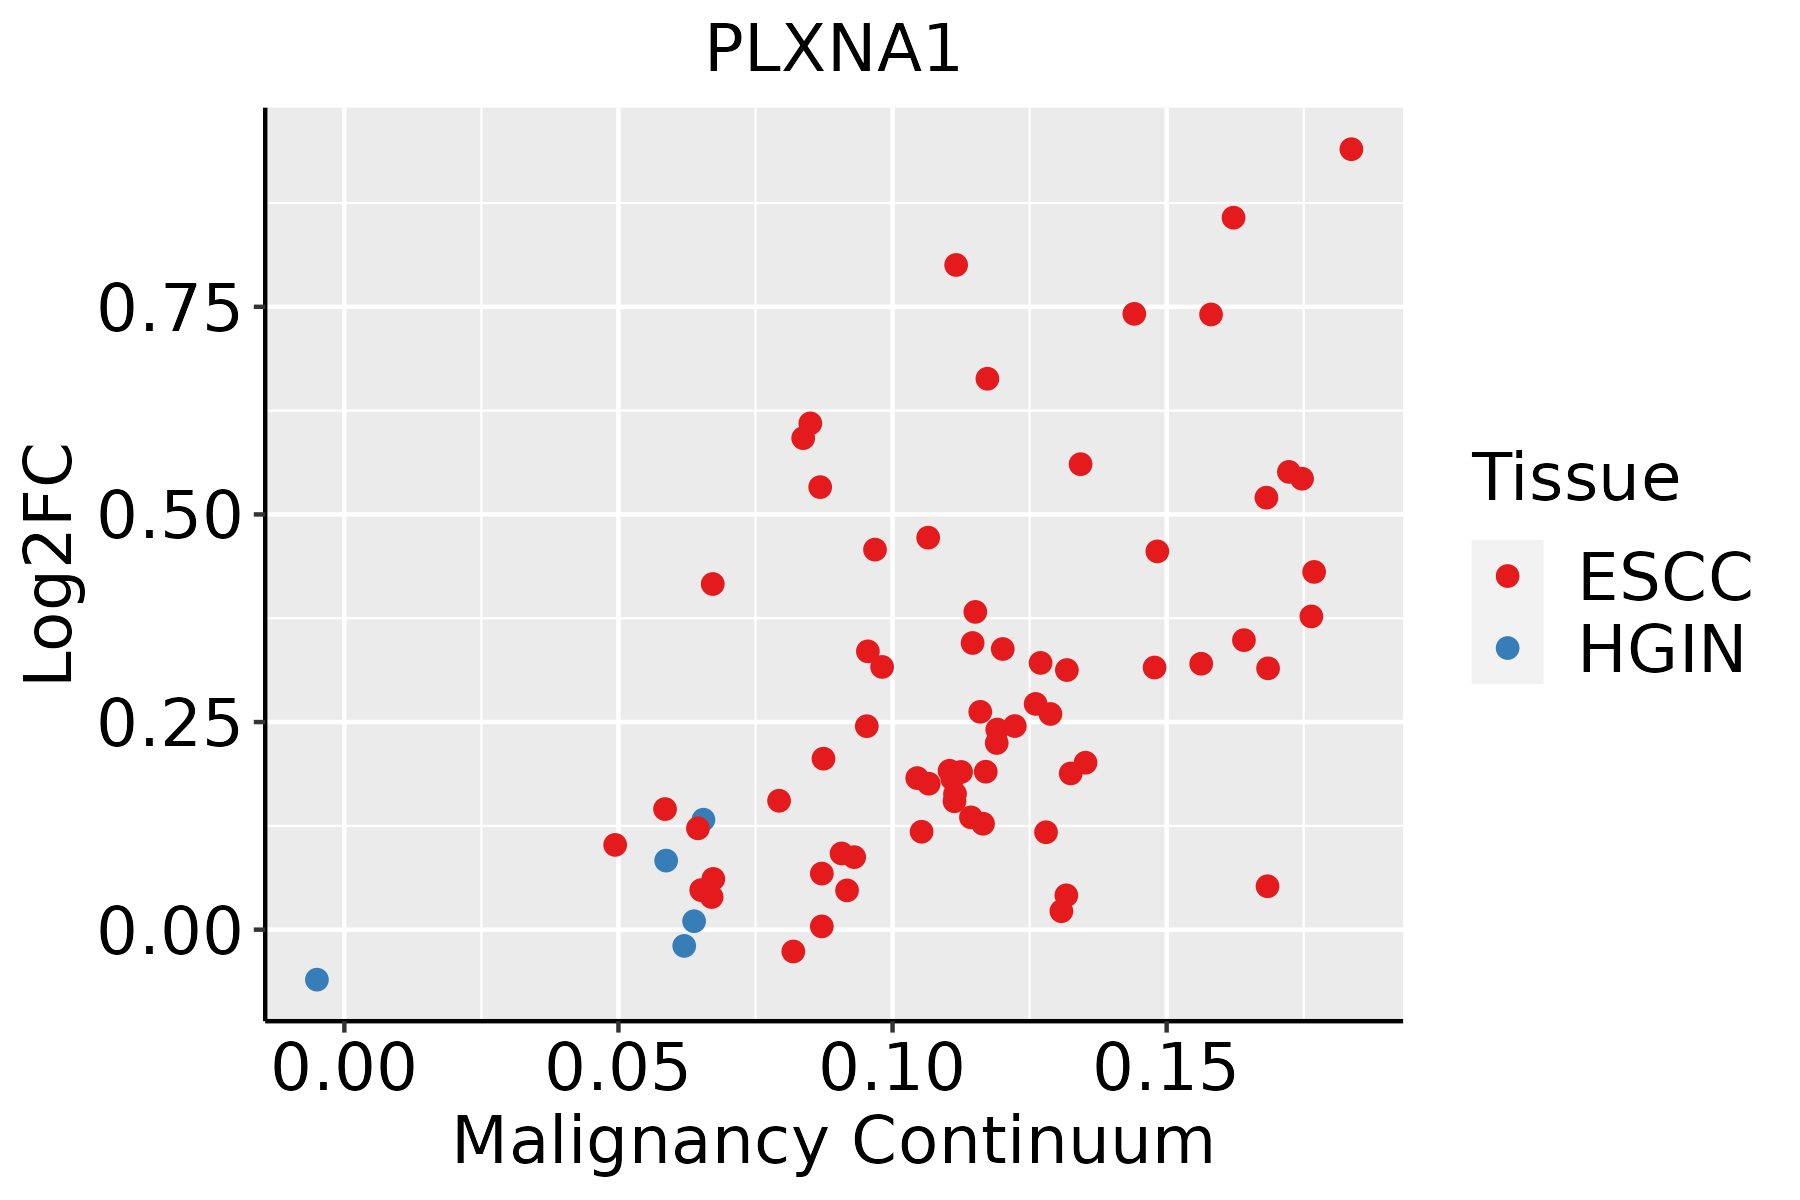 | ESCC: Esophageal squamous cell carcinoma |
| HGIN: High-grade intraepithelial neoplasias | ||
| LGIN: Low-grade intraepithelial neoplasias | ||
| Liver |  | HCC: Hepatocellular carcinoma |
| NAFLD: Non-alcoholic fatty liver disease | ||
| Oral Cavity | 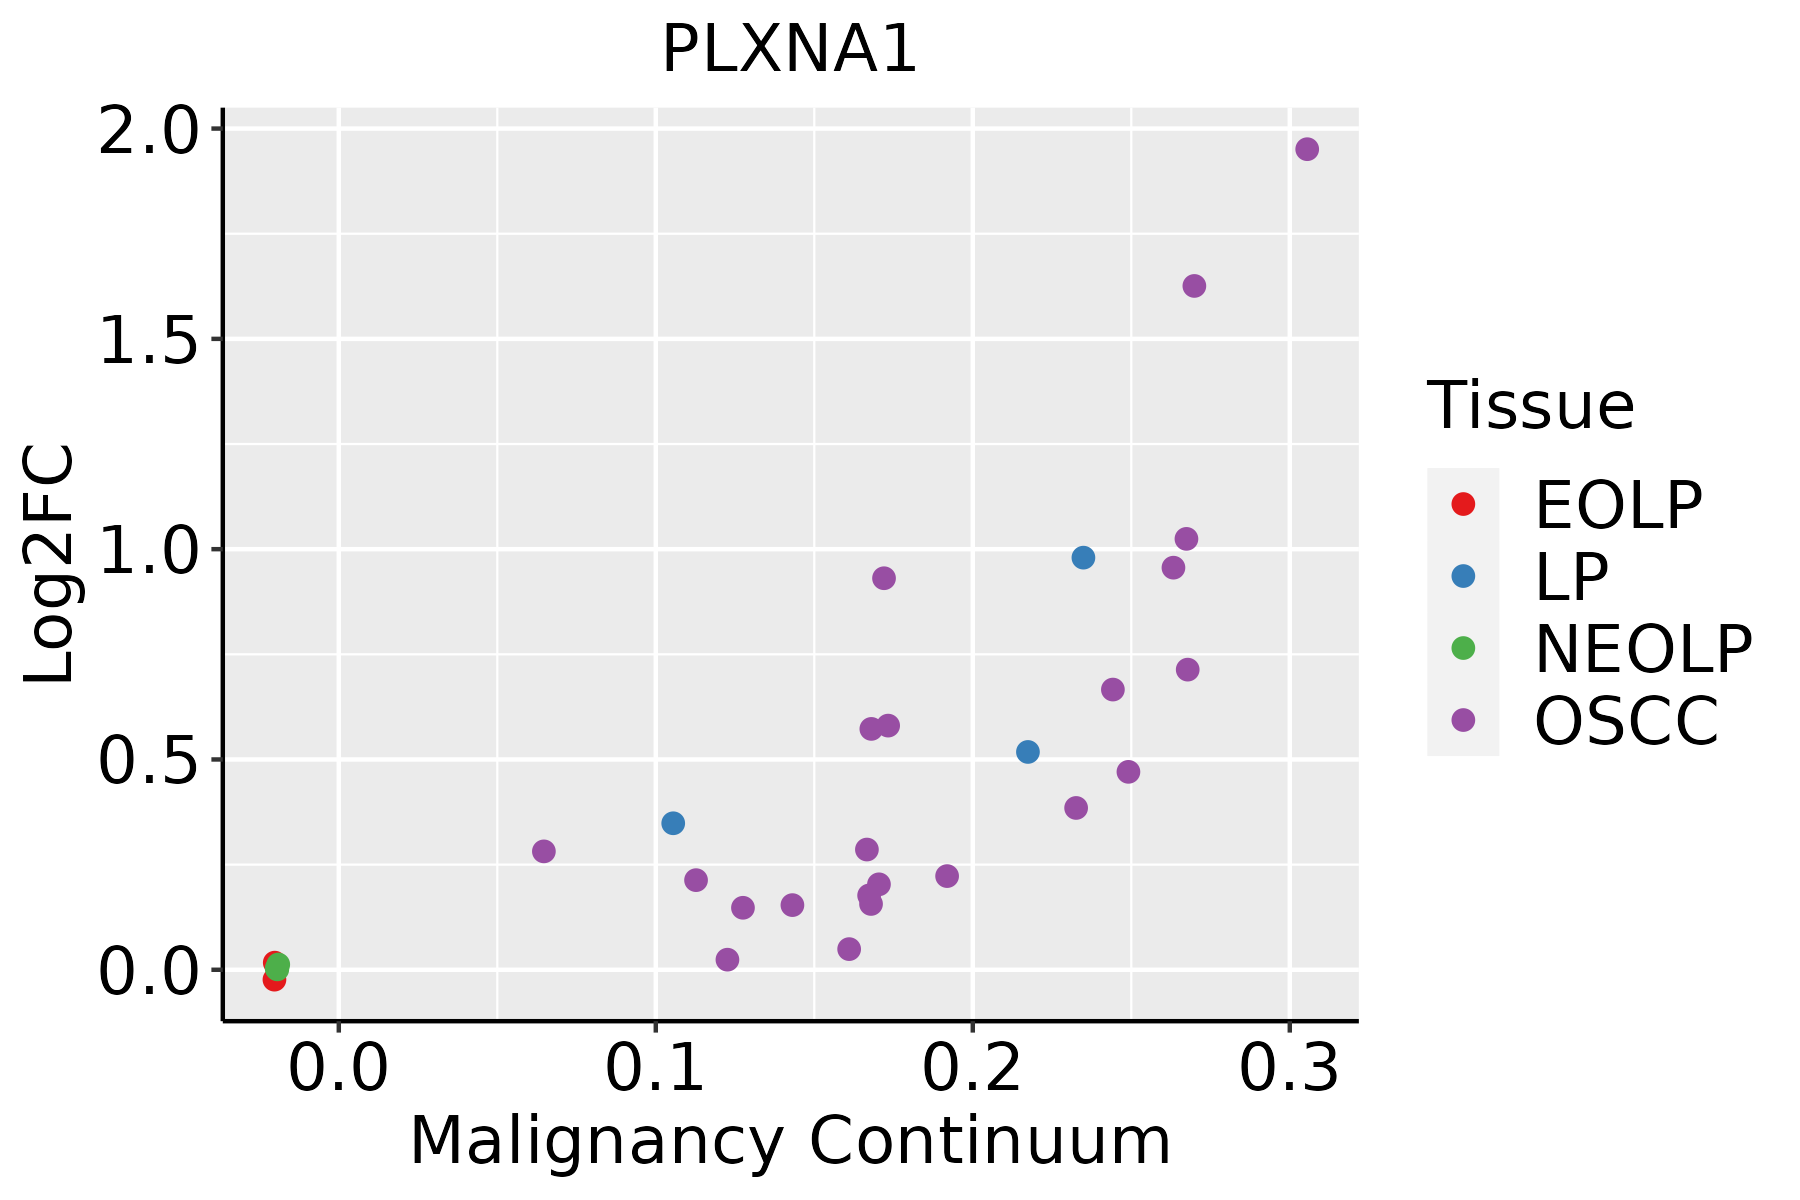 | EOLP: Erosive Oral lichen planus |
| LP: leukoplakia | ||
| NEOLP: Non-erosive oral lichen planus | ||
| OSCC: Oral squamous cell carcinoma | ||
| Skin | 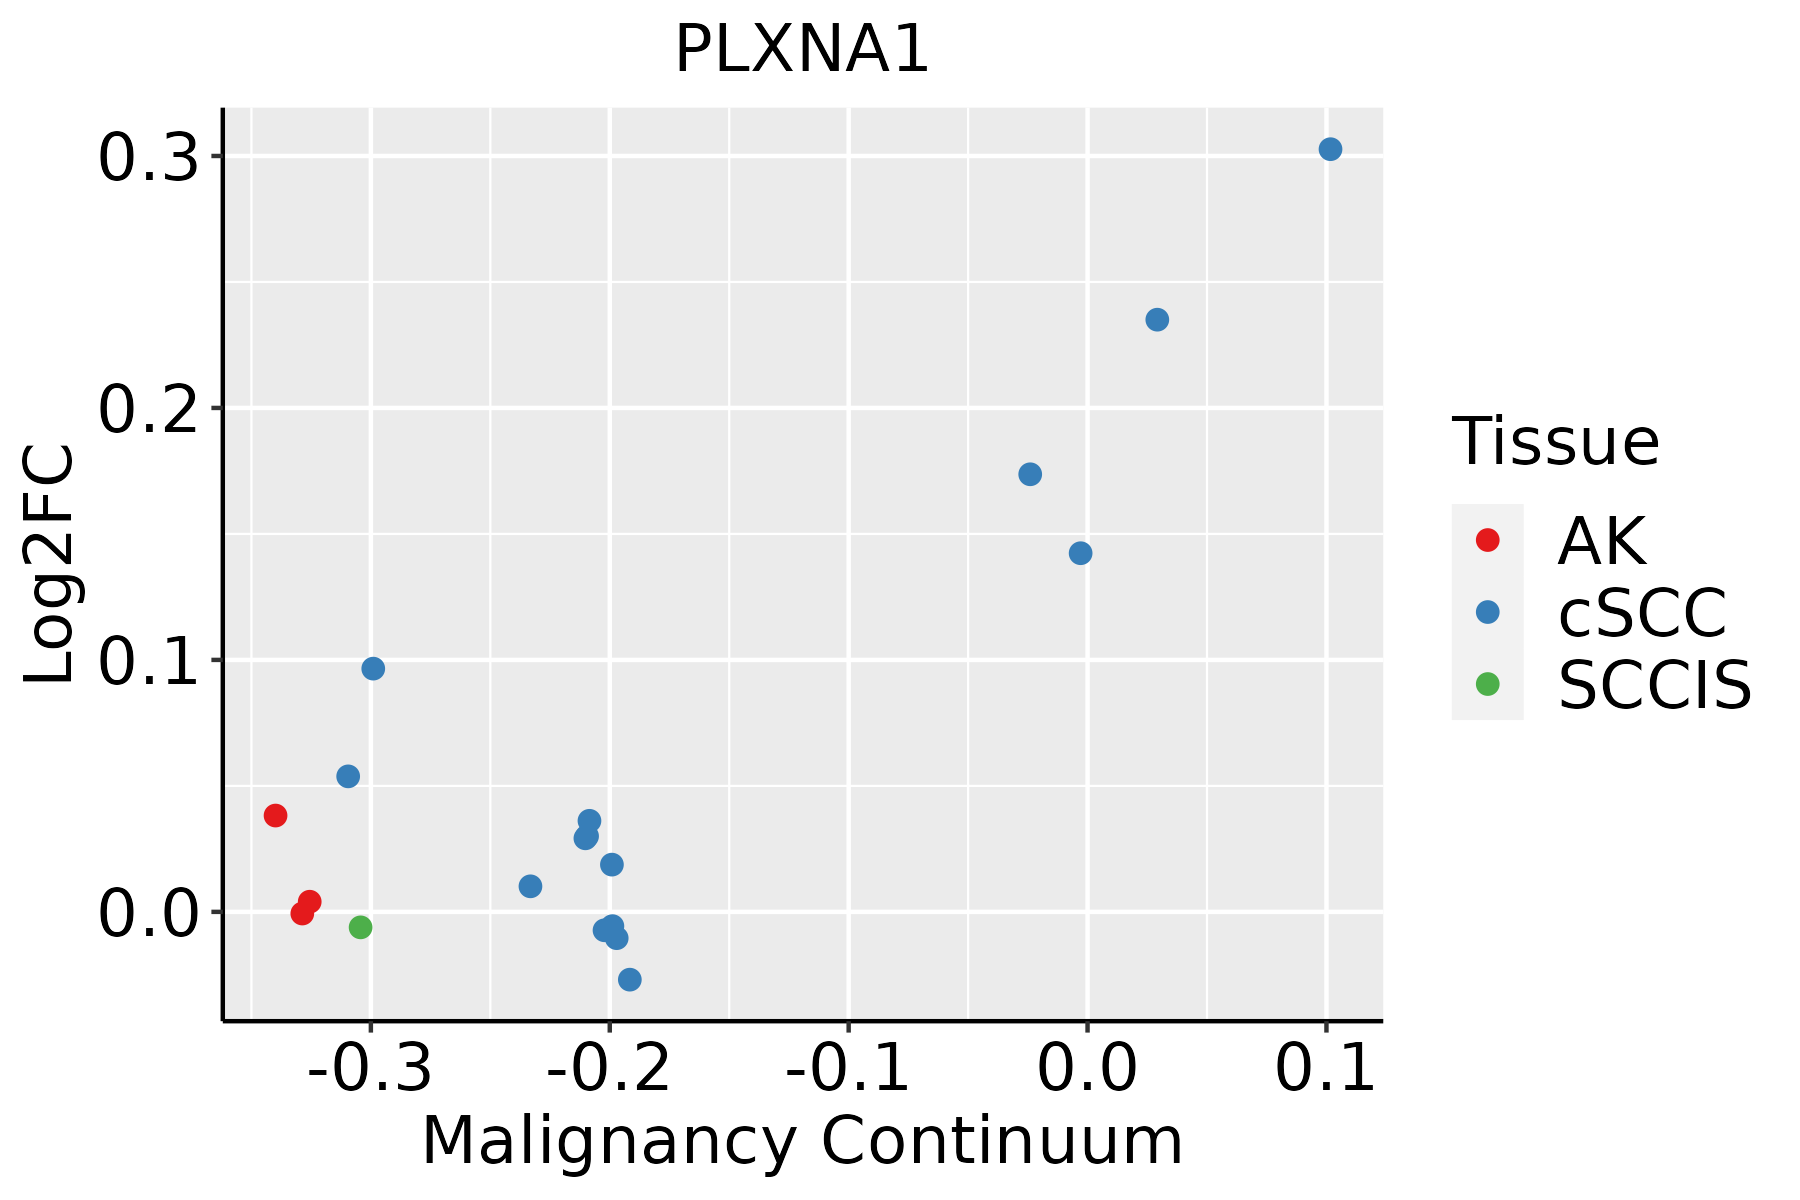 | AK: Actinic keratosis |
| cSCC: Cutaneous squamous cell carcinoma | ||
| SCCIS:squamous cell carcinoma in situ | ||
| Thyroid |  | ATC: Anaplastic thyroid cancer |
| HT: Hashimoto's thyroiditis | ||
| PTC: Papillary thyroid cancer |
| ∗log2FC in expression of this searched gene in stem-like cells from each diseased tissue sample relative to stem-like cells in normal samples in each tissue plotted against the malignancy continuum. Samples are colored based on if they are from different disease stage. |
Top |
Malignant transformation related pathway analysis |
| Find out the enriched GO biological processes and KEGG pathways involved in transition from healthy to precancer to cancer |
| Tissue | Disease Stage | Enriched GO biological Processes |
| Colorectum | AD |  |
| Colorectum | SER |  |
| Colorectum | MSS |  |
| Colorectum | MSI-H |  |
| Colorectum | FAP |  |
| ∗Top 15 enriched GO BP terms are showed in the bar plot of each disease state in each tissue. Each row represents a significant GO biological process which is colored according to the -log10(p.adjust). |
| Page: 1 2 3 4 5 6 7 8 9 |
| GO ID | Tissue | Disease Stage | Description | Gene Ratio | Bg Ratio | pvalue | p.adjust | Count |
| GO:0048732111 | Esophagus | ESCC | gland development | 269/8552 | 436/18723 | 7.81e-12 | 2.95e-10 | 269 |
| GO:0016049110 | Esophagus | ESCC | cell growth | 289/8552 | 482/18723 | 1.29e-10 | 3.77e-09 | 289 |
| GO:002260420 | Esophagus | ESCC | regulation of cell morphogenesis | 180/8552 | 309/18723 | 5.19e-06 | 5.45e-05 | 180 |
| GO:002261216 | Esophagus | ESCC | gland morphogenesis | 78/8552 | 118/18723 | 5.83e-06 | 6.03e-05 | 78 |
| GO:003134616 | Esophagus | ESCC | positive regulation of cell projection organization | 201/8552 | 353/18723 | 1.19e-05 | 1.11e-04 | 201 |
| GO:001072010 | Esophagus | ESCC | positive regulation of cell development | 172/8552 | 298/18723 | 1.74e-05 | 1.55e-04 | 172 |
| GO:005076710 | Esophagus | ESCC | regulation of neurogenesis | 203/8552 | 364/18723 | 6.10e-05 | 4.68e-04 | 203 |
| GO:00507697 | Esophagus | ESCC | positive regulation of neurogenesis | 131/8552 | 225/18723 | 9.71e-05 | 6.90e-04 | 131 |
| GO:006156415 | Esophagus | ESCC | axon development | 251/8552 | 467/18723 | 2.41e-04 | 1.49e-03 | 251 |
| GO:001097516 | Esophagus | ESCC | regulation of neuron projection development | 240/8552 | 445/18723 | 2.48e-04 | 1.53e-03 | 240 |
| GO:000836018 | Esophagus | ESCC | regulation of cell shape | 92/8552 | 154/18723 | 3.00e-04 | 1.81e-03 | 92 |
| GO:00519606 | Esophagus | ESCC | regulation of nervous system development | 237/8552 | 443/18723 | 5.02e-04 | 2.78e-03 | 237 |
| GO:006056010 | Esophagus | ESCC | developmental growth involved in morphogenesis | 131/8552 | 234/18723 | 9.28e-04 | 4.73e-03 | 131 |
| GO:00519625 | Esophagus | ESCC | positive regulation of nervous system development | 149/8552 | 272/18723 | 1.50e-03 | 7.06e-03 | 149 |
| GO:000740915 | Esophagus | ESCC | axonogenesis | 219/8552 | 418/18723 | 3.14e-03 | 1.31e-02 | 219 |
| GO:00507728 | Esophagus | ESCC | positive regulation of axonogenesis | 48/8552 | 79/18723 | 4.93e-03 | 1.89e-02 | 48 |
| GO:004308715 | Esophagus | ESCC | regulation of GTPase activity | 183/8552 | 348/18723 | 5.34e-03 | 2.00e-02 | 183 |
| GO:004858810 | Esophagus | ESCC | developmental cell growth | 125/8552 | 234/18723 | 1.01e-02 | 3.46e-02 | 125 |
| GO:00017639 | Esophagus | ESCC | morphogenesis of a branching structure | 106/8552 | 196/18723 | 1.08e-02 | 3.66e-02 | 106 |
| GO:002260422 | Liver | HCC | regulation of cell morphogenesis | 188/7958 | 309/18723 | 4.84e-11 | 1.82e-09 | 188 |
| Page: 1 2 3 4 5 6 7 |
| Pathway ID | Tissue | Disease Stage | Description | Gene Ratio | Bg Ratio | pvalue | p.adjust | qvalue | Count |
| hsa0436016 | Esophagus | ESCC | Axon guidance | 108/4205 | 182/8465 | 5.13e-03 | 1.30e-02 | 6.67e-03 | 108 |
| hsa0436017 | Esophagus | ESCC | Axon guidance | 108/4205 | 182/8465 | 5.13e-03 | 1.30e-02 | 6.67e-03 | 108 |
| hsa0436014 | Oral cavity | OSCC | Axon guidance | 97/3704 | 182/8465 | 5.59e-03 | 1.33e-02 | 6.76e-03 | 97 |
| hsa0436015 | Oral cavity | OSCC | Axon guidance | 97/3704 | 182/8465 | 5.59e-03 | 1.33e-02 | 6.76e-03 | 97 |
| Page: 1 |
Top |
Cell-cell communication analysis |
| Identification of potential cell-cell interactions between two cell types and their ligand-receptor pairs for different disease states |
| Ligand | Receptor | LRpair | Pathway | Tissue | Disease Stage |
| SEMA4A | NRP1_PLXNA1 | SEMA4A_NRP1_PLXNA1 | SEMA4 | CRC | MSI-H |
| SEMA3B | NRP1_PLXNA1 | SEMA3B_NRP1_PLXNA1 | SEMA3 | CRC | MSI-H |
| SEMA3C | NRP1_PLXNA1 | SEMA3C_NRP1_PLXNA1 | SEMA3 | CRC | MSI-H |
| SEMA5A | PLXNA1 | SEMA5A_PLXNA1 | SEMA5 | CRC | MSI-H |
| SEMA3A | NRP1_PLXNA1 | SEMA3A_NRP1_PLXNA1 | SEMA3 | HNSCC | OSCC |
| SEMA3C | NRP1_PLXNA1 | SEMA3C_NRP1_PLXNA1 | SEMA3 | HNSCC | OSCC |
| SEMA3D | NRP1_PLXNA1 | SEMA3D_NRP1_PLXNA1 | SEMA3 | HNSCC | OSCC |
| SEMA3C | NRP2_PLXNA1 | SEMA3C_NRP2_PLXNA1 | SEMA3 | HNSCC | OSCC |
| SEMA3D | NRP2_PLXNA1 | SEMA3D_NRP2_PLXNA1 | SEMA3 | HNSCC | OSCC |
| SEMA3F | NRP2_PLXNA1 | SEMA3F_NRP2_PLXNA1 | SEMA3 | HNSCC | OSCC |
| SEMA3G | NRP2_PLXNA1 | SEMA3G_NRP2_PLXNA1 | SEMA3 | HNSCC | OSCC |
| SEMA4A | NRP1_PLXNA1 | SEMA4A_NRP1_PLXNA1 | SEMA4 | HNSCC | OSCC |
| SEMA5A | PLXNA1 | SEMA5A_PLXNA1 | SEMA5 | HNSCC | OSCC |
| SEMA3C | NRP2_PLXNA1 | SEMA3C_NRP2_PLXNA1 | SEMA3 | HNSCC | Precancer |
| SEMA3D | NRP2_PLXNA1 | SEMA3D_NRP2_PLXNA1 | SEMA3 | HNSCC | Precancer |
| SEMA3F | NRP2_PLXNA1 | SEMA3F_NRP2_PLXNA1 | SEMA3 | HNSCC | Precancer |
| SEMA3G | NRP2_PLXNA1 | SEMA3G_NRP2_PLXNA1 | SEMA3 | HNSCC | Precancer |
| SEMA6D | PLXNA1 | SEMA6D_PLXNA1 | SEMA6 | HNSCC | Precancer |
| SEMA5A | PLXNA1 | SEMA5A_PLXNA1 | SEMA5 | HNSCC | Precancer |
| SEMA6D | PLXNA1 | SEMA6D_PLXNA1 | SEMA6 | Lung | AAH |
| Page: 1 |
Top |
Single-cell gene regulatory network inference analysis |
| Find out the significant the regulons (TFs) and the target genes of each regulon across cell types for different disease states |
| TF | Cell Type | Tissue | Disease Stage | Target Gene | RSS | Regulon Activity |
| ∗The dot plots of a searched regulon are shown for all cell subpopulations in each disease state of each tissue based on the regulon specific score inferred using pySCENIC and by calculating the average expression. |
| Page: 1 |
Top |
Somatic mutation of malignant transformation related genes |
| Annotation of somatic variants for genes involved in malignant transformation |
| Hugo Symbol | Variant Class | Variant Classification | dbSNP RS | HGVSc | HGVSp | HGVSp Short | SWISSPROT | BIOTYPE | SIFT | PolyPhen | Tumor Sample Barcode | Tissue | Histology | Sex | Age | Stage | Therapy Types | Drugs | Outcome |
| PLXNA1 | SNV | Missense_Mutation | novel | c.1907N>T | p.Arg636Leu | p.R636L | Q9UIW2 | protein_coding | tolerated(0.66) | benign(0.015) | TCGA-A7-A0DB-01 | Breast | breast invasive carcinoma | Female | <65 | I/II | Hormone Therapy | arimidex | SD |
| PLXNA1 | SNV | Missense_Mutation | novel | c.2369N>T | p.Trp790Leu | p.W790L | Q9UIW2 | protein_coding | deleterious(0) | benign(0.027) | TCGA-A7-A0DB-01 | Breast | breast invasive carcinoma | Female | <65 | I/II | Hormone Therapy | arimidex | SD |
| PLXNA1 | SNV | Missense_Mutation | novel | c.3751G>A | p.Gly1251Arg | p.G1251R | Q9UIW2 | protein_coding | deleterious(0) | possibly_damaging(0.454) | TCGA-AC-A23G-01 | Breast | breast invasive carcinoma | Female | >=65 | I/II | Chemotherapy | cytoxan | CR |
| PLXNA1 | SNV | Missense_Mutation | c.353N>A | p.Leu118Gln | p.L118Q | Q9UIW2 | protein_coding | deleterious(0) | probably_damaging(1) | TCGA-AN-A0FL-01 | Breast | breast invasive carcinoma | Female | <65 | I/II | Unknown | Unknown | SD | |
| PLXNA1 | SNV | Missense_Mutation | c.5656N>A | p.Glu1886Lys | p.E1886K | Q9UIW2 | protein_coding | deleterious(0.01) | benign(0.111) | TCGA-AO-A0J7-01 | Breast | breast invasive carcinoma | Female | >=65 | I/II | Chemotherapy | doxorubicin | SD | |
| PLXNA1 | SNV | Missense_Mutation | c.3988C>T | p.Arg1330Trp | p.R1330W | Q9UIW2 | protein_coding | deleterious(0) | probably_damaging(1) | TCGA-AR-A0U2-01 | Breast | breast invasive carcinoma | Female | <65 | III/IV | Hormone Therapy | tamoxiphen | PD | |
| PLXNA1 | SNV | Missense_Mutation | novel | c.1394N>T | p.Ser465Leu | p.S465L | Q9UIW2 | protein_coding | tolerated(0.31) | benign(0.02) | TCGA-BH-A0B6-01 | Breast | breast invasive carcinoma | Female | <65 | I/II | Unknown | Unknown | SD |
| PLXNA1 | SNV | Missense_Mutation | novel | c.4295N>A | p.Arg1432Gln | p.R1432Q | Q9UIW2 | protein_coding | deleterious(0) | probably_damaging(0.999) | TCGA-BH-A0C7-01 | Breast | breast invasive carcinoma | Female | <65 | I/II | Chemotherapy | adriamycin | CR |
| PLXNA1 | SNV | Missense_Mutation | rs755897446 | c.2149N>A | p.Val717Met | p.V717M | Q9UIW2 | protein_coding | deleterious(0.01) | benign(0.1) | TCGA-BH-A202-01 | Breast | breast invasive carcinoma | Female | <65 | I/II | Chemotherapy | carboplatin | CR |
| PLXNA1 | SNV | Missense_Mutation | c.5262C>G | p.Ile1754Met | p.I1754M | Q9UIW2 | protein_coding | deleterious(0) | probably_damaging(0.977) | TCGA-EW-A1J5-01 | Breast | breast invasive carcinoma | Female | <65 | I/II | Chemotherapy | adriamycin | SD |
| Page: 1 2 3 4 5 6 7 8 9 10 11 12 13 14 15 16 17 18 19 20 21 22 23 |
Top |
Related drugs of malignant transformation related genes |
| Identification of chemicals and drugs interact with genes involved in malignant transfromation |
| (DGIdb 4.0) |
| Entrez ID | Symbol | Category | Interaction Types | Drug Claim Name | Drug Name | PMIDs |
| Page: 1 |

Copyright 2023-Present -The University of Texas Health Science Center at Houston |