
|
|||||
|
 | |
| |
| |
| |
| |
| |
|
Gene: PLSCR4 |
Gene summary for PLSCR4 |
| Gene information | Species | Human | Gene symbol | PLSCR4 | Gene ID | 57088 |
| Gene name | phospholipid scramblase 4 | |
| Gene Alias | TRA1 | |
| Cytomap | 3q24 | |
| Gene Type | protein-coding | GO ID | GO:0002237 | UniProtAcc | Q9NRQ2 |
Top |
Malignant transformation analysis |
| Identification of the aberrant gene expression in precancerous and cancerous lesions by comparing the gene expression of stem-like cells in diseased tissues with normal stem cells |
| Entrez ID | Symbol | Replicates | Species | Organ | Tissue | Adj P-value | Log2FC | Malignancy |
| 57088 | PLSCR4 | LZE8T | Human | Esophagus | ESCC | 1.59e-03 | -6.62e-03 | 0.067 |
| 57088 | PLSCR4 | P1T-E | Human | Esophagus | ESCC | 9.76e-05 | 1.33e-01 | 0.0875 |
| 57088 | PLSCR4 | P2T-E | Human | Esophagus | ESCC | 1.16e-24 | 3.66e-01 | 0.1177 |
| 57088 | PLSCR4 | P5T-E | Human | Esophagus | ESCC | 6.08e-03 | 4.40e-02 | 0.1327 |
| 57088 | PLSCR4 | P8T-E | Human | Esophagus | ESCC | 7.03e-16 | 2.64e-01 | 0.0889 |
| 57088 | PLSCR4 | P9T-E | Human | Esophagus | ESCC | 6.06e-08 | 1.34e-01 | 0.1131 |
| 57088 | PLSCR4 | P10T-E | Human | Esophagus | ESCC | 1.29e-11 | 1.17e-01 | 0.116 |
| 57088 | PLSCR4 | P11T-E | Human | Esophagus | ESCC | 3.17e-03 | 3.76e-01 | 0.1426 |
| 57088 | PLSCR4 | P12T-E | Human | Esophagus | ESCC | 3.04e-05 | 1.70e-02 | 0.1122 |
| 57088 | PLSCR4 | P15T-E | Human | Esophagus | ESCC | 2.20e-09 | 1.25e-02 | 0.1149 |
| 57088 | PLSCR4 | P16T-E | Human | Esophagus | ESCC | 7.35e-03 | -7.12e-02 | 0.1153 |
| 57088 | PLSCR4 | P20T-E | Human | Esophagus | ESCC | 1.05e-23 | 8.06e-01 | 0.1124 |
| 57088 | PLSCR4 | P21T-E | Human | Esophagus | ESCC | 2.44e-03 | -1.06e-01 | 0.1617 |
| 57088 | PLSCR4 | P22T-E | Human | Esophagus | ESCC | 1.01e-05 | -6.01e-02 | 0.1236 |
| 57088 | PLSCR4 | P23T-E | Human | Esophagus | ESCC | 6.70e-04 | 4.25e-01 | 0.108 |
| 57088 | PLSCR4 | P24T-E | Human | Esophagus | ESCC | 1.58e-08 | 4.21e-02 | 0.1287 |
| 57088 | PLSCR4 | P26T-E | Human | Esophagus | ESCC | 6.82e-06 | -9.15e-02 | 0.1276 |
| 57088 | PLSCR4 | P27T-E | Human | Esophagus | ESCC | 2.15e-14 | 3.85e-02 | 0.1055 |
| 57088 | PLSCR4 | P28T-E | Human | Esophagus | ESCC | 9.24e-06 | 1.61e-02 | 0.1149 |
| 57088 | PLSCR4 | P30T-E | Human | Esophagus | ESCC | 2.02e-07 | 3.21e-01 | 0.137 |
| Page: 1 2 3 |
| Tissue | Expression Dynamics | Abbreviation |
| Esophagus | 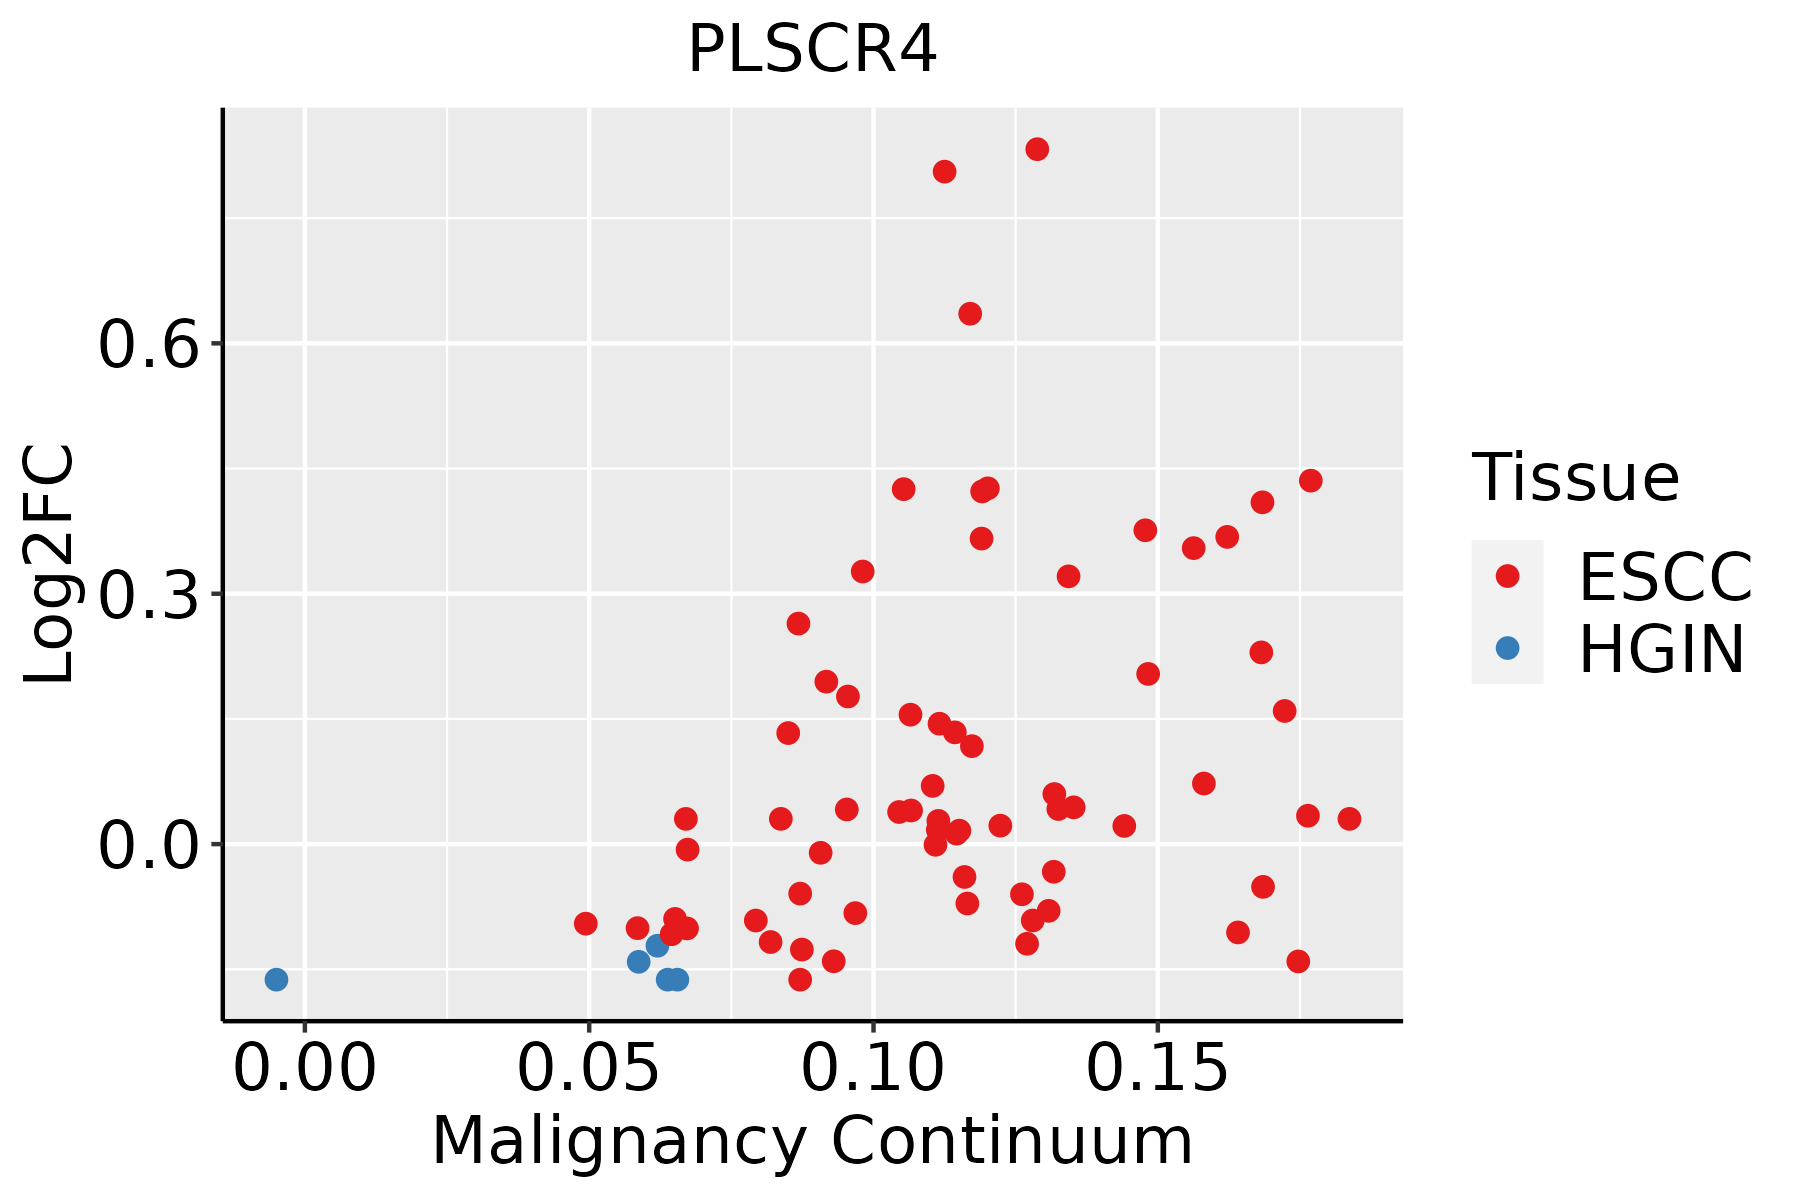 | ESCC: Esophageal squamous cell carcinoma |
| HGIN: High-grade intraepithelial neoplasias | ||
| LGIN: Low-grade intraepithelial neoplasias |
| ∗log2FC in expression of this searched gene in stem-like cells from each diseased tissue sample relative to stem-like cells in normal samples in each tissue plotted against the malignancy continuum. Samples are colored based on if they are from different disease stage. |
Top |
Malignant transformation related pathway analysis |
| Find out the enriched GO biological processes and KEGG pathways involved in transition from healthy to precancer to cancer |
| Tissue | Disease Stage | Enriched GO biological Processes |
| Colorectum | AD |  |
| Colorectum | SER |  |
| Colorectum | MSS |  |
| Colorectum | MSI-H |  |
| Colorectum | FAP |  |
| ∗Top 15 enriched GO BP terms are showed in the bar plot of each disease state in each tissue. Each row represents a significant GO biological process which is colored according to the -log10(p.adjust). |
| Page: 1 2 3 4 5 6 7 8 9 |
| GO ID | Tissue | Disease Stage | Description | Gene Ratio | Bg Ratio | pvalue | p.adjust | Count |
| GO:003249619 | Esophagus | ESCC | response to lipopolysaccharide | 191/8552 | 343/18723 | 1.11e-04 | 7.73e-04 | 191 |
| GO:000223719 | Esophagus | ESCC | response to molecule of bacterial origin | 194/8552 | 363/18723 | 1.64e-03 | 7.61e-03 | 194 |
| GO:007122215 | Esophagus | ESCC | cellular response to lipopolysaccharide | 113/8552 | 209/18723 | 8.79e-03 | 3.10e-02 | 113 |
| GO:007121617 | Esophagus | ESCC | cellular response to biotic stimulus | 131/8552 | 246/18723 | 9.85e-03 | 3.39e-02 | 131 |
| Page: 1 |
| Pathway ID | Tissue | Disease Stage | Description | Gene Ratio | Bg Ratio | pvalue | p.adjust | qvalue | Count |
| Page: 1 |
Top |
Cell-cell communication analysis |
| Identification of potential cell-cell interactions between two cell types and their ligand-receptor pairs for different disease states |
| Ligand | Receptor | LRpair | Pathway | Tissue | Disease Stage |
| Page: 1 |
Top |
Single-cell gene regulatory network inference analysis |
| Find out the significant the regulons (TFs) and the target genes of each regulon across cell types for different disease states |
| TF | Cell Type | Tissue | Disease Stage | Target Gene | RSS | Regulon Activity |
| ∗The dot plots of a searched regulon are shown for all cell subpopulations in each disease state of each tissue based on the regulon specific score inferred using pySCENIC and by calculating the average expression. |
| Page: 1 |
Top |
Somatic mutation of malignant transformation related genes |
| Annotation of somatic variants for genes involved in malignant transformation |
| Hugo Symbol | Variant Class | Variant Classification | dbSNP RS | HGVSc | HGVSp | HGVSp Short | SWISSPROT | BIOTYPE | SIFT | PolyPhen | Tumor Sample Barcode | Tissue | Histology | Sex | Age | Stage | Therapy Types | Drugs | Outcome |
| PLSCR4 | SNV | Missense_Mutation | novel | c.958N>G | p.Phe320Val | p.F320V | Q9NRQ2 | protein_coding | deleterious(0) | possibly_damaging(0.572) | TCGA-AC-A5XU-01 | Breast | breast invasive carcinoma | Female | >=65 | I/II | Hormone Therapy | letrozole | SD |
| PLSCR4 | SNV | Missense_Mutation | novel | c.770C>T | p.Ser257Leu | p.S257L | Q9NRQ2 | protein_coding | deleterious(0.01) | probably_damaging(0.925) | TCGA-D8-A73U-01 | Breast | breast invasive carcinoma | Female | >=65 | I/II | Hormone Therapy | tamoxiphen | SD |
| PLSCR4 | insertion | In_Frame_Ins | novel | c.517_518insAAGATCGCACCACTGCACTCCAGCCTGGGCCACCAGAGCAAAATT | p.Pro173delinsGlnAspArgThrThrAlaLeuGlnProGlyProProGluGlnAsnSer | p.P173delinsQDRTTALQPGPPEQNS | Q9NRQ2 | protein_coding | TCGA-A8-A07R-01 | Breast | breast invasive carcinoma | Female | >=65 | III/IV | Ancillary | zoledronic | SD | ||
| PLSCR4 | SNV | Missense_Mutation | novel | c.567G>A | p.Met189Ile | p.M189I | Q9NRQ2 | protein_coding | tolerated(0.06) | benign(0.145) | TCGA-2W-A8YY-01 | Cervix | cervical & endocervical cancer | Female | <65 | I/II | Chemotherapy | cisplatin | CR |
| PLSCR4 | SNV | Missense_Mutation | novel | c.877G>C | p.Asp293His | p.D293H | Q9NRQ2 | protein_coding | deleterious(0) | possibly_damaging(0.65) | TCGA-Q1-A73O-01 | Cervix | cervical & endocervical cancer | Female | <65 | I/II | Chemotherapy | cisplatin | CR |
| PLSCR4 | SNV | Missense_Mutation | c.979N>T | p.Arg327Cys | p.R327C | Q9NRQ2 | protein_coding | deleterious(0.01) | benign(0.18) | TCGA-AA-3684-01 | Colorectum | colon adenocarcinoma | Female | >=65 | III/IV | Unknown | Unknown | SD | |
| PLSCR4 | SNV | Missense_Mutation | c.821N>T | p.Ser274Ile | p.S274I | Q9NRQ2 | protein_coding | deleterious(0) | possibly_damaging(0.478) | TCGA-AA-3977-01 | Colorectum | colon adenocarcinoma | Male | >=65 | I/II | Unknown | Unknown | SD | |
| PLSCR4 | SNV | Missense_Mutation | novel | c.746N>T | p.Pro249Leu | p.P249L | Q9NRQ2 | protein_coding | deleterious(0.01) | probably_damaging(0.996) | TCGA-CA-5797-01 | Colorectum | colon adenocarcinoma | Male | <65 | I/II | Unknown | Unknown | SD |
| PLSCR4 | SNV | Missense_Mutation | novel | c.437N>C | p.Lys146Thr | p.K146T | Q9NRQ2 | protein_coding | deleterious(0.01) | probably_damaging(0.999) | TCGA-CA-6717-01 | Colorectum | colon adenocarcinoma | Male | <65 | I/II | Chemotherapy | oxaliplatin | CR |
| PLSCR4 | SNV | Missense_Mutation | c.518C>T | p.Pro173Leu | p.P173L | Q9NRQ2 | protein_coding | deleterious(0.02) | benign(0.272) | TCGA-CK-5916-01 | Colorectum | colon adenocarcinoma | Female | >=65 | I/II | Unknown | Unknown | PD |
| Page: 1 2 3 4 5 6 7 |
Top |
Related drugs of malignant transformation related genes |
| Identification of chemicals and drugs interact with genes involved in malignant transfromation |
| (DGIdb 4.0) |
| Entrez ID | Symbol | Category | Interaction Types | Drug Claim Name | Drug Name | PMIDs |
| Page: 1 |

Copyright 2023-Present -The University of Texas Health Science Center at Houston |