
|
|||||
|
 | |
| |
| |
| |
| |
| |
|
Gene: PLS3 |
Gene summary for PLS3 |
| Gene information | Species | Human | Gene symbol | PLS3 | Gene ID | 5358 |
| Gene name | plastin 3 | |
| Gene Alias | BMND18 | |
| Cytomap | Xq23 | |
| Gene Type | protein-coding | GO ID | GO:0001501 | UniProtAcc | P13797 |
Top |
Malignant transformation analysis |
| Identification of the aberrant gene expression in precancerous and cancerous lesions by comparing the gene expression of stem-like cells in diseased tissues with normal stem cells |
| Entrez ID | Symbol | Replicates | Species | Organ | Tissue | Adj P-value | Log2FC | Malignancy |
| 5358 | PLS3 | CA_HPV_1 | Human | Cervix | CC | 2.96e-02 | -1.08e-01 | 0.0264 |
| 5358 | PLS3 | CA_HPV_2 | Human | Cervix | CC | 1.02e-02 | 2.00e-01 | 0.0391 |
| 5358 | PLS3 | CA_HPV_3 | Human | Cervix | CC | 1.73e-03 | 1.60e-01 | 0.0414 |
| 5358 | PLS3 | CCI_1 | Human | Cervix | CC | 7.59e-04 | 9.93e-01 | 0.528 |
| 5358 | PLS3 | Tumor | Human | Cervix | CC | 7.78e-30 | 6.24e-01 | 0.1241 |
| 5358 | PLS3 | sample3 | Human | Cervix | CC | 4.68e-46 | 7.80e-01 | 0.1387 |
| 5358 | PLS3 | T3 | Human | Cervix | CC | 1.12e-46 | 7.49e-01 | 0.1389 |
| 5358 | PLS3 | LZE4T | Human | Esophagus | ESCC | 1.92e-29 | 1.13e+00 | 0.0811 |
| 5358 | PLS3 | LZE7T | Human | Esophagus | ESCC | 6.53e-15 | 1.03e+00 | 0.0667 |
| 5358 | PLS3 | LZE8T | Human | Esophagus | ESCC | 2.88e-03 | 2.24e-01 | 0.067 |
| 5358 | PLS3 | LZE20T | Human | Esophagus | ESCC | 5.42e-13 | 7.07e-01 | 0.0662 |
| 5358 | PLS3 | LZE22D1 | Human | Esophagus | HGIN | 8.76e-05 | 1.84e-01 | 0.0595 |
| 5358 | PLS3 | LZE22T | Human | Esophagus | ESCC | 5.13e-10 | 1.58e+00 | 0.068 |
| 5358 | PLS3 | LZE24T | Human | Esophagus | ESCC | 8.05e-25 | 9.65e-01 | 0.0596 |
| 5358 | PLS3 | LZE6T | Human | Esophagus | ESCC | 5.81e-03 | 4.41e-01 | 0.0845 |
| 5358 | PLS3 | P1T-E | Human | Esophagus | ESCC | 9.86e-06 | 6.29e-01 | 0.0875 |
| 5358 | PLS3 | P2T-E | Human | Esophagus | ESCC | 9.17e-39 | 7.54e-01 | 0.1177 |
| 5358 | PLS3 | P4T-E | Human | Esophagus | ESCC | 1.74e-30 | 7.09e-01 | 0.1323 |
| 5358 | PLS3 | P5T-E | Human | Esophagus | ESCC | 3.93e-50 | 1.19e+00 | 0.1327 |
| 5358 | PLS3 | P8T-E | Human | Esophagus | ESCC | 7.09e-51 | 1.15e+00 | 0.0889 |
| Page: 1 2 3 4 5 6 7 8 |
| Tissue | Expression Dynamics | Abbreviation |
| Cervix | 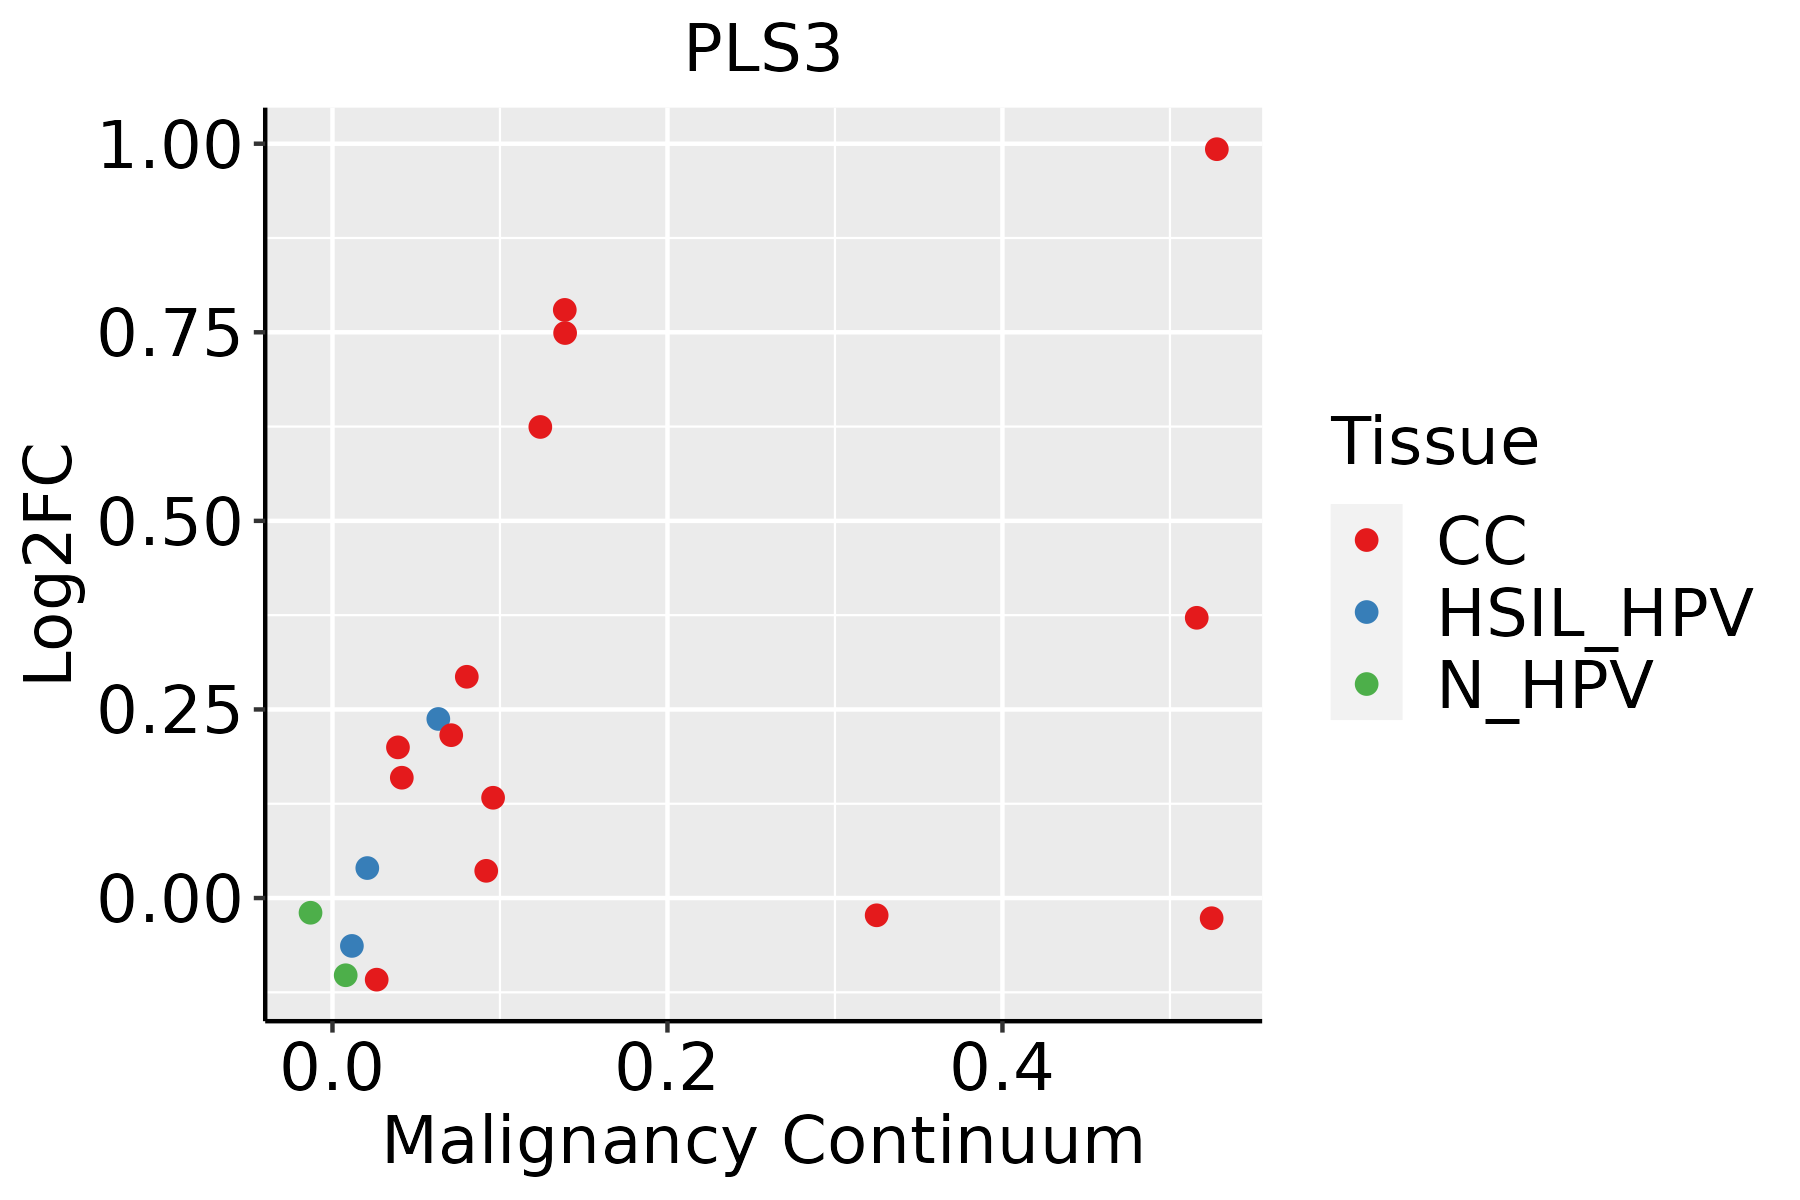 | CC: Cervix cancer |
| HSIL_HPV: HPV-infected high-grade squamous intraepithelial lesions | ||
| N_HPV: HPV-infected normal cervix | ||
| Esophagus | 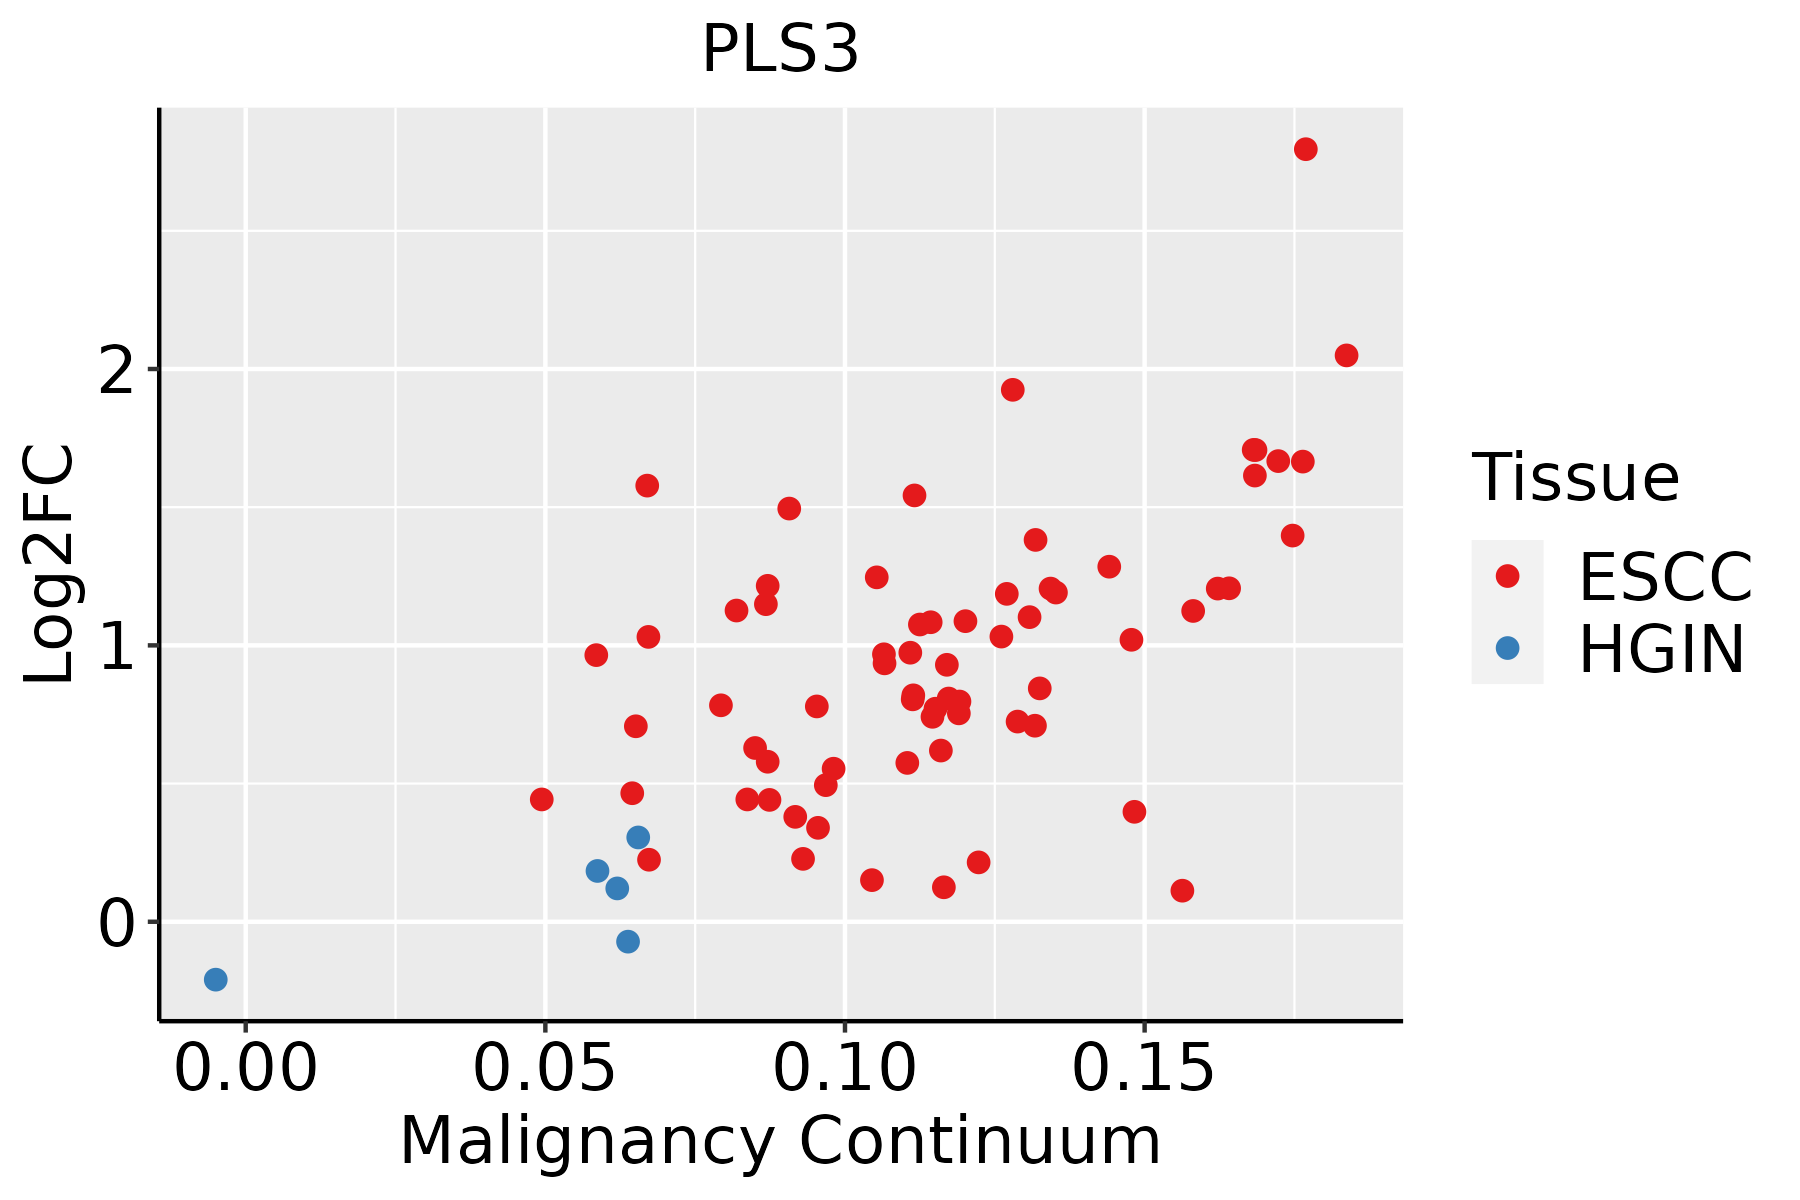 | ESCC: Esophageal squamous cell carcinoma |
| HGIN: High-grade intraepithelial neoplasias | ||
| LGIN: Low-grade intraepithelial neoplasias | ||
| Liver | 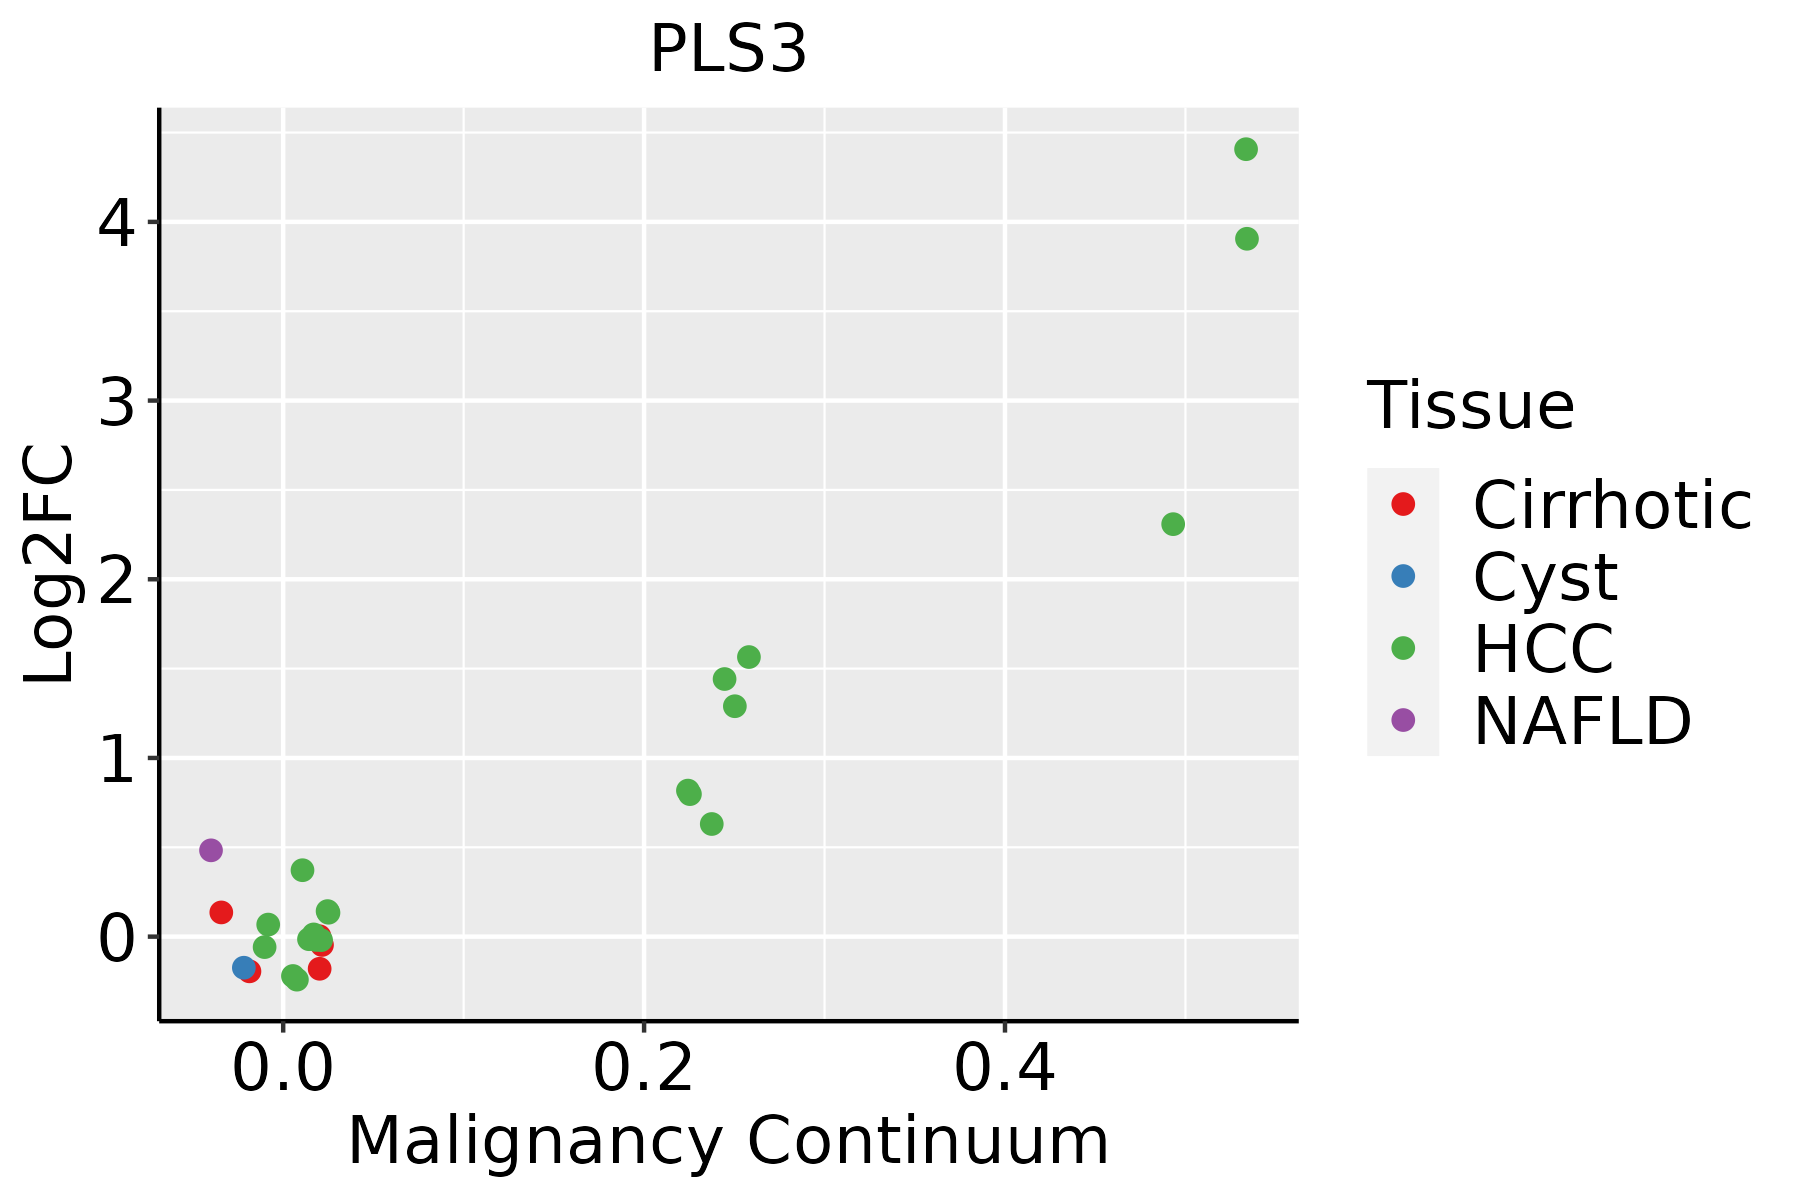 | HCC: Hepatocellular carcinoma |
| NAFLD: Non-alcoholic fatty liver disease | ||
| Oral Cavity |  | EOLP: Erosive Oral lichen planus |
| LP: leukoplakia | ||
| NEOLP: Non-erosive oral lichen planus | ||
| OSCC: Oral squamous cell carcinoma | ||
| Prostate | 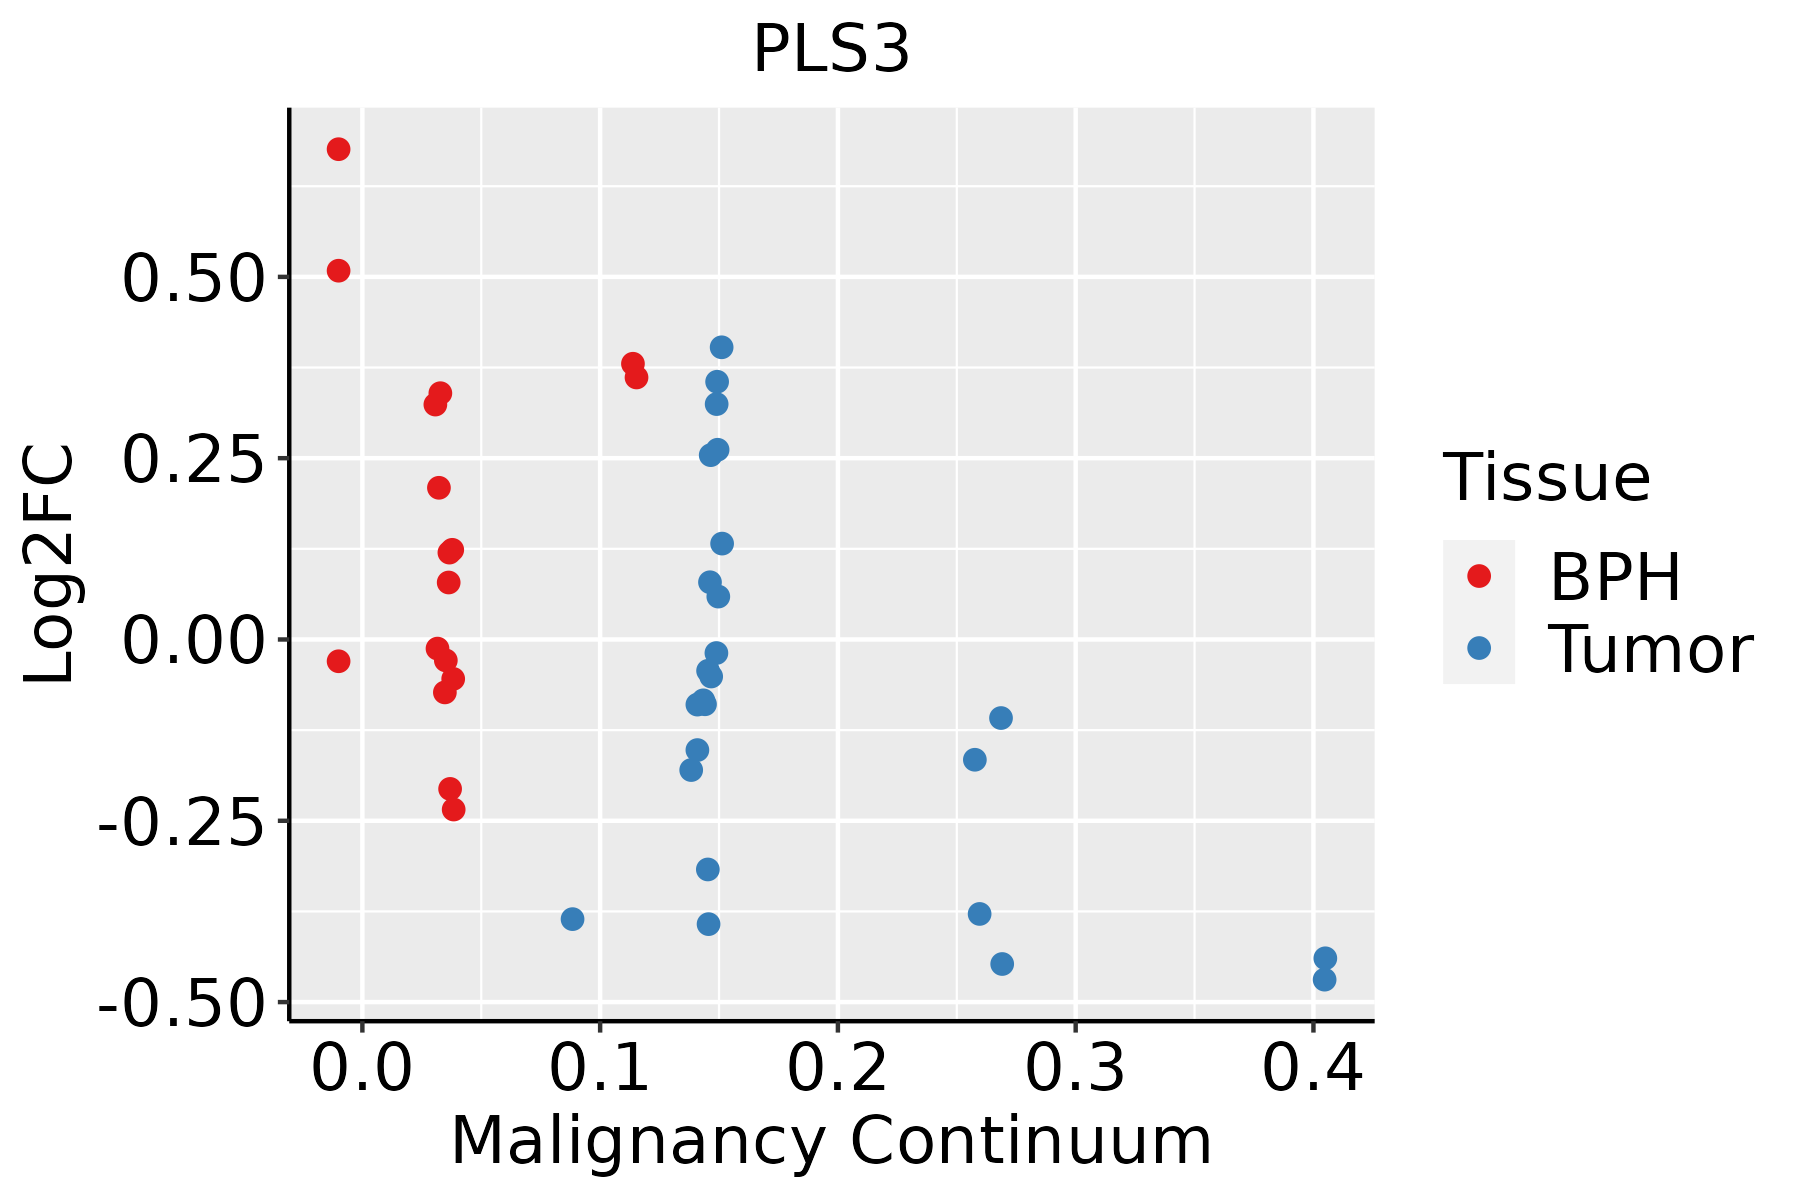 | BPH: Benign Prostatic Hyperplasia |
| Skin | 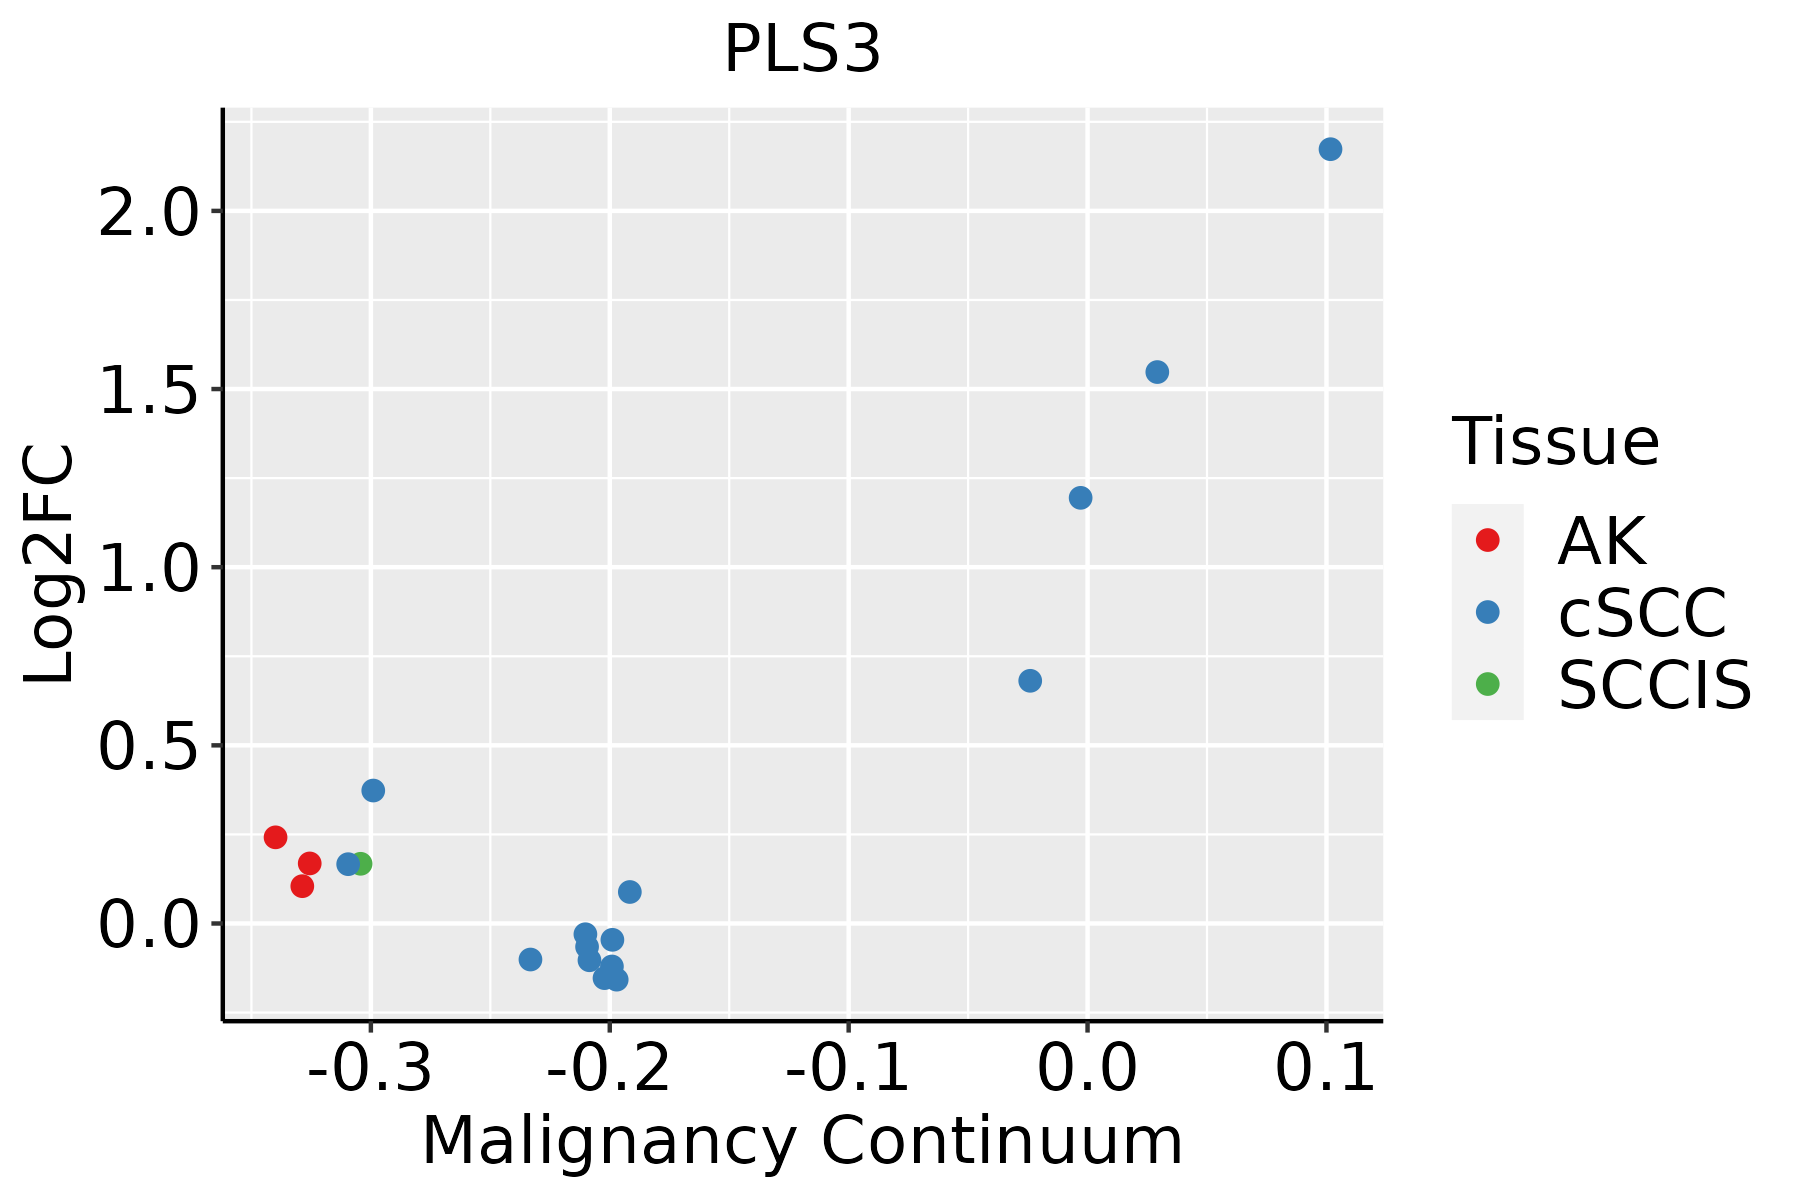 | AK: Actinic keratosis |
| cSCC: Cutaneous squamous cell carcinoma | ||
| SCCIS:squamous cell carcinoma in situ | ||
| Thyroid | 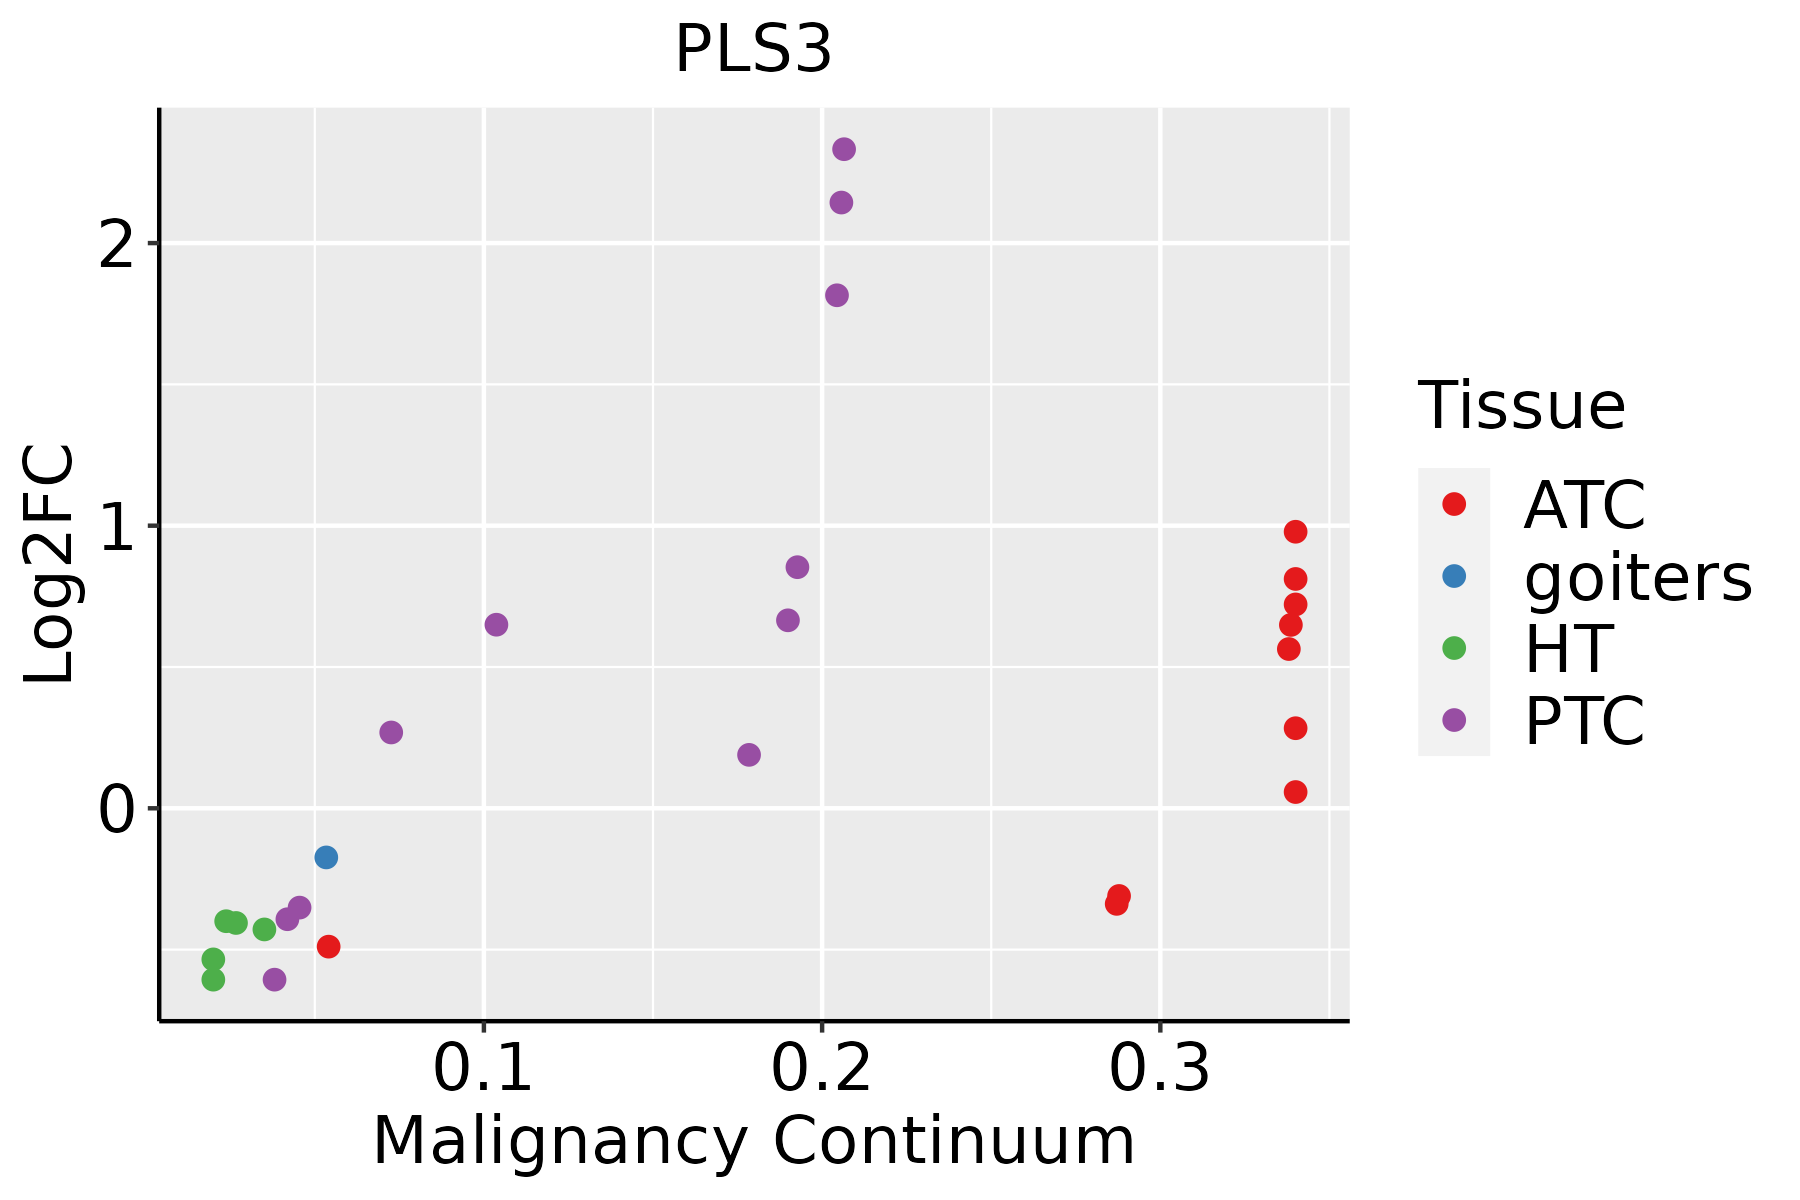 | ATC: Anaplastic thyroid cancer |
| HT: Hashimoto's thyroiditis | ||
| PTC: Papillary thyroid cancer |
| ∗log2FC in expression of this searched gene in stem-like cells from each diseased tissue sample relative to stem-like cells in normal samples in each tissue plotted against the malignancy continuum. Samples are colored based on if they are from different disease stage. |
Top |
Malignant transformation related pathway analysis |
| Find out the enriched GO biological processes and KEGG pathways involved in transition from healthy to precancer to cancer |
| Tissue | Disease Stage | Enriched GO biological Processes |
| Colorectum | AD |  |
| Colorectum | SER |  |
| Colorectum | MSS |  |
| Colorectum | MSI-H |  |
| Colorectum | FAP |  |
| ∗Top 15 enriched GO BP terms are showed in the bar plot of each disease state in each tissue. Each row represents a significant GO biological process which is colored according to the -log10(p.adjust). |
| Page: 1 2 3 4 5 6 7 8 9 |
| GO ID | Tissue | Disease Stage | Description | Gene Ratio | Bg Ratio | pvalue | p.adjust | Count |
| GO:000701510 | Cervix | CC | actin filament organization | 109/2311 | 442/18723 | 4.92e-13 | 2.45e-10 | 109 |
| GO:006157210 | Cervix | CC | actin filament bundle organization | 44/2311 | 161/18723 | 2.08e-07 | 9.34e-06 | 44 |
| GO:005101710 | Cervix | CC | actin filament bundle assembly | 43/2311 | 157/18723 | 2.66e-07 | 1.12e-05 | 43 |
| GO:000701527 | Esophagus | ESCC | actin filament organization | 259/8552 | 442/18723 | 2.37e-08 | 4.50e-07 | 259 |
| GO:005101727 | Esophagus | ESCC | actin filament bundle assembly | 100/8552 | 157/18723 | 3.87e-06 | 4.17e-05 | 100 |
| GO:006157227 | Esophagus | ESCC | actin filament bundle organization | 101/8552 | 161/18723 | 9.22e-06 | 8.82e-05 | 101 |
| GO:00603485 | Esophagus | ESCC | bone development | 115/8552 | 205/18723 | 1.67e-03 | 7.72e-03 | 115 |
| GO:000701512 | Liver | Cirrhotic | actin filament organization | 171/4634 | 442/18723 | 3.93e-11 | 2.30e-09 | 171 |
| GO:005101712 | Liver | Cirrhotic | actin filament bundle assembly | 69/4634 | 157/18723 | 1.06e-07 | 3.05e-06 | 69 |
| GO:006157212 | Liver | Cirrhotic | actin filament bundle organization | 70/4634 | 161/18723 | 1.44e-07 | 3.87e-06 | 70 |
| GO:000701522 | Liver | HCC | actin filament organization | 252/7958 | 442/18723 | 3.83e-10 | 1.25e-08 | 252 |
| GO:005101722 | Liver | HCC | actin filament bundle assembly | 96/7958 | 157/18723 | 1.81e-06 | 2.52e-05 | 96 |
| GO:006157222 | Liver | HCC | actin filament bundle organization | 97/7958 | 161/18723 | 4.04e-06 | 5.22e-05 | 97 |
| GO:000701520 | Oral cavity | OSCC | actin filament organization | 230/7305 | 442/18723 | 1.37e-08 | 2.77e-07 | 230 |
| GO:005101720 | Oral cavity | OSCC | actin filament bundle assembly | 86/7305 | 157/18723 | 4.28e-05 | 3.70e-04 | 86 |
| GO:006157220 | Oral cavity | OSCC | actin filament bundle organization | 87/7305 | 161/18723 | 7.49e-05 | 5.84e-04 | 87 |
| GO:00603484 | Oral cavity | OSCC | bone development | 99/7305 | 205/18723 | 4.13e-03 | 1.68e-02 | 99 |
| GO:0007015110 | Oral cavity | LP | actin filament organization | 143/4623 | 442/18723 | 1.44e-04 | 1.65e-03 | 143 |
| GO:0051017110 | Oral cavity | LP | actin filament bundle assembly | 53/4623 | 157/18723 | 6.54e-03 | 3.83e-02 | 53 |
| GO:000701534 | Oral cavity | NEOLP | actin filament organization | 94/2005 | 442/18723 | 4.49e-11 | 5.80e-09 | 94 |
| Page: 1 2 3 |
| Pathway ID | Tissue | Disease Stage | Description | Gene Ratio | Bg Ratio | pvalue | p.adjust | qvalue | Count |
| Page: 1 |
Top |
Cell-cell communication analysis |
| Identification of potential cell-cell interactions between two cell types and their ligand-receptor pairs for different disease states |
| Ligand | Receptor | LRpair | Pathway | Tissue | Disease Stage |
| Page: 1 |
Top |
Single-cell gene regulatory network inference analysis |
| Find out the significant the regulons (TFs) and the target genes of each regulon across cell types for different disease states |
| TF | Cell Type | Tissue | Disease Stage | Target Gene | RSS | Regulon Activity |
| ∗The dot plots of a searched regulon are shown for all cell subpopulations in each disease state of each tissue based on the regulon specific score inferred using pySCENIC and by calculating the average expression. |
| Page: 1 |
Top |
Somatic mutation of malignant transformation related genes |
| Annotation of somatic variants for genes involved in malignant transformation |
| Hugo Symbol | Variant Class | Variant Classification | dbSNP RS | HGVSc | HGVSp | HGVSp Short | SWISSPROT | BIOTYPE | SIFT | PolyPhen | Tumor Sample Barcode | Tissue | Histology | Sex | Age | Stage | Therapy Types | Drugs | Outcome |
| PLS3 | SNV | Missense_Mutation | novel | c.1186N>A | p.Glu396Lys | p.E396K | P13797 | protein_coding | deleterious(0) | probably_damaging(0.917) | TCGA-A2-A3Y0-01 | Breast | breast invasive carcinoma | Female | <65 | I/II | Chemotherapy | adriamycin | CR |
| PLS3 | SNV | Missense_Mutation | rs781990552 | c.555G>C | p.Lys185Asn | p.K185N | P13797 | protein_coding | deleterious(0) | possibly_damaging(0.702) | TCGA-A8-A06Q-01 | Breast | breast invasive carcinoma | Female | <65 | III/IV | Unknown | Unknown | SD |
| PLS3 | SNV | Missense_Mutation | c.46G>A | p.Glu16Lys | p.E16K | P13797 | protein_coding | deleterious(0.04) | benign(0.271) | TCGA-A8-A093-01 | Breast | breast invasive carcinoma | Female | <65 | I/II | Hormone Therapy | tamoxiphen | SD | |
| PLS3 | SNV | Missense_Mutation | c.869N>G | p.Asn290Ser | p.N290S | P13797 | protein_coding | tolerated(0.54) | benign(0) | TCGA-BH-A18G-01 | Breast | breast invasive carcinoma | Female | >=65 | I/II | Unknown | Unknown | SD | |
| PLS3 | SNV | Missense_Mutation | c.874N>A | p.Phe292Ile | p.F292I | P13797 | protein_coding | deleterious(0) | probably_damaging(0.998) | TCGA-E9-A295-01 | Breast | breast invasive carcinoma | Female | >=65 | I/II | Hormone Therapy | tamoxiphen | SD | |
| PLS3 | SNV | Missense_Mutation | novel | c.569N>T | p.Pro190Leu | p.P190L | P13797 | protein_coding | tolerated(0.33) | benign(0.007) | TCGA-2W-A8YY-01 | Cervix | cervical & endocervical cancer | Female | <65 | I/II | Chemotherapy | cisplatin | CR |
| PLS3 | SNV | Missense_Mutation | c.535N>C | p.Asp179His | p.D179H | P13797 | protein_coding | deleterious(0) | probably_damaging(0.919) | TCGA-Q1-A73O-01 | Cervix | cervical & endocervical cancer | Female | <65 | I/II | Chemotherapy | cisplatin | CR | |
| PLS3 | SNV | Missense_Mutation | rs370999829 | c.1262N>T | p.Ala421Val | p.A421V | P13797 | protein_coding | tolerated(0.1) | benign(0.003) | TCGA-AA-3667-01 | Colorectum | colon adenocarcinoma | Female | <65 | I/II | Unknown | Unknown | SD |
| PLS3 | SNV | Missense_Mutation | rs370999829 | c.1262N>T | p.Ala421Val | p.A421V | P13797 | protein_coding | tolerated(0.1) | benign(0.003) | TCGA-AA-3984-01 | Colorectum | colon adenocarcinoma | Female | <65 | I/II | Unknown | Unknown | SD |
| PLS3 | SNV | Missense_Mutation | c.299N>C | p.Lys100Thr | p.K100T | P13797 | protein_coding | tolerated(0.05) | benign(0.15) | TCGA-DM-A1D0-01 | Colorectum | colon adenocarcinoma | Female | >=65 | I/II | Unknown | Unknown | SD |
| Page: 1 2 3 4 5 6 |
Top |
Related drugs of malignant transformation related genes |
| Identification of chemicals and drugs interact with genes involved in malignant transfromation |
| (DGIdb 4.0) |
| Entrez ID | Symbol | Category | Interaction Types | Drug Claim Name | Drug Name | PMIDs |
| Page: 1 |

Copyright 2023-Present -The University of Texas Health Science Center at Houston |