Schematic overview of the cellular and molecular mechanisms involved in the cancer progression, including the proposed cellular and molecular mechanisms in cancer cells trajectory. AT1: alveolar type 1 cells; AT2: alveolar type 2 cells; AAH: atypical adenomatous hyperplasia; AIS: adenocarcinoma in situ; MIA: minimally invasive adenocarcinoma; IA: invasive adenocarcinoma; EMT: epithelial-mesenchymal transition

Home

Download

Statistics

Help

Contact

Center for Computational Systems Medicine
leaf

Gene summary

leaf

Malignant transformation analysis

leaf

Malignant transformation related pathway analysis

leaf

Cell-cell communication analysis

leaf

Single-cell gene regulatory network inference analysis

leaf

Somatic mutation of malignant transformation related genes

leaf

Related drugs of malignant transformation related genes

Gene: PLS1

Gene summary for PLS1

check button Gene summary.

Gene informationSpeciesHuman
Gene symbol

PLS1

Gene ID

5357

Gene nameplastin 1
Gene AliasDFNA76
Cytomap3q23
Gene Typeprotein-coding
GO ID

GO:0000902

UniProtAcc

Q14651


Top

Malignant transformation analysis

check button Identification of the aberrant gene expression in precancerous and cancerous lesions by comparing the gene expression of stem-like cells in diseased tissues with normal stem cells
check button Malignant transformation involving gene list.
Entrez IDSymbolReplicatesSpeciesOrganTissueAdj P-valueLog2FCMalignancy
5357PLS1HTA11_3410_2000001011HumanColorectumAD1.57e-19-6.11e-010.0155
5357PLS1HTA11_347_2000001011HumanColorectumAD3.66e-085.69e-01-0.1954
5357PLS1HTA11_7862_2000001011HumanColorectumAD1.69e-03-4.50e-01-0.0179
5357PLS1HTA11_866_3004761011HumanColorectumAD3.49e-16-5.58e-010.096
5357PLS1HTA11_9408_2000001011HumanColorectumAD1.34e-02-7.58e-010.0451
5357PLS1HTA11_8622_2000001021HumanColorectumSER5.73e-03-5.71e-010.0528
5357PLS1HTA11_10711_2000001011HumanColorectumAD5.76e-03-4.62e-010.0338
5357PLS1HTA11_7696_3000711011HumanColorectumAD2.68e-10-4.40e-010.0674
5357PLS1HTA11_6818_2000001021HumanColorectumAD3.77e-04-3.89e-010.0588
5357PLS1HTA11_99999970781_79442HumanColorectumMSS1.82e-13-4.81e-010.294
5357PLS1HTA11_99999971662_82457HumanColorectumMSS1.32e-02-3.58e-010.3859
5357PLS1HTA11_99999973899_84307HumanColorectumMSS2.87e-09-7.65e-010.2585
5357PLS1HTA11_99999974143_84620HumanColorectumMSS6.15e-24-6.49e-010.3005
5357PLS1F007HumanColorectumFAP1.77e-08-4.65e-010.1176
5357PLS1A002-C-010HumanColorectumFAP4.19e-06-1.89e-010.242
5357PLS1A001-C-207HumanColorectumFAP4.68e-05-2.93e-010.1278
5357PLS1A015-C-203HumanColorectumFAP4.80e-41-6.00e-01-0.1294
5357PLS1A015-C-204HumanColorectumFAP3.21e-11-4.73e-01-0.0228
5357PLS1A014-C-040HumanColorectumFAP1.72e-06-4.69e-01-0.1184
5357PLS1A002-C-201HumanColorectumFAP1.90e-19-4.97e-010.0324
Page: 1 2 3 4 5 6 

check button Transcriptomic changes along malignancy continuum.
TissueExpression DynamicsAbbreviation
Colorectum (GSE201348)The image shows the transcriptomic changes along malignancy continuum.log2FC in expression of this searched gene in stem-like cells from each diseased tissue sample relative to stem-like cells in normal samples in each tissue plotted against the malignancy continuum. Samples are colored based on if they are from different disease stage.
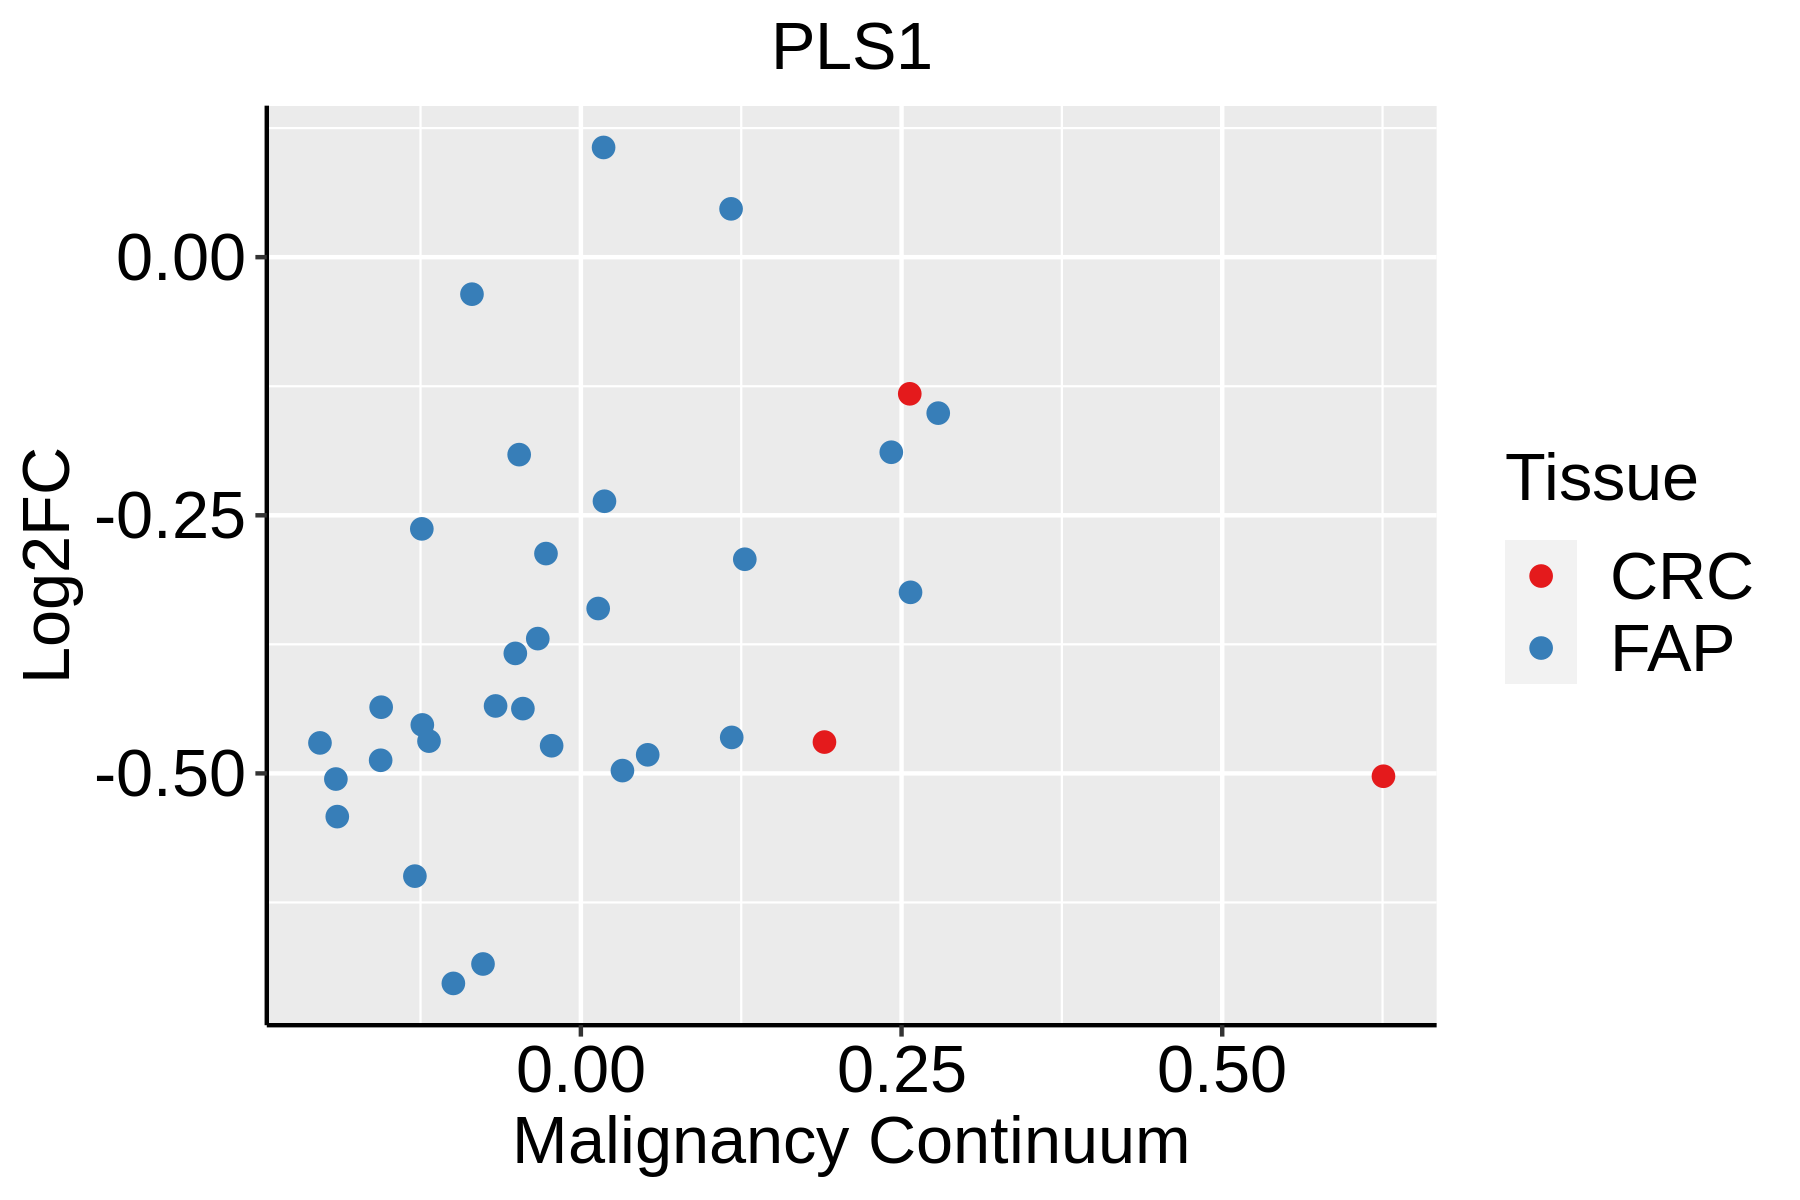
FAP: Familial adenomatous polyposis
CRC: Colorectal cancer
Colorectum (HTA11)The image shows the transcriptomic changes along malignancy continuum.log2FC in expression of this searched gene in stem-like cells from each diseased tissue sample relative to stem-like cells in normal samples in each tissue plotted against the malignancy continuum. Samples are colored based on if they are from different disease stage.AD: Adenomas
SER: Sessile serrated lesions
MSI-H: Microsatellite-high colorectal cancer
MSS: Microsatellite stable colorectal cancer
EsophagusThe image shows the transcriptomic changes along malignancy continuum.log2FC in expression of this searched gene in stem-like cells from each diseased tissue sample relative to stem-like cells in normal samples in each tissue plotted against the malignancy continuum. Samples are colored based on if they are from different disease stage.
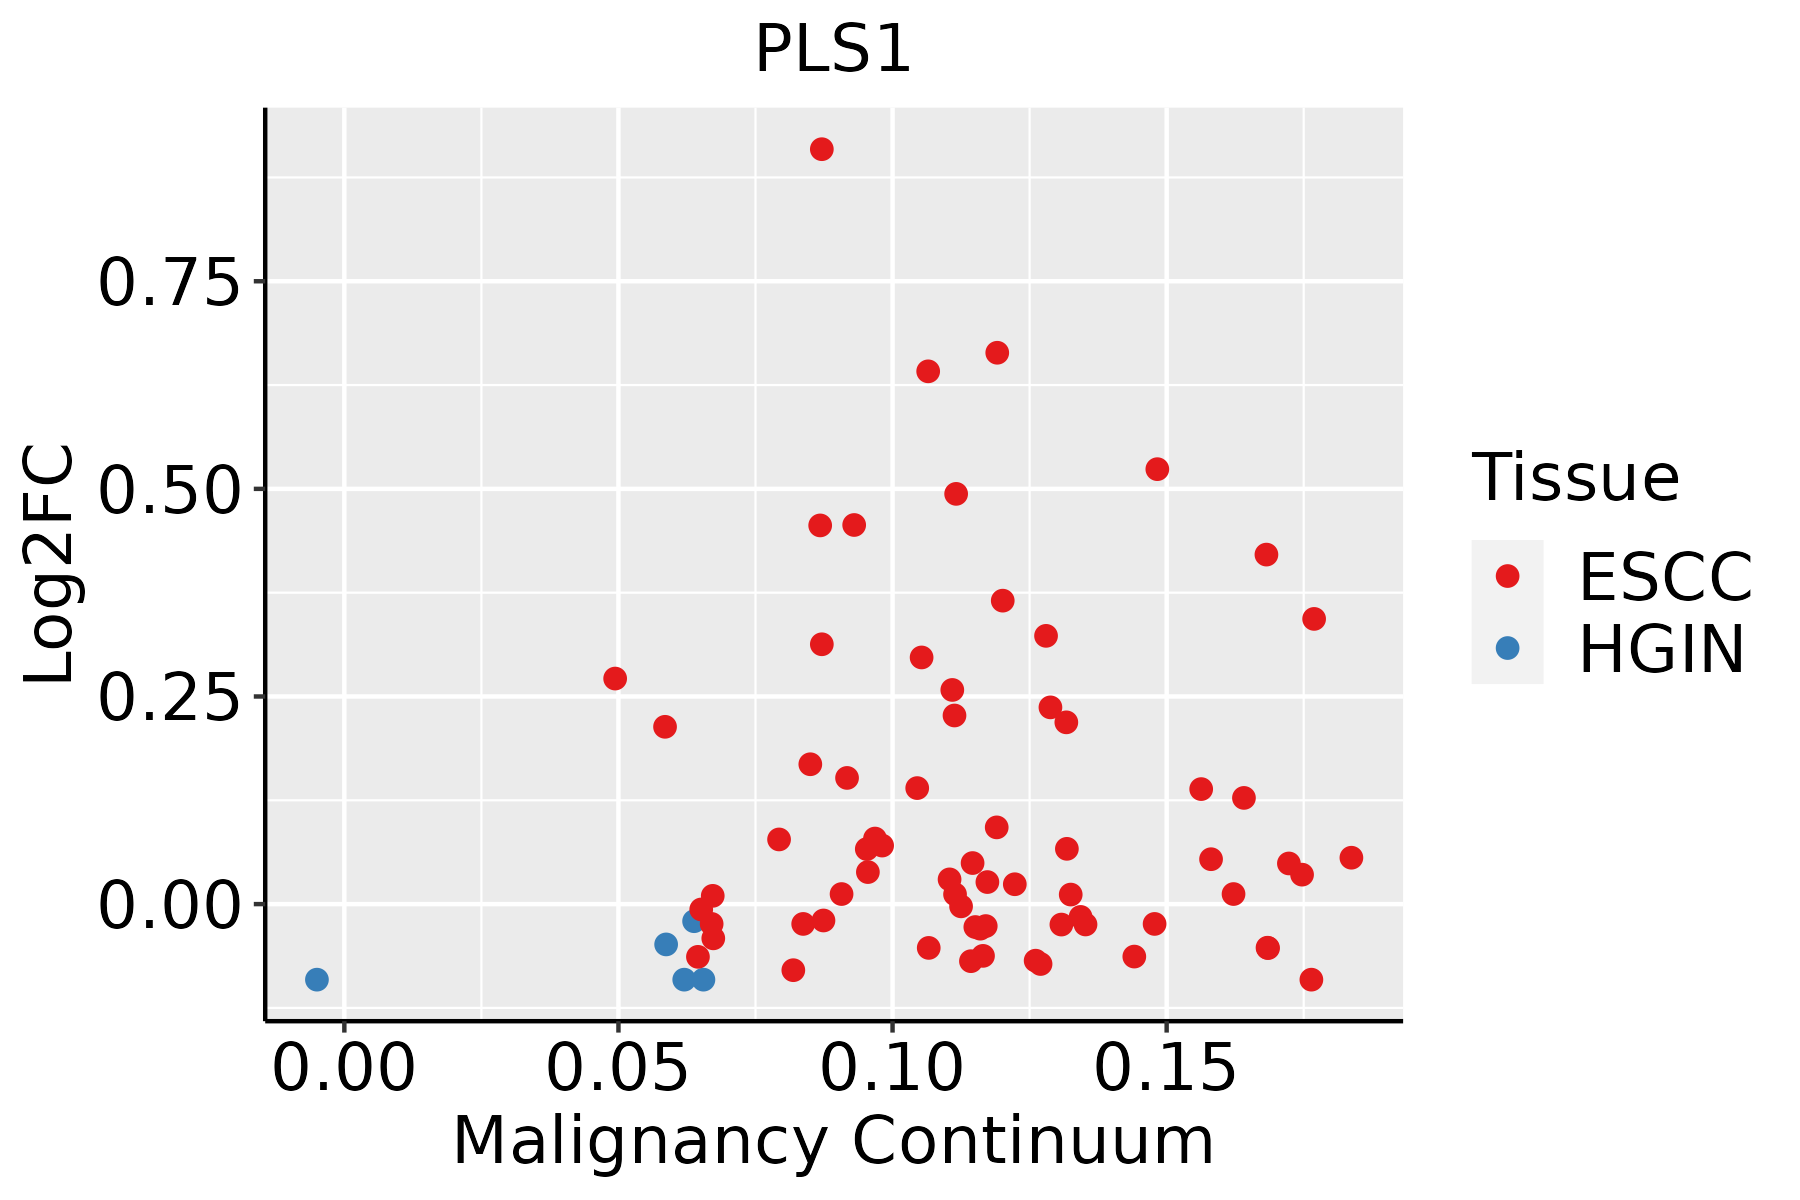
ESCC: Esophageal squamous cell carcinoma
HGIN: High-grade intraepithelial neoplasias
LGIN: Low-grade intraepithelial neoplasias
GCThe image shows the transcriptomic changes along malignancy continuum.log2FC in expression of this searched gene in stem-like cells from each diseased tissue sample relative to stem-like cells in normal samples in each tissue plotted against the malignancy continuum. Samples are colored based on if they are from different disease stage.
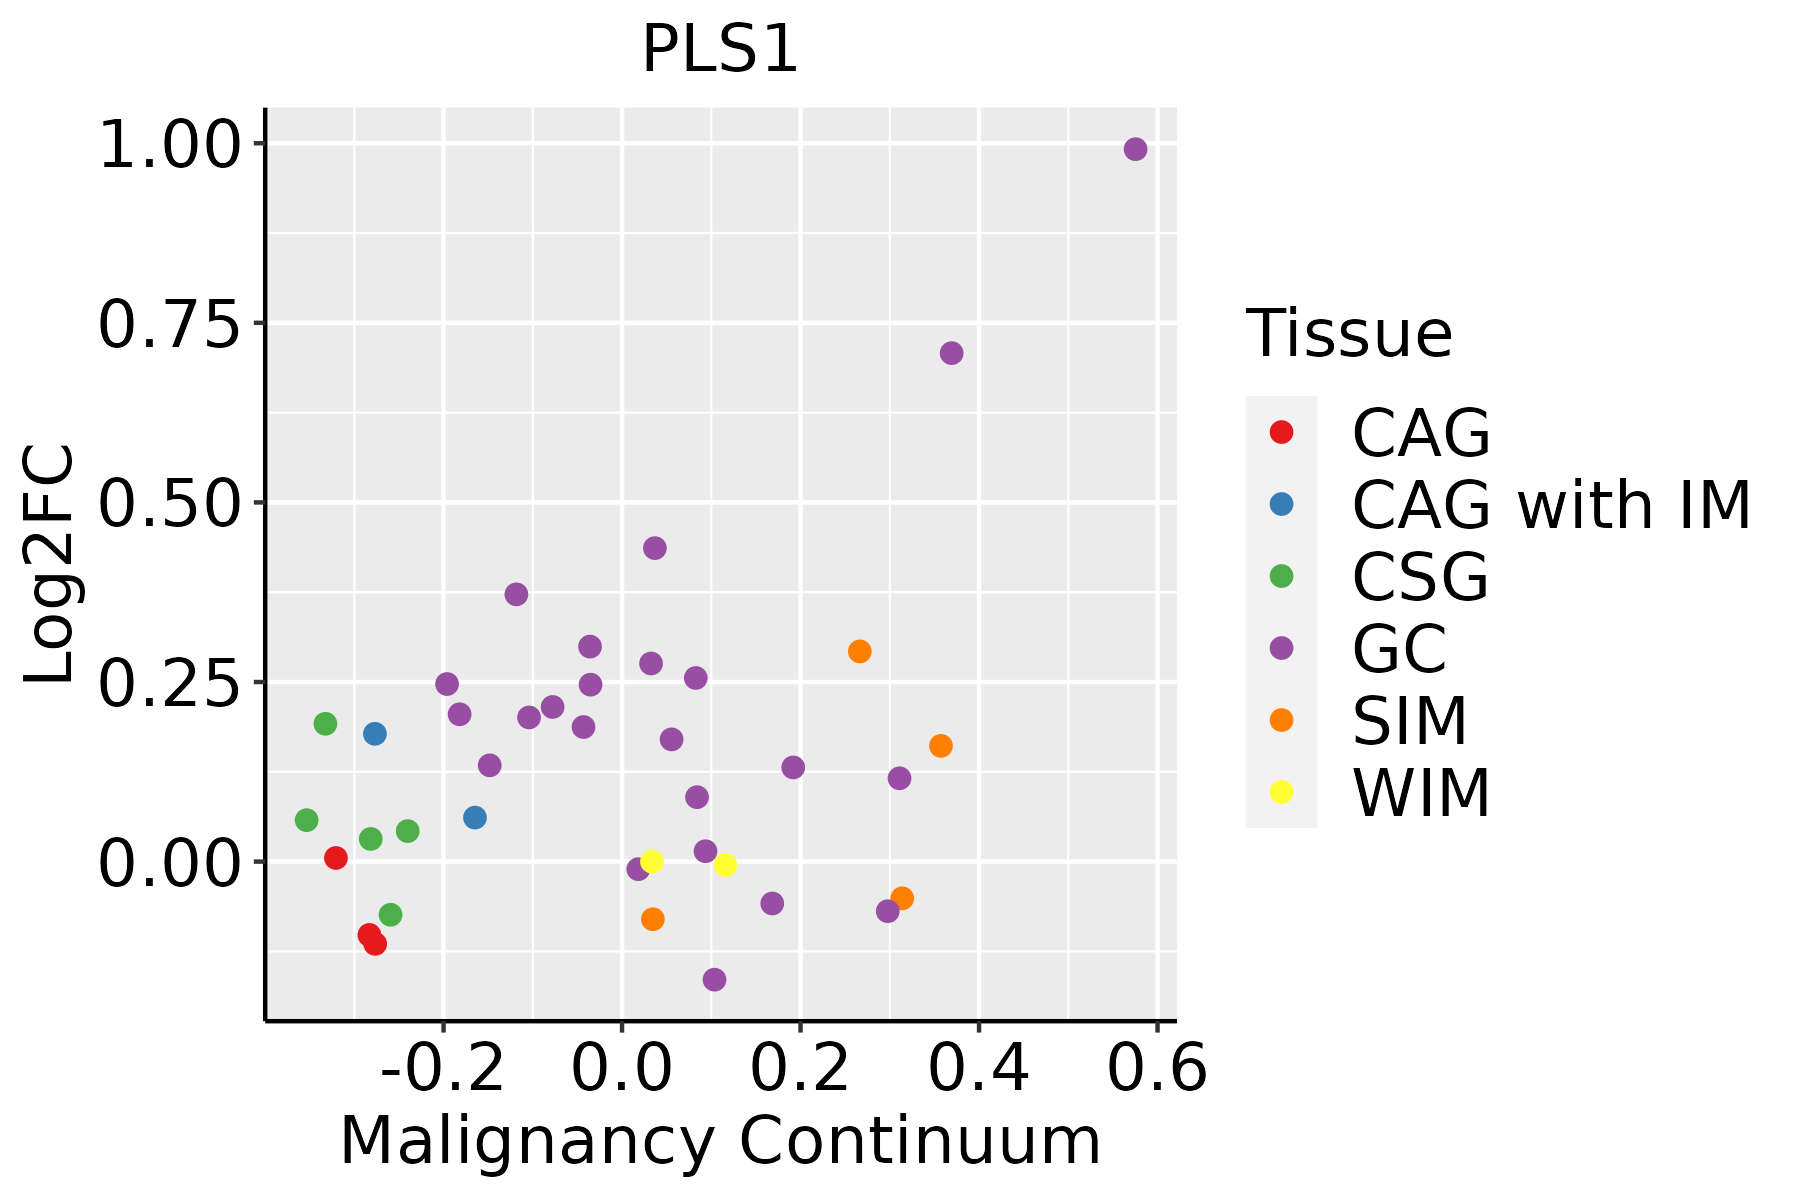
CAG: Chronic atrophic gastritis
CAG with IM: Chronic atrophic gastritis with intestinal metaplasia
CSG: Chronic superficial gastritis
GC: Gastric cancer
SIM: Severe intestinal metaplasia
WIM: Wild intestinal metaplasia
LiverThe image shows the transcriptomic changes along malignancy continuum.log2FC in expression of this searched gene in stem-like cells from each diseased tissue sample relative to stem-like cells in normal samples in each tissue plotted against the malignancy continuum. Samples are colored based on if they are from different disease stage.
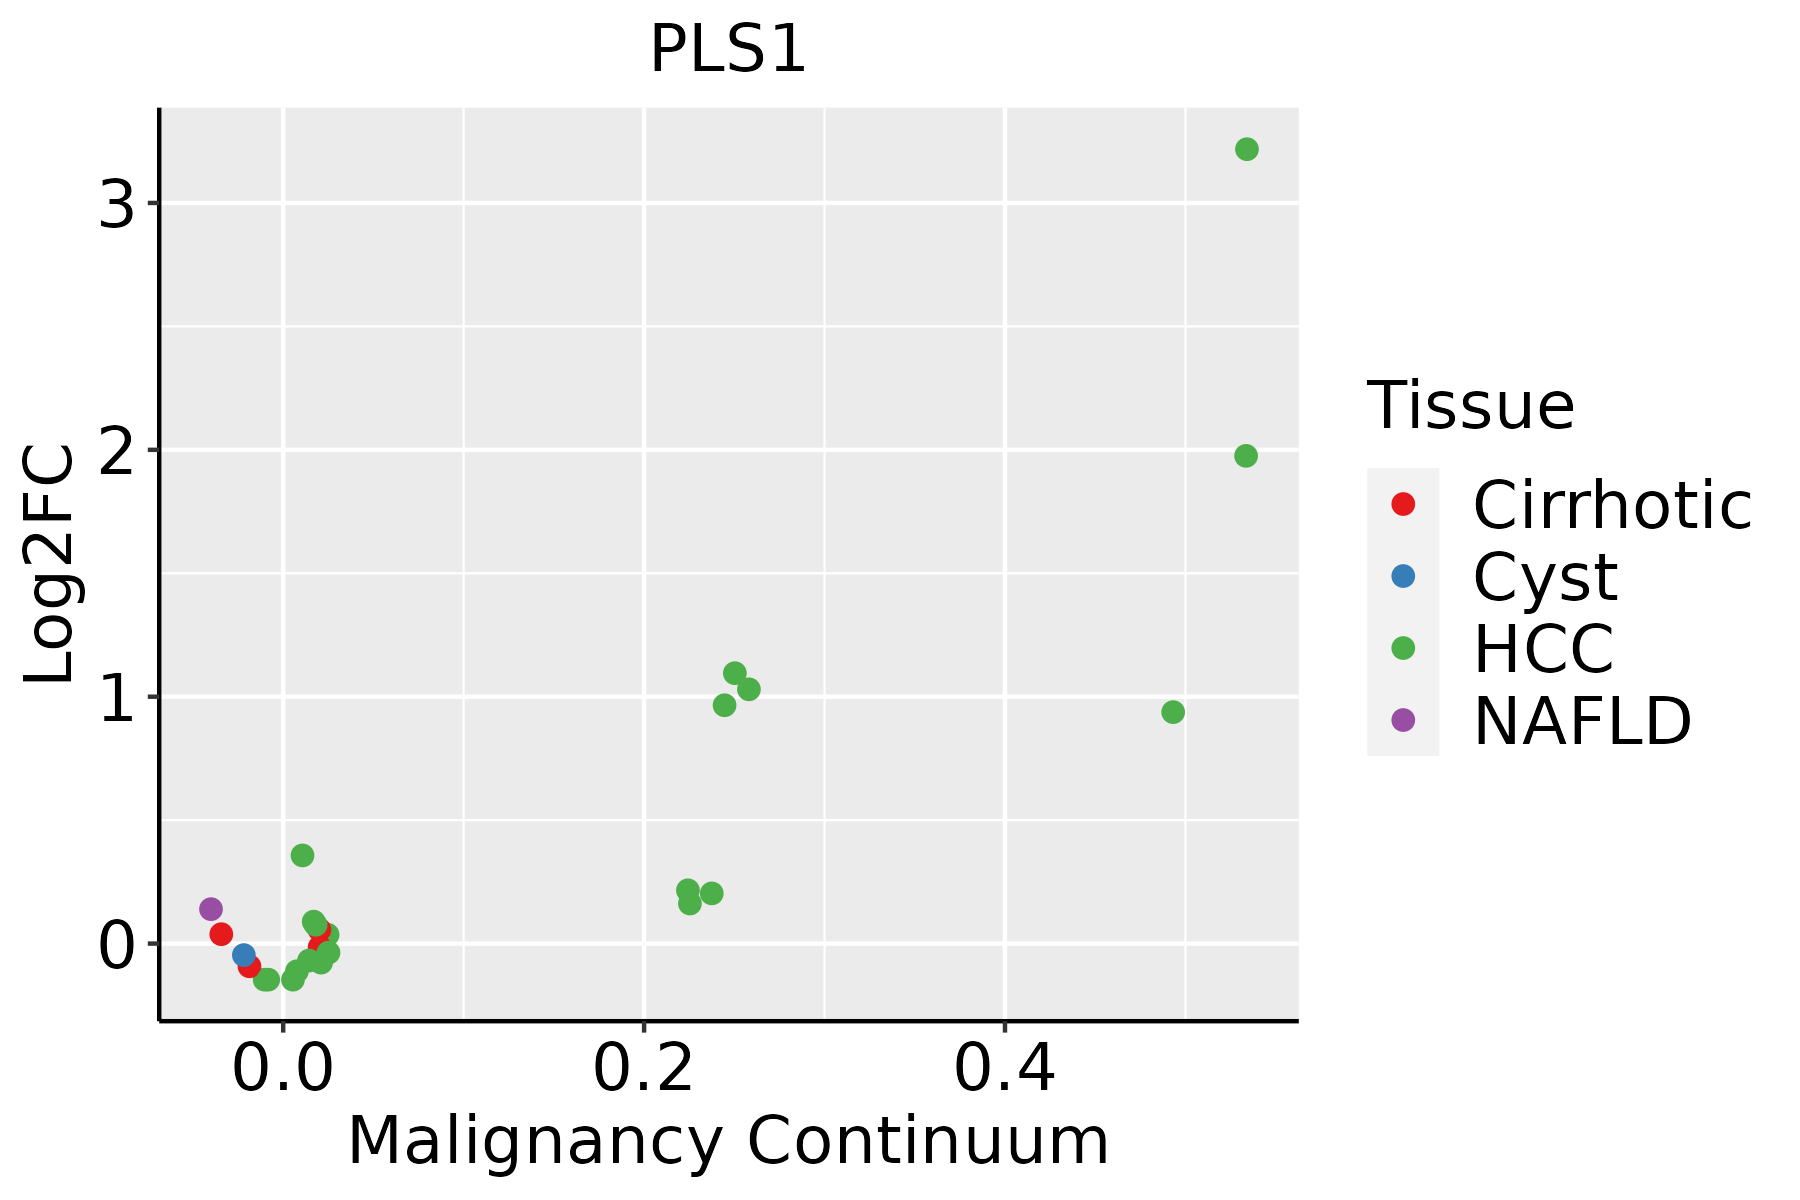
HCC: Hepatocellular carcinoma
NAFLD: Non-alcoholic fatty liver disease
∗log2FC in expression of this searched gene in stem-like cells from each diseased tissue sample relative to stem-like cells in normal samples in each tissue plotted against the malignancy continuum. Samples are colored based on if they are from different disease stage.

Top

Malignant transformation related pathway analysis

check buttonFind out the enriched GO biological processes and KEGG pathways involved in transition from healthy to precancer to cancer
check button Figure of enriched GO biological processes.
TissueDisease StageEnriched GO biological Processes
ColorectumADGO analysis - Figure of enriched GO biological processes: Top 15 enriched GO BP terms are showed in the bar plot of each disease state in each tissue. Each row represents a significant GO biological process which is colored according to the -log10(p.adjust).
ColorectumSERGO analysis - Figure of enriched GO biological processes: Top 15 enriched GO BP terms are showed in the bar plot of each disease state in each tissue. Each row represents a significant GO biological process which is colored according to the -log10(p.adjust).
ColorectumMSSGO analysis - Figure of enriched GO biological processes: Top 15 enriched GO BP terms are showed in the bar plot of each disease state in each tissue. Each row represents a significant GO biological process which is colored according to the -log10(p.adjust).
ColorectumMSI-HGO analysis - Figure of enriched GO biological processes: Top 15 enriched GO BP terms are showed in the bar plot of each disease state in each tissue. Each row represents a significant GO biological process which is colored according to the -log10(p.adjust).
ColorectumFAPGO analysis - Figure of enriched GO biological processes: Top 15 enriched GO BP terms are showed in the bar plot of each disease state in each tissue. Each row represents a significant GO biological process which is colored according to the -log10(p.adjust).
∗Top 15 enriched GO BP terms are showed in the bar plot of each disease state in each tissue. Each row represents a significant GO biological process which is colored according to the -log10(p.adjust).
Page: 1 2 3 4 5 6 7 8 9 

check button Enriched GO biological processes.
GO IDTissueDisease StageDescriptionGene RatioBg Ratiopvaluep.adjustCount
GO:0072659ColorectumADprotein localization to plasma membrane122/3918284/187232.86e-171.49e-14122
GO:0007015ColorectumADactin filament organization167/3918442/187231.65e-167.94e-14167
GO:1990778ColorectumADprotein localization to cell periphery129/3918333/187235.51e-141.15e-11129
GO:0032535ColorectumADregulation of cellular component size142/3918383/187231.74e-133.41e-11142
GO:1903829ColorectumADpositive regulation of cellular protein localization110/3918276/187234.58e-138.44e-11110
GO:0002064ColorectumADepithelial cell development89/3918220/187232.98e-113.52e-0989
GO:1905475ColorectumADregulation of protein localization to membrane73/3918175/187233.37e-102.93e-0873
GO:1903076ColorectumADregulation of protein localization to plasma membrane48/3918104/187237.17e-094.36e-0748
GO:1904375ColorectumADregulation of protein localization to cell periphery54/3918125/187231.52e-089.00e-0754
GO:1905477ColorectumADpositive regulation of protein localization to membrane46/3918106/187231.47e-076.64e-0646
GO:0061572ColorectumADactin filament bundle organization60/3918161/187231.33e-064.23e-0560
GO:0051017ColorectumADactin filament bundle assembly58/3918157/187232.74e-067.89e-0558
GO:1903078ColorectumADpositive regulation of protein localization to plasma membrane28/391862/187231.57e-053.34e-0428
GO:1904377ColorectumADpositive regulation of protein localization to cell periphery30/391869/187231.98e-054.05e-0430
GO:0032530ColorectumADregulation of microvillus organization10/391813/187232.43e-054.69e-0410
GO:0106027ColorectumADneuron projection organization36/391893/187236.58e-051.07e-0336
GO:0032528ColorectumADmicrovillus organization14/391824/187236.90e-051.11e-0314
GO:0030866ColorectumADcortical actin cytoskeleton organization19/391840/187231.58e-042.20e-0319
GO:0035315ColorectumADhair cell differentiation21/391847/187232.14e-042.82e-0321
GO:0030865ColorectumADcortical cytoskeleton organization25/391861/187232.96e-043.60e-0325
Page: 1 2 3 4 5 6 7 8 9 10 11 12 13 14 

check button Enriched KEGG pathways.
Pathway IDTissueDisease StageDescriptionGene RatioBg Ratiopvaluep.adjustqvalueCount
Page: 1 

Top

Cell-cell communication analysis

check buttonIdentification of potential cell-cell interactions between two cell types and their ligand-receptor pairs for different disease states
LigandReceptorLRpairPathwayTissueDisease Stage
Page: 1 

Top

Single-cell gene regulatory network inference analysis

check buttonFind out the significant the regulons (TFs) and the target genes of each regulon across cell types for different disease states
TFCell TypeTissueDisease StageTarget GeneRSSRegulon Activity
∗The dot plots of a searched regulon are shown for all cell subpopulations in each disease state of each tissue based on the regulon specific score inferred using pySCENIC and by calculating the average expression.
Page: 1 

Top

Somatic mutation of malignant transformation related genes

check buttonAnnotation of somatic variants for genes involved in malignant transformation
Hugo SymbolVariant ClassVariant ClassificationdbSNP RSHGVScHGVSpHGVSp ShortSWISSPROTBIOTYPESIFTPolyPhenTumor Sample BarcodeTissueHistologySexAgeStageTherapy TypesDrugsOutcome
PLS1SNVMissense_Mutationc.1849N>Cp.Phe617Leup.F617LQ14651protein_codingdeleterious(0)probably_damaging(0.993)TCGA-BH-A18G-01Breastbreast invasive carcinomaFemale>=65I/IIUnknownUnknownSD
PLS1SNVMissense_Mutationc.1712N>Ap.Arg571Lysp.R571KQ14651protein_codingtolerated(1)benign(0)TCGA-E9-A1RH-01Breastbreast invasive carcinomaFemale<65I/IIChemotherapy5-fluorouracilSD
PLS1SNVMissense_Mutationrs773749532c.1526C>Tp.Ser509Leup.S509LQ14651protein_codingdeleterious(0.02)probably_damaging(0.988)TCGA-EW-A1OV-01Breastbreast invasive carcinomaFemale<65I/IIChemotherapyepirubicinSD
PLS1SNVMissense_Mutationnovelc.605N>Gp.Ser202Cysp.S202CQ14651protein_codingdeleterious(0)probably_damaging(0.965)TCGA-PE-A5DE-01Breastbreast invasive carcinomaFemale<65I/IIChemotherapytaxotereCR
PLS1insertionFrame_Shift_Insnovelc.1245_1246insAAAAAp.His416LysfsTer12p.H416Kfs*12Q14651protein_codingTCGA-A8-A08C-01Breastbreast invasive carcinomaFemale>=65I/IIChemotherapy5-fluorouracilCR
PLS1insertionIn_Frame_Insnovelc.1246_1247insAAAp.His416delinsGlnAsnp.H416delinsQNQ14651protein_codingTCGA-A8-A08C-01Breastbreast invasive carcinomaFemale>=65I/IIChemotherapy5-fluorouracilCR
PLS1insertionNonsense_Mutationnovelc.1534_1535insGAGAGGGGTAATGTTCATTTTATGATACAGATCTCTGGGCAGGGGTAAGAGAp.Glu515Terp.E515*Q14651protein_codingTCGA-AO-A128-01Breastbreast invasive carcinomaFemale<65I/IIChemotherapydoxorubicinSD
PLS1SNVMissense_Mutationc.233N>Tp.Ser78Leup.S78LQ14651protein_codingtolerated(0.07)benign(0.272)TCGA-DR-A0ZM-01Cervixcervical & endocervical cancerFemale<65III/IVUnspecificCisplatinSD
PLS1SNVMissense_Mutationc.1515N>Cp.Leu505Phep.L505FQ14651protein_codingdeleterious(0.03)possibly_damaging(0.521)TCGA-EK-A3GJ-01Cervixcervical & endocervical cancerFemale<65I/IIUnknownUnknownSD
PLS1SNVMissense_Mutationc.529N>Cp.Ile177Leup.I177LQ14651protein_codingdeleterious(0)benign(0.179)TCGA-IR-A3LC-01Cervixcervical & endocervical cancerFemale<65I/IIUnspecificCisplatinComplete Response
Page: 1 2 3 4 5 6 7 

Top

Related drugs of malignant transformation related genes

check buttonIdentification of chemicals and drugs interact with genes involved in malignant transfromation
(DGIdb 4.0)
Entrez IDSymbolCategoryInteraction TypesDrug Claim NameDrug NamePMIDs
Page: 1