
|
|||||
|
 | |
| |
| |
| |
| |
| |
|
Gene: PLRG1 |
Gene summary for PLRG1 |
| Gene information | Species | Human | Gene symbol | PLRG1 | Gene ID | 5356 |
| Gene name | pleiotropic regulator 1 | |
| Gene Alias | Cwc1 | |
| Cytomap | 4q31.3 | |
| Gene Type | protein-coding | GO ID | GO:0000082 | UniProtAcc | O43660 |
Top |
Malignant transformation analysis |
| Identification of the aberrant gene expression in precancerous and cancerous lesions by comparing the gene expression of stem-like cells in diseased tissues with normal stem cells |
| Entrez ID | Symbol | Replicates | Species | Organ | Tissue | Adj P-value | Log2FC | Malignancy |
| 5356 | PLRG1 | LZE4T | Human | Esophagus | ESCC | 5.95e-14 | 4.46e-01 | 0.0811 |
| 5356 | PLRG1 | LZE7T | Human | Esophagus | ESCC | 2.10e-06 | 2.27e-01 | 0.0667 |
| 5356 | PLRG1 | LZE8T | Human | Esophagus | ESCC | 4.04e-05 | 2.43e-01 | 0.067 |
| 5356 | PLRG1 | LZE20T | Human | Esophagus | ESCC | 3.84e-02 | 1.58e-01 | 0.0662 |
| 5356 | PLRG1 | LZE24T | Human | Esophagus | ESCC | 9.76e-04 | 1.22e-01 | 0.0596 |
| 5356 | PLRG1 | LZE22D3 | Human | Esophagus | HGIN | 6.46e-03 | 5.92e-01 | 0.0653 |
| 5356 | PLRG1 | LZE6T | Human | Esophagus | ESCC | 2.56e-06 | 2.02e-01 | 0.0845 |
| 5356 | PLRG1 | P1T-E | Human | Esophagus | ESCC | 2.63e-05 | 3.24e-01 | 0.0875 |
| 5356 | PLRG1 | P2T-E | Human | Esophagus | ESCC | 4.42e-35 | 6.97e-01 | 0.1177 |
| 5356 | PLRG1 | P4T-E | Human | Esophagus | ESCC | 7.92e-16 | 5.15e-01 | 0.1323 |
| 5356 | PLRG1 | P5T-E | Human | Esophagus | ESCC | 2.24e-13 | 2.77e-01 | 0.1327 |
| 5356 | PLRG1 | P8T-E | Human | Esophagus | ESCC | 8.48e-34 | 7.09e-01 | 0.0889 |
| 5356 | PLRG1 | P9T-E | Human | Esophagus | ESCC | 3.19e-08 | 2.26e-01 | 0.1131 |
| 5356 | PLRG1 | P10T-E | Human | Esophagus | ESCC | 2.30e-18 | 3.08e-01 | 0.116 |
| 5356 | PLRG1 | P11T-E | Human | Esophagus | ESCC | 2.87e-13 | 6.44e-01 | 0.1426 |
| 5356 | PLRG1 | P12T-E | Human | Esophagus | ESCC | 4.91e-48 | 9.35e-01 | 0.1122 |
| 5356 | PLRG1 | P15T-E | Human | Esophagus | ESCC | 2.50e-19 | 3.20e-01 | 0.1149 |
| 5356 | PLRG1 | P16T-E | Human | Esophagus | ESCC | 3.26e-28 | 5.72e-01 | 0.1153 |
| 5356 | PLRG1 | P17T-E | Human | Esophagus | ESCC | 2.27e-11 | 6.24e-01 | 0.1278 |
| 5356 | PLRG1 | P19T-E | Human | Esophagus | ESCC | 4.30e-03 | 6.21e-01 | 0.1662 |
| Page: 1 2 3 4 5 6 |
| Tissue | Expression Dynamics | Abbreviation |
| Esophagus | 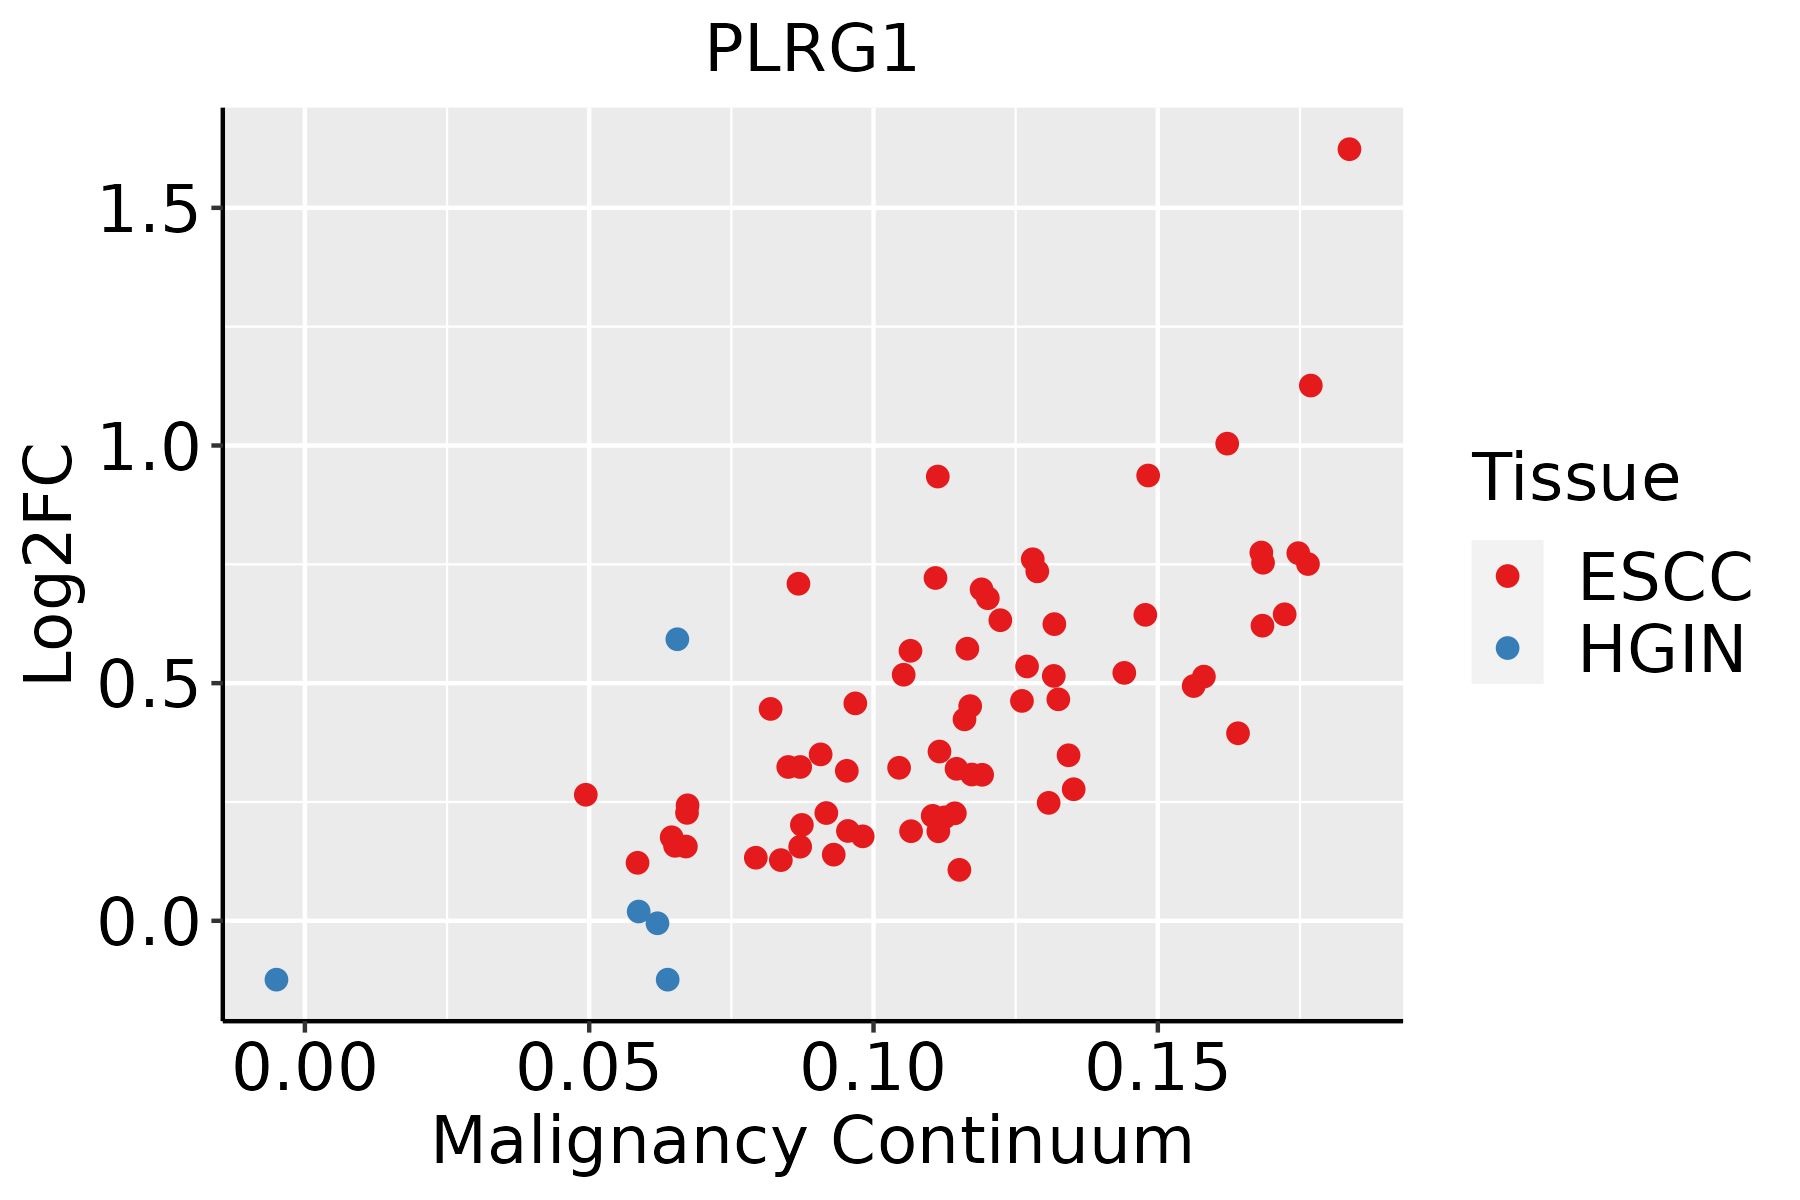 | ESCC: Esophageal squamous cell carcinoma |
| HGIN: High-grade intraepithelial neoplasias | ||
| LGIN: Low-grade intraepithelial neoplasias | ||
| Liver | 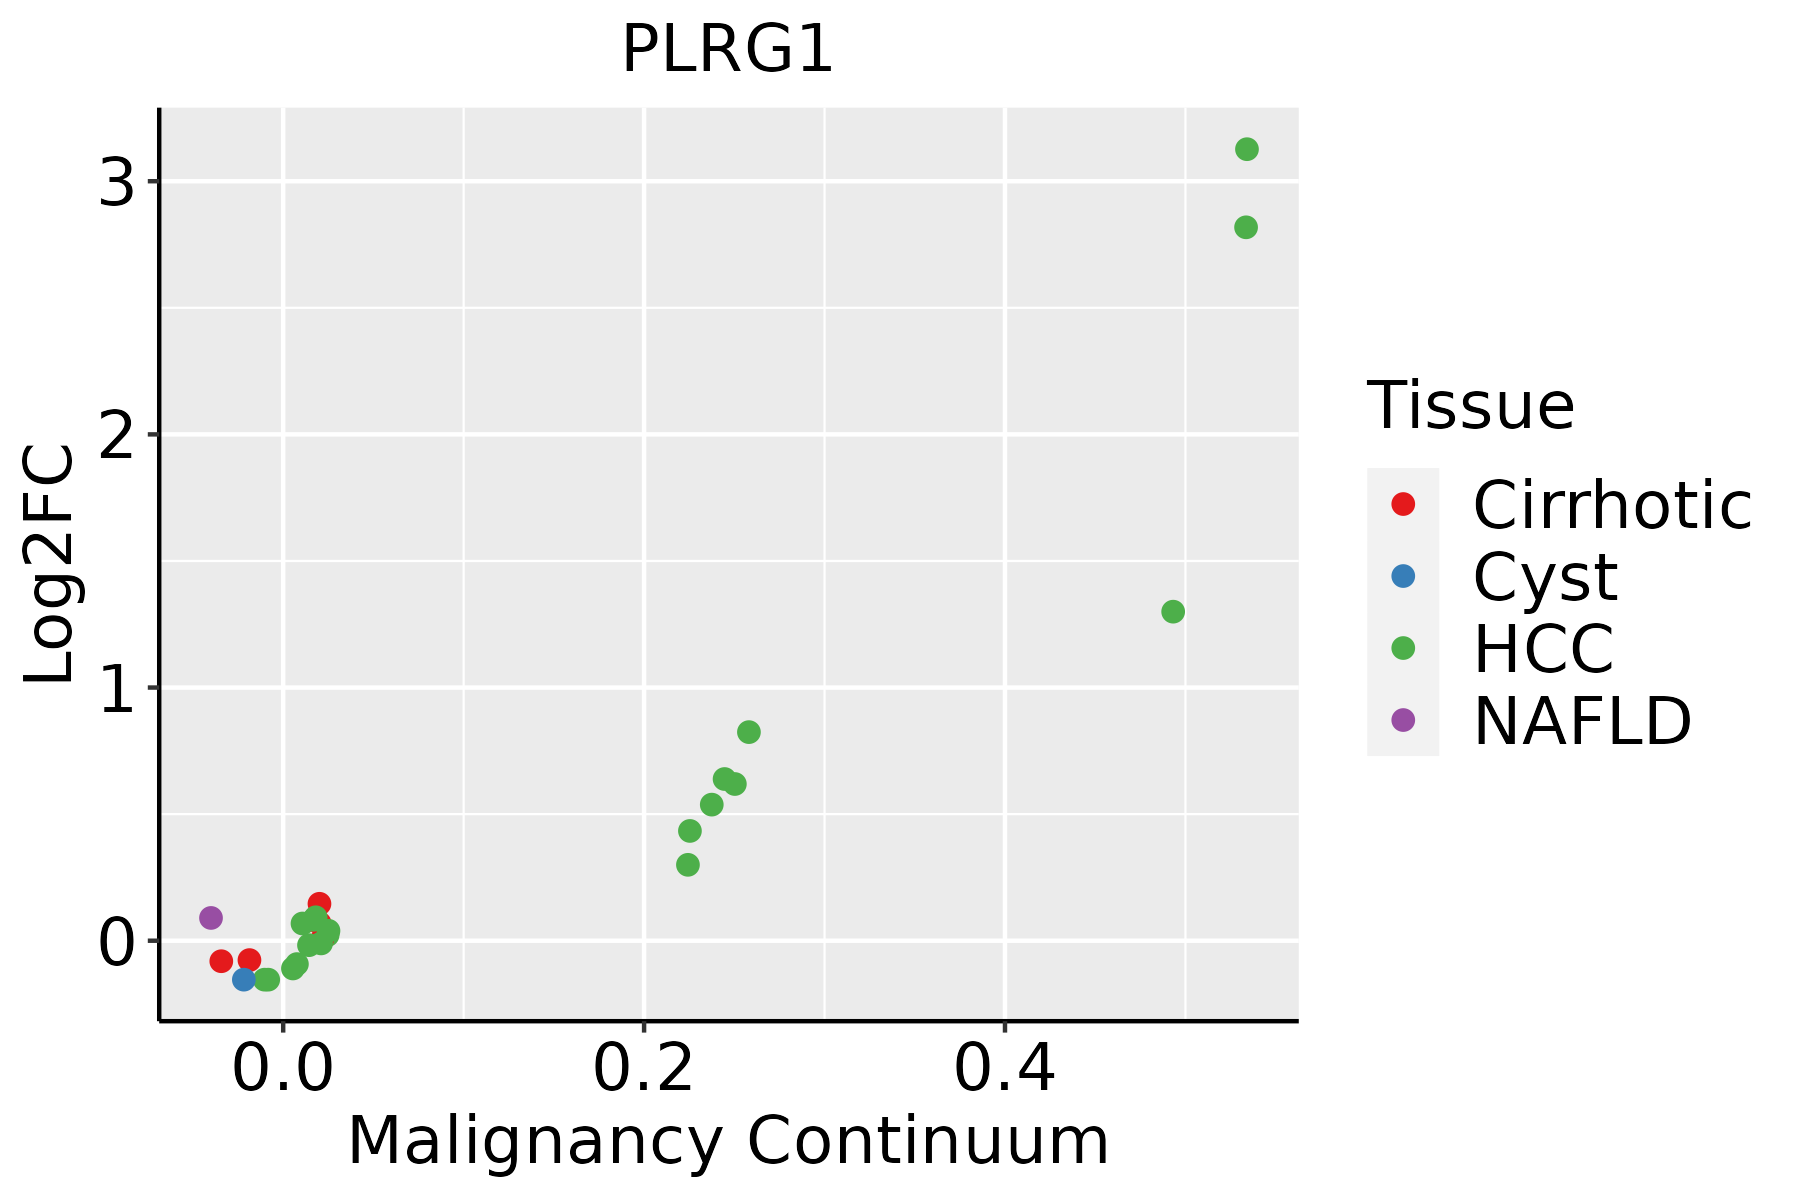 | HCC: Hepatocellular carcinoma |
| NAFLD: Non-alcoholic fatty liver disease | ||
| Oral Cavity | 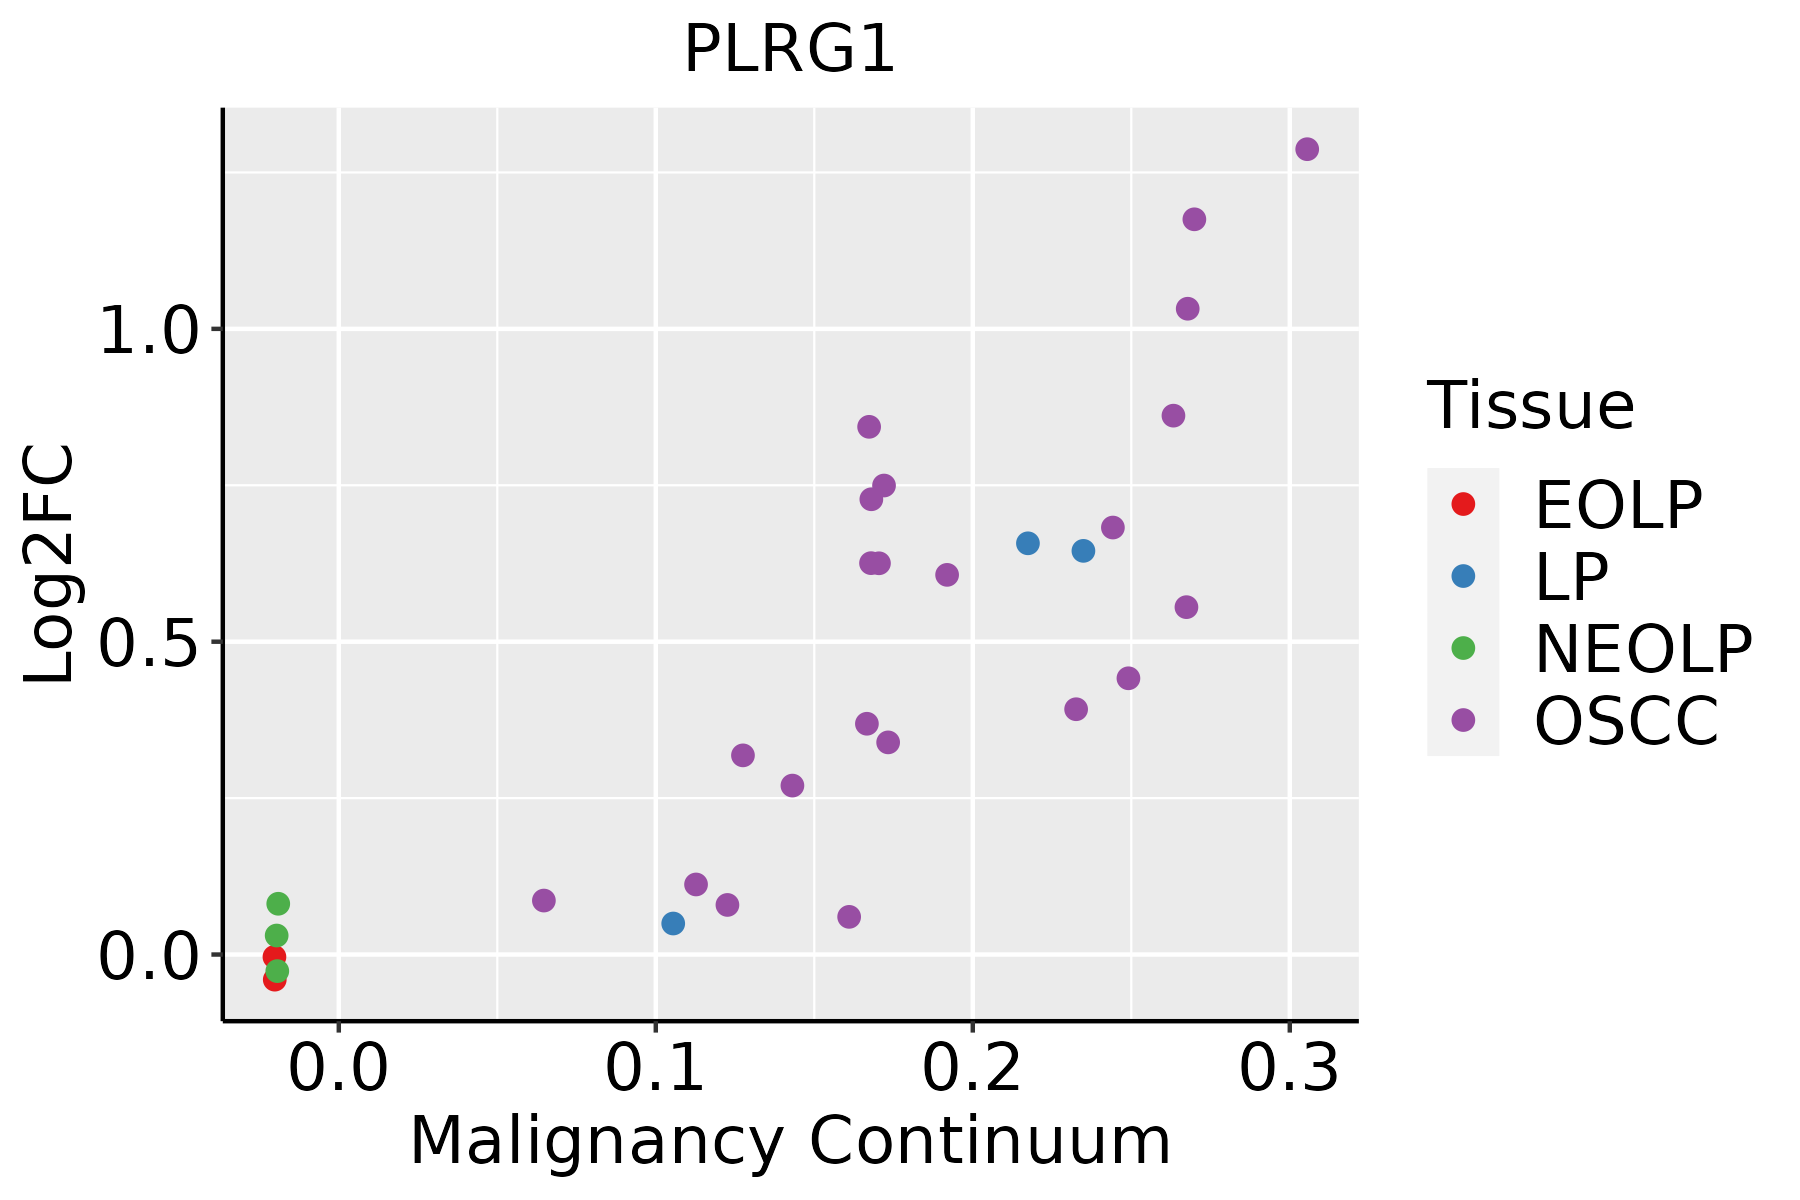 | EOLP: Erosive Oral lichen planus |
| LP: leukoplakia | ||
| NEOLP: Non-erosive oral lichen planus | ||
| OSCC: Oral squamous cell carcinoma | ||
| Skin | 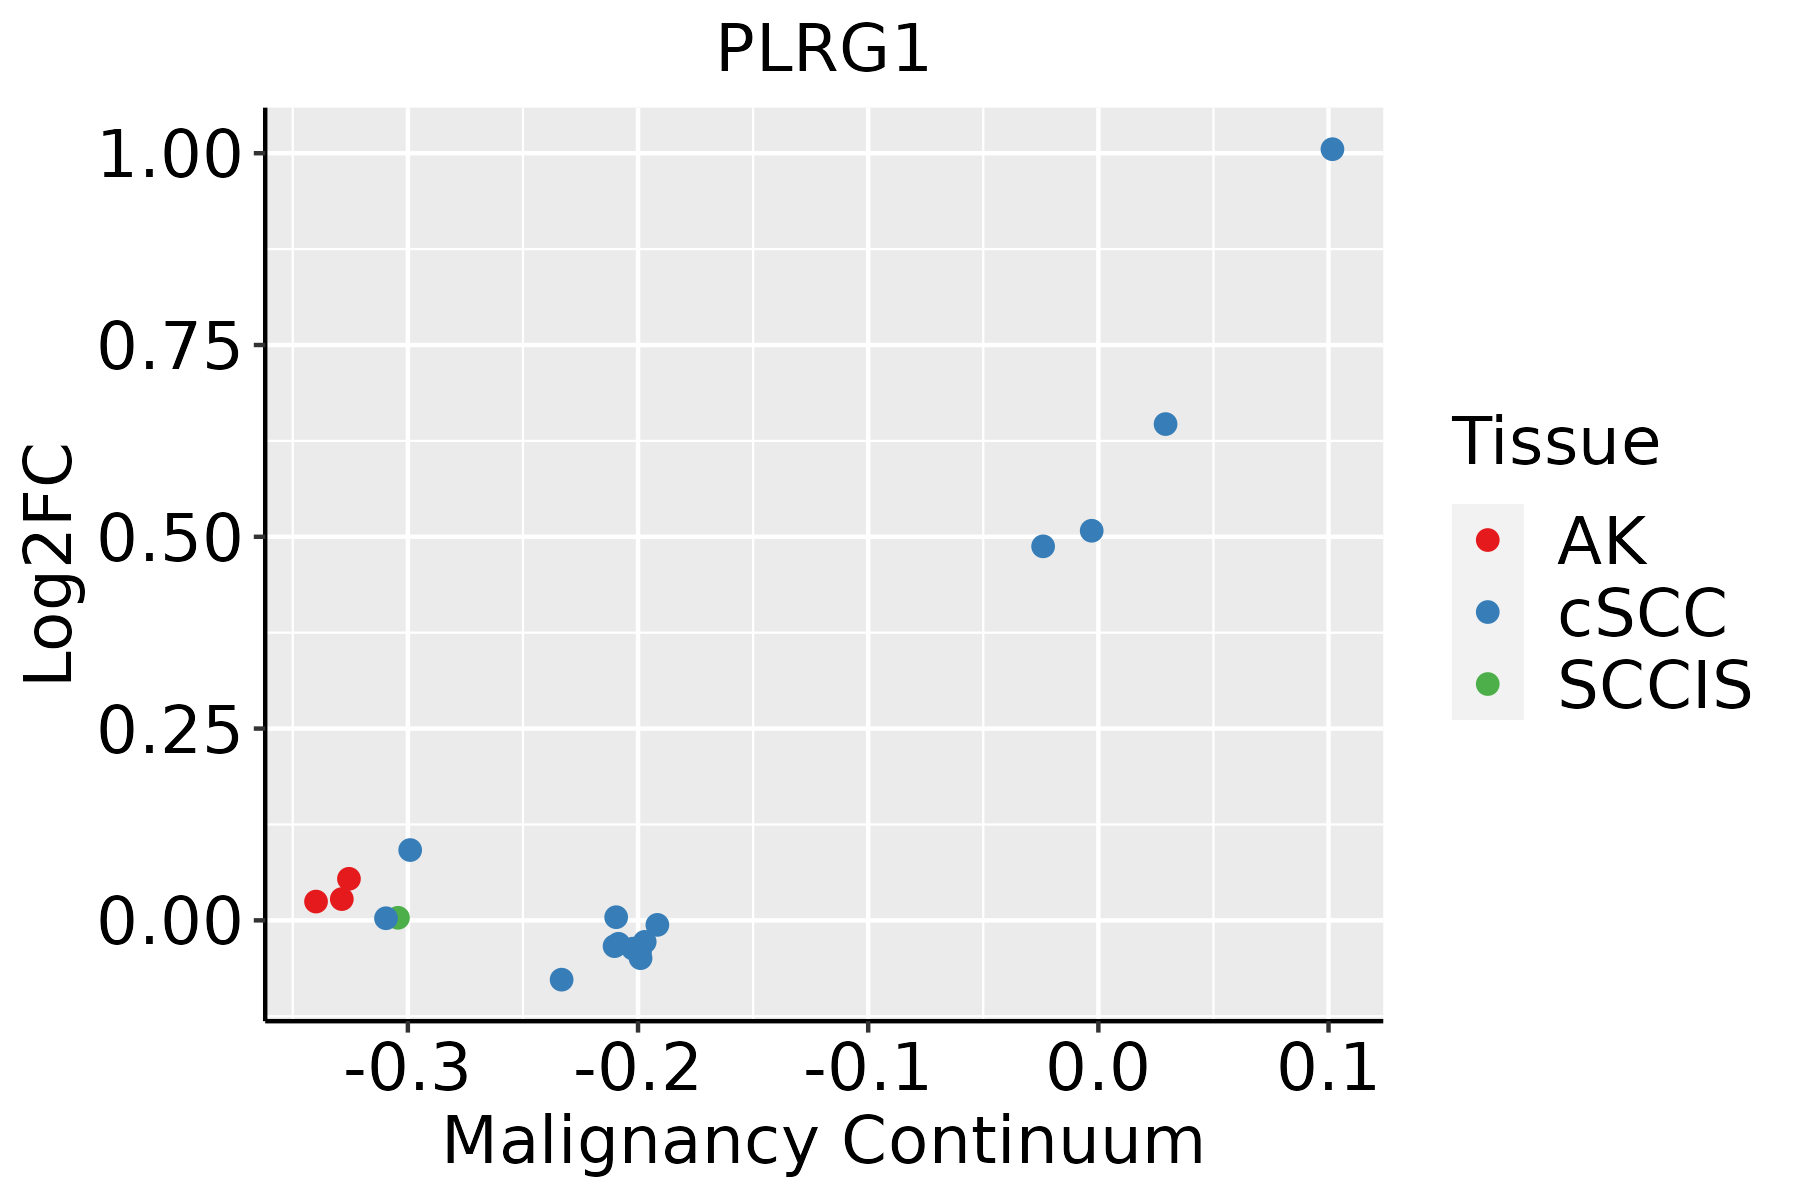 | AK: Actinic keratosis |
| cSCC: Cutaneous squamous cell carcinoma | ||
| SCCIS:squamous cell carcinoma in situ | ||
| Thyroid |  | ATC: Anaplastic thyroid cancer |
| HT: Hashimoto's thyroiditis | ||
| PTC: Papillary thyroid cancer |
| ∗log2FC in expression of this searched gene in stem-like cells from each diseased tissue sample relative to stem-like cells in normal samples in each tissue plotted against the malignancy continuum. Samples are colored based on if they are from different disease stage. |
Top |
Malignant transformation related pathway analysis |
| Find out the enriched GO biological processes and KEGG pathways involved in transition from healthy to precancer to cancer |
| Tissue | Disease Stage | Enriched GO biological Processes |
| Colorectum | AD |  |
| Colorectum | SER |  |
| Colorectum | MSS |  |
| Colorectum | MSI-H |  |
| Colorectum | FAP |  |
| ∗Top 15 enriched GO BP terms are showed in the bar plot of each disease state in each tissue. Each row represents a significant GO biological process which is colored according to the -log10(p.adjust). |
| Page: 1 2 3 4 5 6 7 8 9 |
| GO ID | Tissue | Disease Stage | Description | Gene Ratio | Bg Ratio | pvalue | p.adjust | Count |
| GO:000838026 | Esophagus | HGIN | RNA splicing | 160/2587 | 434/18723 | 3.74e-34 | 1.12e-30 | 160 |
| GO:000037520 | Esophagus | HGIN | RNA splicing, via transesterification reactions | 115/2587 | 324/18723 | 3.16e-23 | 3.80e-20 | 115 |
| GO:000037720 | Esophagus | HGIN | RNA splicing, via transesterification reactions with bulged adenosine as nucleophile | 113/2587 | 320/18723 | 1.24e-22 | 9.26e-20 | 113 |
| GO:000039820 | Esophagus | HGIN | mRNA splicing, via spliceosome | 113/2587 | 320/18723 | 1.24e-22 | 9.26e-20 | 113 |
| GO:003450417 | Esophagus | HGIN | protein localization to nucleus | 84/2587 | 290/18723 | 1.06e-11 | 1.24e-09 | 84 |
| GO:000734610 | Esophagus | HGIN | regulation of mitotic cell cycle | 98/2587 | 457/18723 | 4.39e-06 | 1.42e-04 | 98 |
| GO:00447729 | Esophagus | HGIN | mitotic cell cycle phase transition | 89/2587 | 424/18723 | 2.80e-05 | 7.21e-04 | 89 |
| GO:19019906 | Esophagus | HGIN | regulation of mitotic cell cycle phase transition | 65/2587 | 299/18723 | 1.12e-04 | 2.36e-03 | 65 |
| GO:20000456 | Esophagus | HGIN | regulation of G1/S transition of mitotic cell cycle | 36/2587 | 142/18723 | 1.74e-04 | 3.35e-03 | 36 |
| GO:00000827 | Esophagus | HGIN | G1/S transition of mitotic cell cycle | 48/2587 | 214/18723 | 3.97e-04 | 6.07e-03 | 48 |
| GO:00448437 | Esophagus | HGIN | cell cycle G1/S phase transition | 52/2587 | 241/18723 | 6.19e-04 | 8.58e-03 | 52 |
| GO:19028065 | Esophagus | HGIN | regulation of cell cycle G1/S phase transition | 39/2587 | 168/18723 | 6.60e-04 | 9.03e-03 | 39 |
| GO:004593110 | Esophagus | HGIN | positive regulation of mitotic cell cycle | 28/2587 | 121/18723 | 3.72e-03 | 3.39e-02 | 28 |
| GO:19019876 | Esophagus | HGIN | regulation of cell cycle phase transition | 72/2587 | 390/18723 | 5.78e-03 | 4.70e-02 | 72 |
| GO:0008380111 | Esophagus | ESCC | RNA splicing | 336/8552 | 434/18723 | 1.74e-42 | 3.67e-39 | 336 |
| GO:0000375111 | Esophagus | ESCC | RNA splicing, via transesterification reactions | 248/8552 | 324/18723 | 3.05e-30 | 1.49e-27 | 248 |
| GO:0000377111 | Esophagus | ESCC | RNA splicing, via transesterification reactions with bulged adenosine as nucleophile | 244/8552 | 320/18723 | 2.52e-29 | 1.07e-26 | 244 |
| GO:0000398111 | Esophagus | ESCC | mRNA splicing, via spliceosome | 244/8552 | 320/18723 | 2.52e-29 | 1.07e-26 | 244 |
| GO:003450418 | Esophagus | ESCC | protein localization to nucleus | 211/8552 | 290/18723 | 4.06e-21 | 6.60e-19 | 211 |
| GO:004477216 | Esophagus | ESCC | mitotic cell cycle phase transition | 281/8552 | 424/18723 | 4.63e-18 | 4.45e-16 | 281 |
| Page: 1 2 3 4 5 6 7 8 |
| Pathway ID | Tissue | Disease Stage | Description | Gene Ratio | Bg Ratio | pvalue | p.adjust | qvalue | Count |
| hsa0304018 | Esophagus | HGIN | Spliceosome | 79/1383 | 217/8465 | 3.22e-13 | 7.00e-12 | 5.56e-12 | 79 |
| hsa0304019 | Esophagus | HGIN | Spliceosome | 79/1383 | 217/8465 | 3.22e-13 | 7.00e-12 | 5.56e-12 | 79 |
| hsa0304027 | Esophagus | ESCC | Spliceosome | 128/4205 | 217/8465 | 3.31e-03 | 8.79e-03 | 4.50e-03 | 128 |
| hsa0304037 | Esophagus | ESCC | Spliceosome | 128/4205 | 217/8465 | 3.31e-03 | 8.79e-03 | 4.50e-03 | 128 |
| hsa030407 | Liver | Cirrhotic | Spliceosome | 102/2530 | 217/8465 | 5.69e-08 | 9.47e-07 | 5.84e-07 | 102 |
| hsa0304012 | Liver | Cirrhotic | Spliceosome | 102/2530 | 217/8465 | 5.69e-08 | 9.47e-07 | 5.84e-07 | 102 |
| hsa0304022 | Liver | HCC | Spliceosome | 122/4020 | 217/8465 | 5.55e-03 | 1.60e-02 | 8.91e-03 | 122 |
| hsa0304032 | Liver | HCC | Spliceosome | 122/4020 | 217/8465 | 5.55e-03 | 1.60e-02 | 8.91e-03 | 122 |
| hsa0304016 | Oral cavity | OSCC | Spliceosome | 123/3704 | 217/8465 | 7.21e-05 | 2.74e-04 | 1.40e-04 | 123 |
| hsa0304017 | Oral cavity | OSCC | Spliceosome | 123/3704 | 217/8465 | 7.21e-05 | 2.74e-04 | 1.40e-04 | 123 |
| hsa0304026 | Oral cavity | LP | Spliceosome | 106/2418 | 217/8465 | 1.30e-10 | 2.40e-09 | 1.55e-09 | 106 |
| hsa0304036 | Oral cavity | LP | Spliceosome | 106/2418 | 217/8465 | 1.30e-10 | 2.40e-09 | 1.55e-09 | 106 |
| Page: 1 |
Top |
Cell-cell communication analysis |
| Identification of potential cell-cell interactions between two cell types and their ligand-receptor pairs for different disease states |
| Ligand | Receptor | LRpair | Pathway | Tissue | Disease Stage |
| Page: 1 |
Top |
Single-cell gene regulatory network inference analysis |
| Find out the significant the regulons (TFs) and the target genes of each regulon across cell types for different disease states |
| TF | Cell Type | Tissue | Disease Stage | Target Gene | RSS | Regulon Activity |
| ∗The dot plots of a searched regulon are shown for all cell subpopulations in each disease state of each tissue based on the regulon specific score inferred using pySCENIC and by calculating the average expression. |
| Page: 1 |
Top |
Somatic mutation of malignant transformation related genes |
| Annotation of somatic variants for genes involved in malignant transformation |
| Hugo Symbol | Variant Class | Variant Classification | dbSNP RS | HGVSc | HGVSp | HGVSp Short | SWISSPROT | BIOTYPE | SIFT | PolyPhen | Tumor Sample Barcode | Tissue | Histology | Sex | Age | Stage | Therapy Types | Drugs | Outcome |
| PLRG1 | SNV | Missense_Mutation | novel | c.721T>G | p.Ser241Ala | p.S241A | O43660 | protein_coding | deleterious(0) | possibly_damaging(0.823) | TCGA-A8-A07G-01 | Breast | breast invasive carcinoma | Female | >=65 | I/II | Chemotherapy | 5-fluorouracil | CR |
| PLRG1 | SNV | Missense_Mutation | c.548N>A | p.Pro183His | p.P183H | O43660 | protein_coding | deleterious(0.05) | benign(0.053) | TCGA-AN-A0AK-01 | Breast | breast invasive carcinoma | Female | >=65 | I/II | Unknown | Unknown | SD | |
| PLRG1 | SNV | Missense_Mutation | novel | c.901N>A | p.Asp301Asn | p.D301N | O43660 | protein_coding | deleterious(0) | probably_damaging(0.994) | TCGA-C8-A8HQ-01 | Breast | breast invasive carcinoma | Female | <65 | I/II | Unknown | Unknown | SD |
| PLRG1 | SNV | Missense_Mutation | c.600C>G | p.Ile200Met | p.I200M | O43660 | protein_coding | deleterious(0) | probably_damaging(0.956) | TCGA-E2-A152-01 | Breast | breast invasive carcinoma | Female | <65 | I/II | Targeted Molecular therapy | trastuzumab | PD | |
| PLRG1 | SNV | Missense_Mutation | c.844N>T | p.Arg282Trp | p.R282W | O43660 | protein_coding | deleterious(0) | probably_damaging(0.991) | TCGA-FU-A3HZ-01 | Cervix | cervical & endocervical cancer | Female | <65 | I/II | Chemotherapy | cisplatin | CR | |
| PLRG1 | SNV | Missense_Mutation | c.82N>A | p.Asp28Asn | p.D28N | O43660 | protein_coding | tolerated(0.36) | benign(0.023) | TCGA-JW-A5VJ-01 | Cervix | cervical & endocervical cancer | Female | <65 | I/II | Unknown | Unknown | PD | |
| PLRG1 | SNV | Missense_Mutation | c.145C>T | p.Arg49Cys | p.R49C | O43660 | protein_coding | deleterious(0) | possibly_damaging(0.462) | TCGA-AA-3510-01 | Colorectum | colon adenocarcinoma | Male | >=65 | I/II | Unknown | Unknown | SD | |
| PLRG1 | SNV | Missense_Mutation | rs760558300 | c.578N>T | p.Pro193Leu | p.P193L | O43660 | protein_coding | deleterious(0) | probably_damaging(0.982) | TCGA-AA-3947-01 | Colorectum | colon adenocarcinoma | Female | <65 | I/II | Unknown | Unknown | SD |
| PLRG1 | SNV | Missense_Mutation | c.50N>T | p.Ser17Leu | p.S17L | O43660 | protein_coding | deleterious(0.01) | possibly_damaging(0.548) | TCGA-AA-3977-01 | Colorectum | colon adenocarcinoma | Male | >=65 | I/II | Unknown | Unknown | SD | |
| PLRG1 | SNV | Missense_Mutation | c.146N>A | p.Arg49His | p.R49H | O43660 | protein_coding | tolerated(0.16) | benign(0) | TCGA-AA-A010-01 | Colorectum | colon adenocarcinoma | Female | <65 | I/II | Chemotherapy | folinic | CR |
| Page: 1 2 3 4 5 6 7 |
Top |
Related drugs of malignant transformation related genes |
| Identification of chemicals and drugs interact with genes involved in malignant transfromation |
| (DGIdb 4.0) |
| Entrez ID | Symbol | Category | Interaction Types | Drug Claim Name | Drug Name | PMIDs |
| Page: 1 |

Copyright 2023-Present -The University of Texas Health Science Center at Houston |