
|
|||||
|
 | |
| |
| |
| |
| |
| |
|
Gene: PLPPR1 |
Gene summary for PLPPR1 |
| Gene information | Species | Human | Gene symbol | PLPPR1 | Gene ID | 54886 |
| Gene name | phospholipid phosphatase related 1 | |
| Gene Alias | LPPR1 | |
| Cytomap | 9q31.1 | |
| Gene Type | protein-coding | GO ID | GO:0006629 | UniProtAcc | A0A024R154 |
Top |
Malignant transformation analysis |
| Identification of the aberrant gene expression in precancerous and cancerous lesions by comparing the gene expression of stem-like cells in diseased tissues with normal stem cells |
| Entrez ID | Symbol | Replicates | Species | Organ | Tissue | Adj P-value | Log2FC | Malignancy |
| 54886 | PLPPR1 | NAFLD1 | Human | Liver | NAFLD | 5.78e-06 | 5.09e-01 | -0.04 |
| 54886 | PLPPR1 | S41 | Human | Liver | Cirrhotic | 4.20e-03 | 4.09e-01 | -0.0343 |
| 54886 | PLPPR1 | HCC1_Meng | Human | Liver | HCC | 1.62e-08 | -6.54e-03 | 0.0246 |
| 54886 | PLPPR1 | HCC1 | Human | Liver | HCC | 3.19e-03 | 2.84e+00 | 0.5336 |
| 54886 | PLPPR1 | S014 | Human | Liver | HCC | 1.06e-17 | 8.12e-01 | 0.2254 |
| 54886 | PLPPR1 | S015 | Human | Liver | HCC | 6.69e-16 | 8.33e-01 | 0.2375 |
| 54886 | PLPPR1 | S016 | Human | Liver | HCC | 1.04e-32 | 1.02e+00 | 0.2243 |
| 54886 | PLPPR1 | RNA-P6T2-P6T2-1 | Human | Lung | IAC | 2.59e-04 | 3.02e-01 | -0.0166 |
| 54886 | PLPPR1 | RNA-P6T2-P6T2-2 | Human | Lung | IAC | 6.69e-08 | 3.86e-01 | -0.0132 |
| 54886 | PLPPR1 | RNA-P6T2-P6T2-3 | Human | Lung | IAC | 1.62e-03 | 2.42e-01 | -0.013 |
| 54886 | PLPPR1 | RNA-P6T2-P6T2-4 | Human | Lung | IAC | 1.78e-03 | 2.98e-01 | -0.0121 |
| 54886 | PLPPR1 | RNA-P7T1-P7T1-1 | Human | Lung | AIS | 1.94e-03 | 6.04e-01 | -0.0961 |
| 54886 | PLPPR1 | RNA-P7T1-P7T1-4 | Human | Lung | AIS | 4.57e-03 | 5.80e-01 | -0.0809 |
| Page: 1 |
| Tissue | Expression Dynamics | Abbreviation |
| Liver | 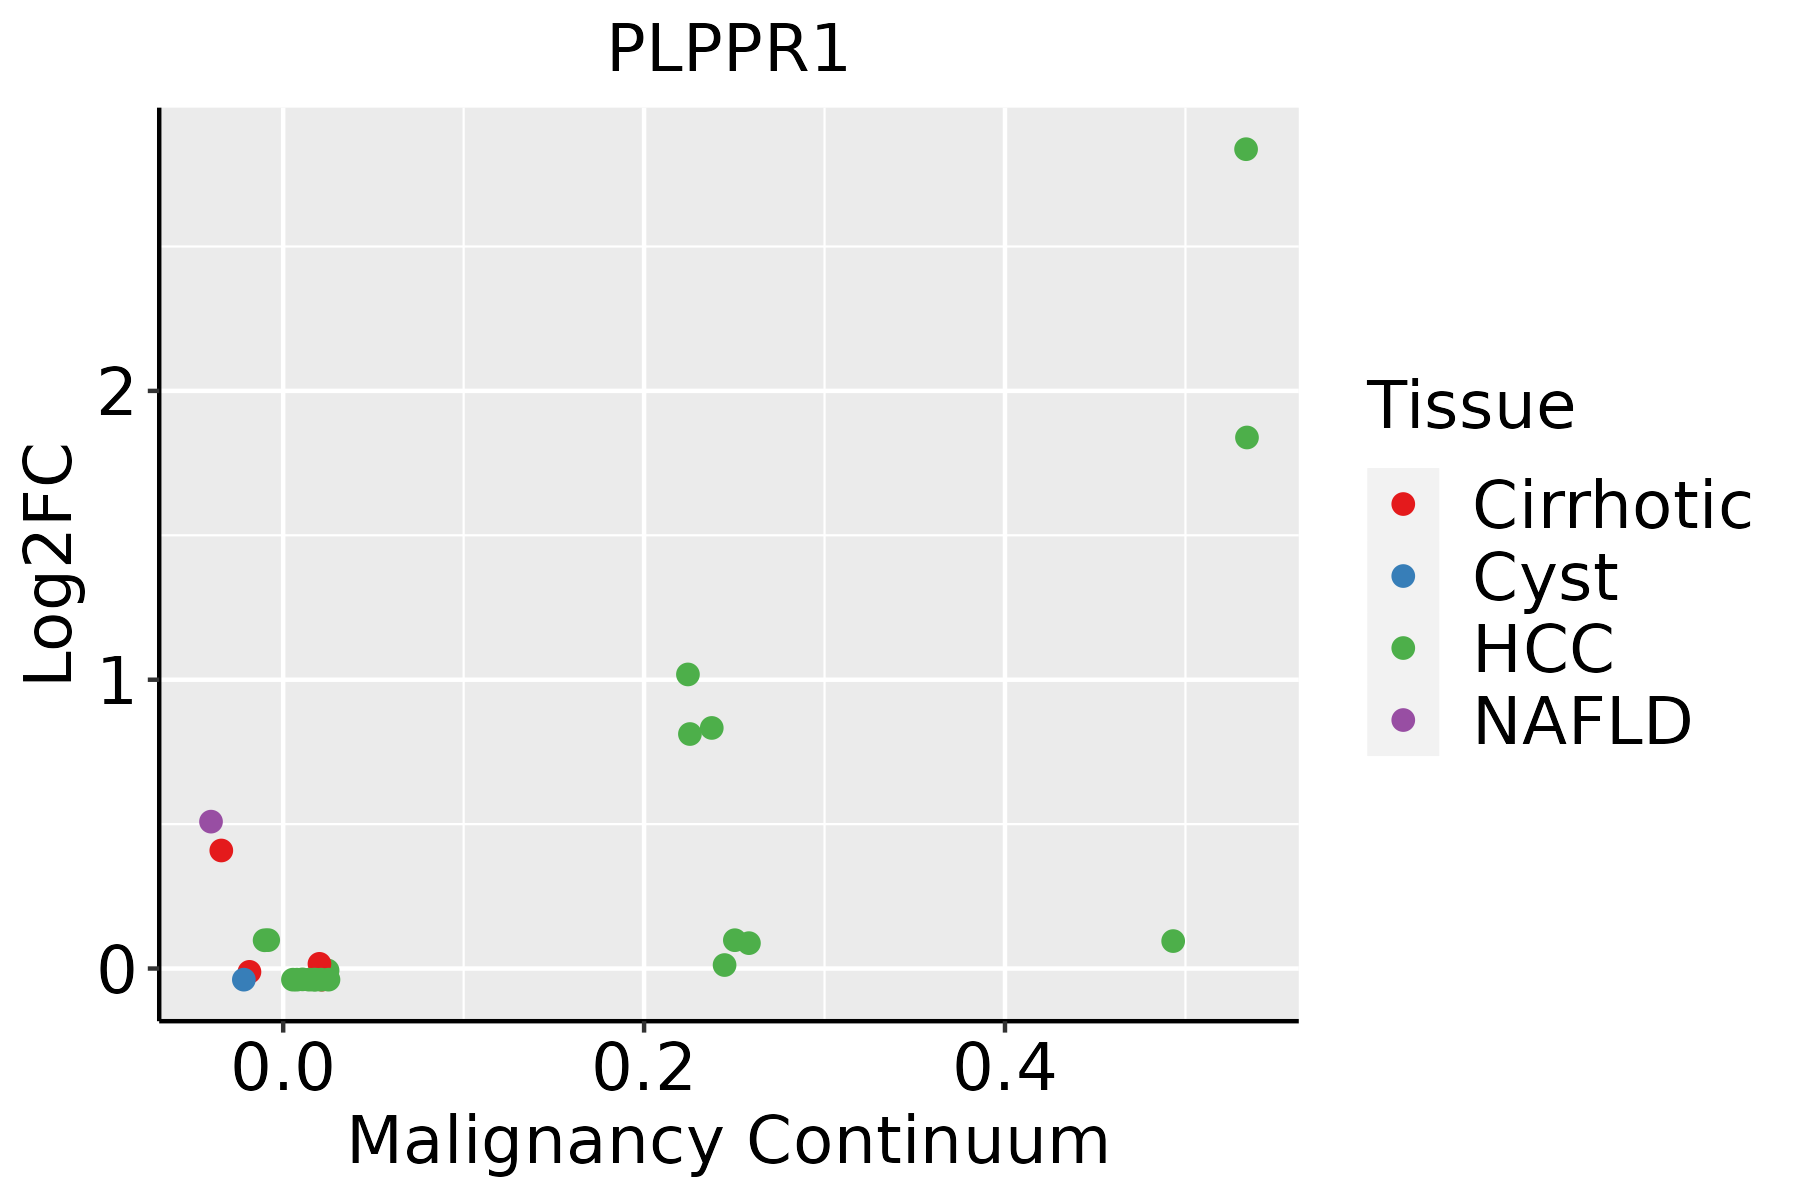 | HCC: Hepatocellular carcinoma |
| NAFLD: Non-alcoholic fatty liver disease | ||
| Lung | 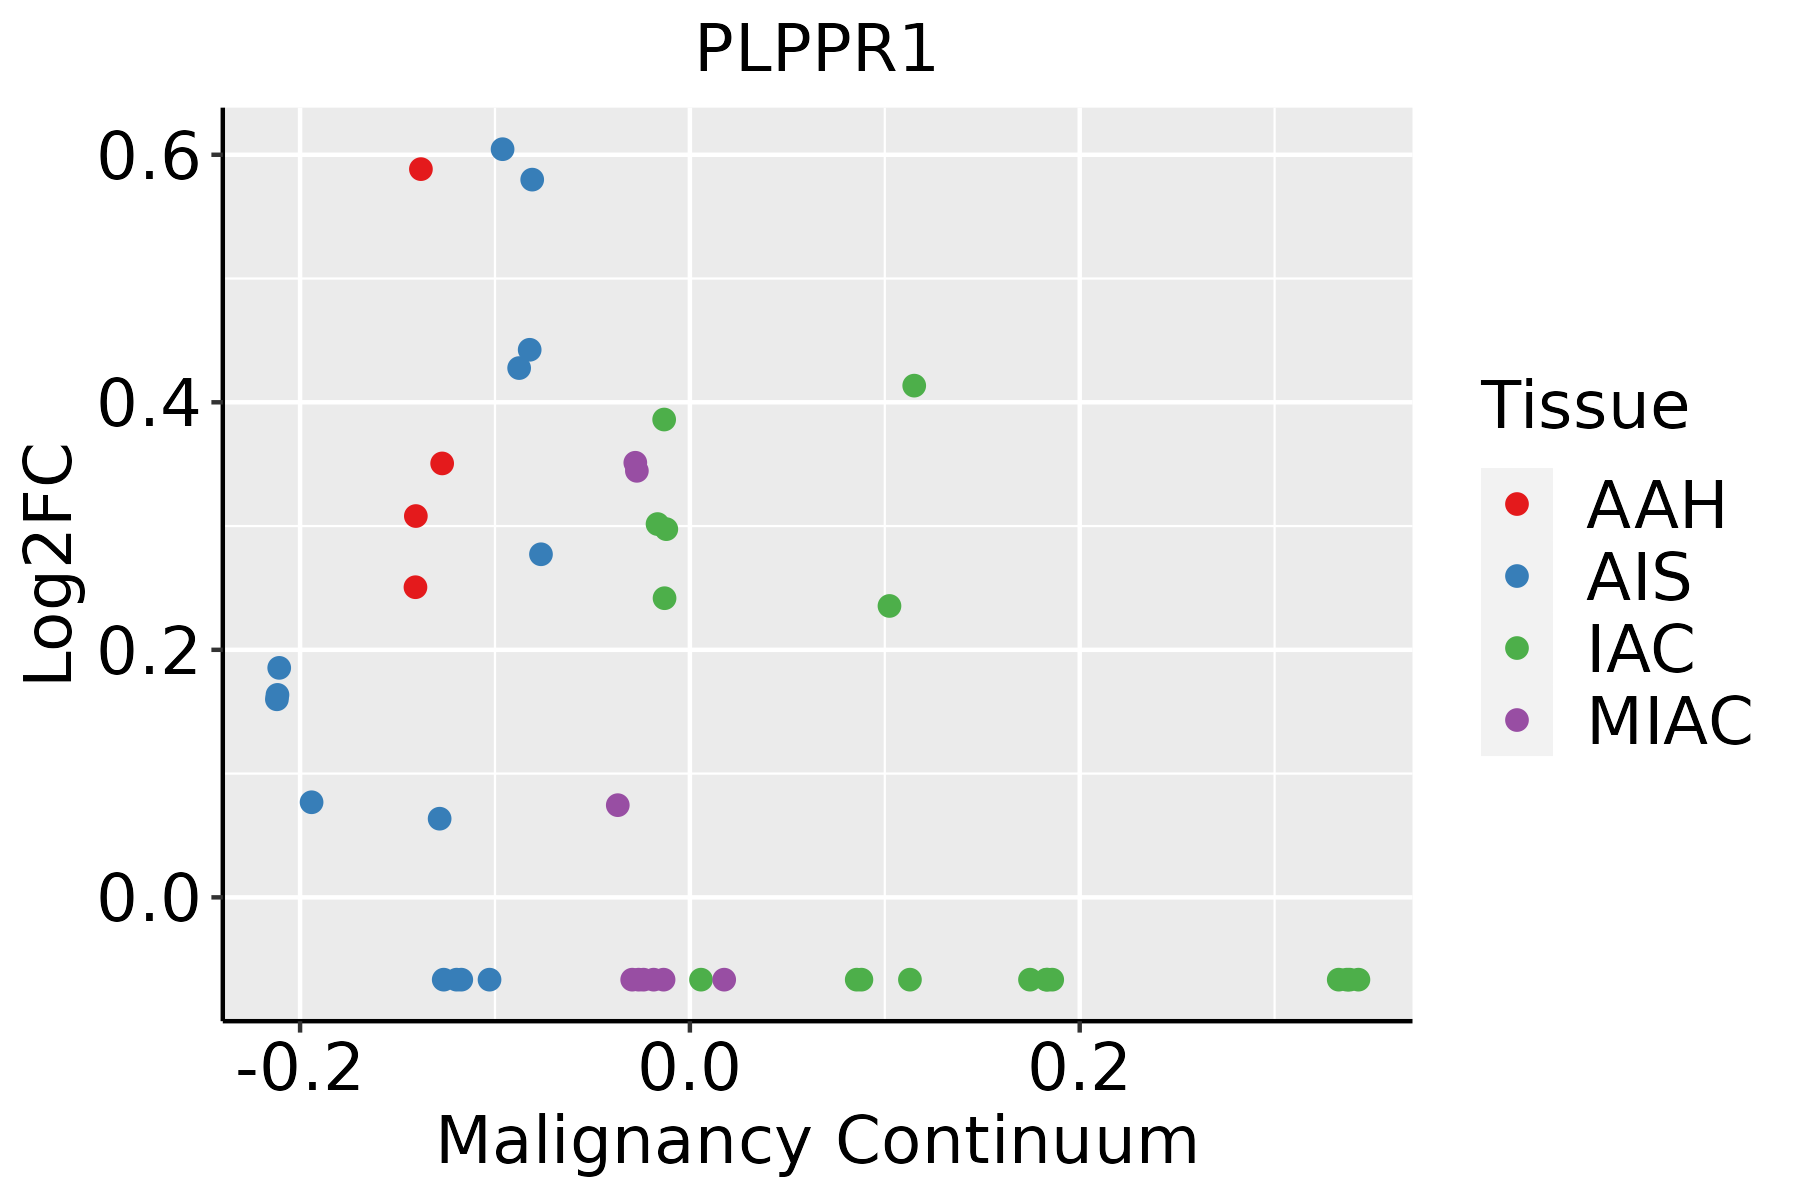 | AAH: Atypical adenomatous hyperplasia |
| AIS: Adenocarcinoma in situ | ||
| IAC: Invasive lung adenocarcinoma | ||
| MIA: Minimally invasive adenocarcinoma |
| ∗log2FC in expression of this searched gene in stem-like cells from each diseased tissue sample relative to stem-like cells in normal samples in each tissue plotted against the malignancy continuum. Samples are colored based on if they are from different disease stage. |
Top |
Malignant transformation related pathway analysis |
| Find out the enriched GO biological processes and KEGG pathways involved in transition from healthy to precancer to cancer |
| Tissue | Disease Stage | Enriched GO biological Processes |
| Colorectum | AD |  |
| Colorectum | SER |  |
| Colorectum | MSS |  |
| Colorectum | MSI-H |  |
| Colorectum | FAP |  |
| ∗Top 15 enriched GO BP terms are showed in the bar plot of each disease state in each tissue. Each row represents a significant GO biological process which is colored according to the -log10(p.adjust). |
| Page: 1 2 3 4 5 6 7 8 9 |
| GO ID | Tissue | Disease Stage | Description | Gene Ratio | Bg Ratio | pvalue | p.adjust | Count |
| GO:00302585 | Liver | NAFLD | lipid modification | 49/1882 | 212/18723 | 1.97e-08 | 2.17e-06 | 49 |
| GO:00163115 | Liver | NAFLD | dephosphorylation | 69/1882 | 417/18723 | 2.27e-05 | 6.23e-04 | 69 |
| GO:003025811 | Liver | Cirrhotic | lipid modification | 75/4634 | 212/18723 | 3.33e-04 | 2.87e-03 | 75 |
| GO:001631111 | Liver | Cirrhotic | dephosphorylation | 130/4634 | 417/18723 | 1.58e-03 | 1.03e-02 | 130 |
| GO:00066444 | Liver | HCC | phospholipid metabolic process | 214/7958 | 383/18723 | 7.25e-08 | 1.48e-06 | 214 |
| GO:001631121 | Liver | HCC | dephosphorylation | 230/7958 | 417/18723 | 1.00e-07 | 1.96e-06 | 230 |
| GO:003025821 | Liver | HCC | lipid modification | 123/7958 | 212/18723 | 3.50e-06 | 4.58e-05 | 123 |
| GO:00163116 | Lung | IAC | dephosphorylation | 75/2061 | 417/18723 | 1.21e-05 | 3.64e-04 | 75 |
| GO:001631112 | Lung | AIS | dephosphorylation | 69/1849 | 417/18723 | 1.27e-05 | 4.78e-04 | 69 |
| Page: 1 |
| Pathway ID | Tissue | Disease Stage | Description | Gene Ratio | Bg Ratio | pvalue | p.adjust | qvalue | Count |
| Page: 1 |
Top |
Cell-cell communication analysis |
| Identification of potential cell-cell interactions between two cell types and their ligand-receptor pairs for different disease states |
| Ligand | Receptor | LRpair | Pathway | Tissue | Disease Stage |
| Page: 1 |
Top |
Single-cell gene regulatory network inference analysis |
| Find out the significant the regulons (TFs) and the target genes of each regulon across cell types for different disease states |
| TF | Cell Type | Tissue | Disease Stage | Target Gene | RSS | Regulon Activity |
| ∗The dot plots of a searched regulon are shown for all cell subpopulations in each disease state of each tissue based on the regulon specific score inferred using pySCENIC and by calculating the average expression. |
| Page: 1 |
Top |
Somatic mutation of malignant transformation related genes |
| Annotation of somatic variants for genes involved in malignant transformation |
| Hugo Symbol | Variant Class | Variant Classification | dbSNP RS | HGVSc | HGVSp | HGVSp Short | SWISSPROT | BIOTYPE | SIFT | PolyPhen | Tumor Sample Barcode | Tissue | Histology | Sex | Age | Stage | Therapy Types | Drugs | Outcome |
| PLPPR1 | SNV | Missense_Mutation | novel | c.415N>A | p.Asp139Asn | p.D139N | Q8TBJ4 | protein_coding | tolerated(0.1) | possibly_damaging(0.538) | TCGA-A7-A3J1-01 | Breast | breast invasive carcinoma | Female | <65 | I/II | Hormone Therapy | anastrazole | SD |
| PLPPR1 | SNV | Missense_Mutation | rs768378346 | c.556N>A | p.Leu186Met | p.L186M | Q8TBJ4 | protein_coding | deleterious(0.02) | benign(0.003) | TCGA-A7-A6VV-01 | Breast | breast invasive carcinoma | Female | <65 | I/II | Chemotherapy | cyclophosphamide | CR |
| PLPPR1 | SNV | Missense_Mutation | c.874N>A | p.Glu292Lys | p.E292K | Q8TBJ4 | protein_coding | tolerated(0.11) | benign(0.062) | TCGA-B6-A0IK-01 | Breast | breast invasive carcinoma | Female | <65 | III/IV | Unknown | Unknown | PD | |
| PLPPR1 | SNV | Missense_Mutation | c.244N>C | p.Thr82Pro | p.T82P | Q8TBJ4 | protein_coding | deleterious(0.02) | benign(0.307) | TCGA-BH-A18V-01 | Breast | breast invasive carcinoma | Female | <65 | I/II | Unknown | Unknown | SD | |
| PLPPR1 | insertion | Frame_Shift_Ins | novel | c.803_804insAT | p.Leu269SerfsTer32 | p.L269Sfs*32 | Q8TBJ4 | protein_coding | TCGA-AN-A0FX-01 | Breast | breast invasive carcinoma | Female | <65 | I/II | Unknown | Unknown | SD | ||
| PLPPR1 | insertion | Frame_Shift_Ins | novel | c.804_805insTCAGA | p.Leu269SerfsTer33 | p.L269Sfs*33 | Q8TBJ4 | protein_coding | TCGA-AN-A0FX-01 | Breast | breast invasive carcinoma | Female | <65 | I/II | Unknown | Unknown | SD | ||
| PLPPR1 | SNV | Missense_Mutation | rs768378346 | c.556N>A | p.Leu186Met | p.L186M | Q8TBJ4 | protein_coding | deleterious(0.02) | benign(0.003) | TCGA-A6-6649-01 | Colorectum | colon adenocarcinoma | Male | >=65 | III/IV | Chemotherapy | fluorouracil | SD |
| PLPPR1 | SNV | Missense_Mutation | c.779G>T | p.Gly260Val | p.G260V | Q8TBJ4 | protein_coding | deleterious(0) | probably_damaging(0.958) | TCGA-CK-4947-01 | Colorectum | colon adenocarcinoma | Female | <65 | III/IV | Other, specify in notes | folinic | SD | |
| PLPPR1 | SNV | Missense_Mutation | c.55N>C | p.Phe19Leu | p.F19L | Q8TBJ4 | protein_coding | tolerated(0.08) | benign(0) | TCGA-DM-A1D4-01 | Colorectum | colon adenocarcinoma | Male | >=65 | I/II | Unknown | Unknown | PD | |
| PLPPR1 | SNV | Missense_Mutation | c.608N>G | p.Leu203Arg | p.L203R | Q8TBJ4 | protein_coding | deleterious(0) | probably_damaging(0.999) | TCGA-DM-A1DA-01 | Colorectum | colon adenocarcinoma | Female | >=65 | III/IV | Unknown | Unknown | SD |
| Page: 1 2 3 4 5 6 |
Top |
Related drugs of malignant transformation related genes |
| Identification of chemicals and drugs interact with genes involved in malignant transfromation |
| (DGIdb 4.0) |
| Entrez ID | Symbol | Category | Interaction Types | Drug Claim Name | Drug Name | PMIDs |
| Page: 1 |

Copyright 2023-Present -The University of Texas Health Science Center at Houston |