
|
|||||
|
 | |
| |
| |
| |
| |
| |
|
Gene: PLPP6 |
Gene summary for PLPP6 |
| Gene information | Species | Human | Gene symbol | PLPP6 | Gene ID | 403313 |
| Gene name | phospholipid phosphatase 6 | |
| Gene Alias | PDP1 | |
| Cytomap | 9p24.1 | |
| Gene Type | protein-coding | GO ID | GO:0006066 | UniProtAcc | Q8IY26 |
Top |
Malignant transformation analysis |
| Identification of the aberrant gene expression in precancerous and cancerous lesions by comparing the gene expression of stem-like cells in diseased tissues with normal stem cells |
| Entrez ID | Symbol | Replicates | Species | Organ | Tissue | Adj P-value | Log2FC | Malignancy |
| 403313 | PLPP6 | LZE24T | Human | Esophagus | ESCC | 6.25e-06 | 1.75e-01 | 0.0596 |
| 403313 | PLPP6 | P2T-E | Human | Esophagus | ESCC | 2.02e-06 | 1.51e-01 | 0.1177 |
| 403313 | PLPP6 | P4T-E | Human | Esophagus | ESCC | 5.44e-09 | 1.40e-01 | 0.1323 |
| 403313 | PLPP6 | P8T-E | Human | Esophagus | ESCC | 3.97e-04 | 1.01e-01 | 0.0889 |
| 403313 | PLPP6 | P9T-E | Human | Esophagus | ESCC | 1.46e-06 | 1.19e-01 | 0.1131 |
| 403313 | PLPP6 | P10T-E | Human | Esophagus | ESCC | 3.75e-03 | 7.60e-02 | 0.116 |
| 403313 | PLPP6 | P12T-E | Human | Esophagus | ESCC | 1.66e-02 | 8.77e-02 | 0.1122 |
| 403313 | PLPP6 | P15T-E | Human | Esophagus | ESCC | 1.33e-02 | 6.57e-02 | 0.1149 |
| 403313 | PLPP6 | P16T-E | Human | Esophagus | ESCC | 1.88e-04 | 9.65e-02 | 0.1153 |
| 403313 | PLPP6 | P20T-E | Human | Esophagus | ESCC | 2.59e-03 | 7.90e-02 | 0.1124 |
| 403313 | PLPP6 | P23T-E | Human | Esophagus | ESCC | 5.73e-06 | 1.47e-01 | 0.108 |
| 403313 | PLPP6 | P24T-E | Human | Esophagus | ESCC | 1.92e-37 | 8.71e-01 | 0.1287 |
| 403313 | PLPP6 | P26T-E | Human | Esophagus | ESCC | 9.44e-07 | 1.57e-01 | 0.1276 |
| 403313 | PLPP6 | P30T-E | Human | Esophagus | ESCC | 1.79e-06 | 2.20e-01 | 0.137 |
| 403313 | PLPP6 | P32T-E | Human | Esophagus | ESCC | 4.41e-07 | 1.49e-01 | 0.1666 |
| 403313 | PLPP6 | P37T-E | Human | Esophagus | ESCC | 3.68e-04 | 9.89e-02 | 0.1371 |
| 403313 | PLPP6 | P40T-E | Human | Esophagus | ESCC | 9.15e-08 | 1.83e-01 | 0.109 |
| 403313 | PLPP6 | P47T-E | Human | Esophagus | ESCC | 3.50e-02 | 7.19e-02 | 0.1067 |
| 403313 | PLPP6 | P52T-E | Human | Esophagus | ESCC | 3.50e-02 | 5.85e-02 | 0.1555 |
| 403313 | PLPP6 | P57T-E | Human | Esophagus | ESCC | 3.50e-02 | 8.67e-02 | 0.0926 |
| Page: 1 2 |
| Tissue | Expression Dynamics | Abbreviation |
| Esophagus | 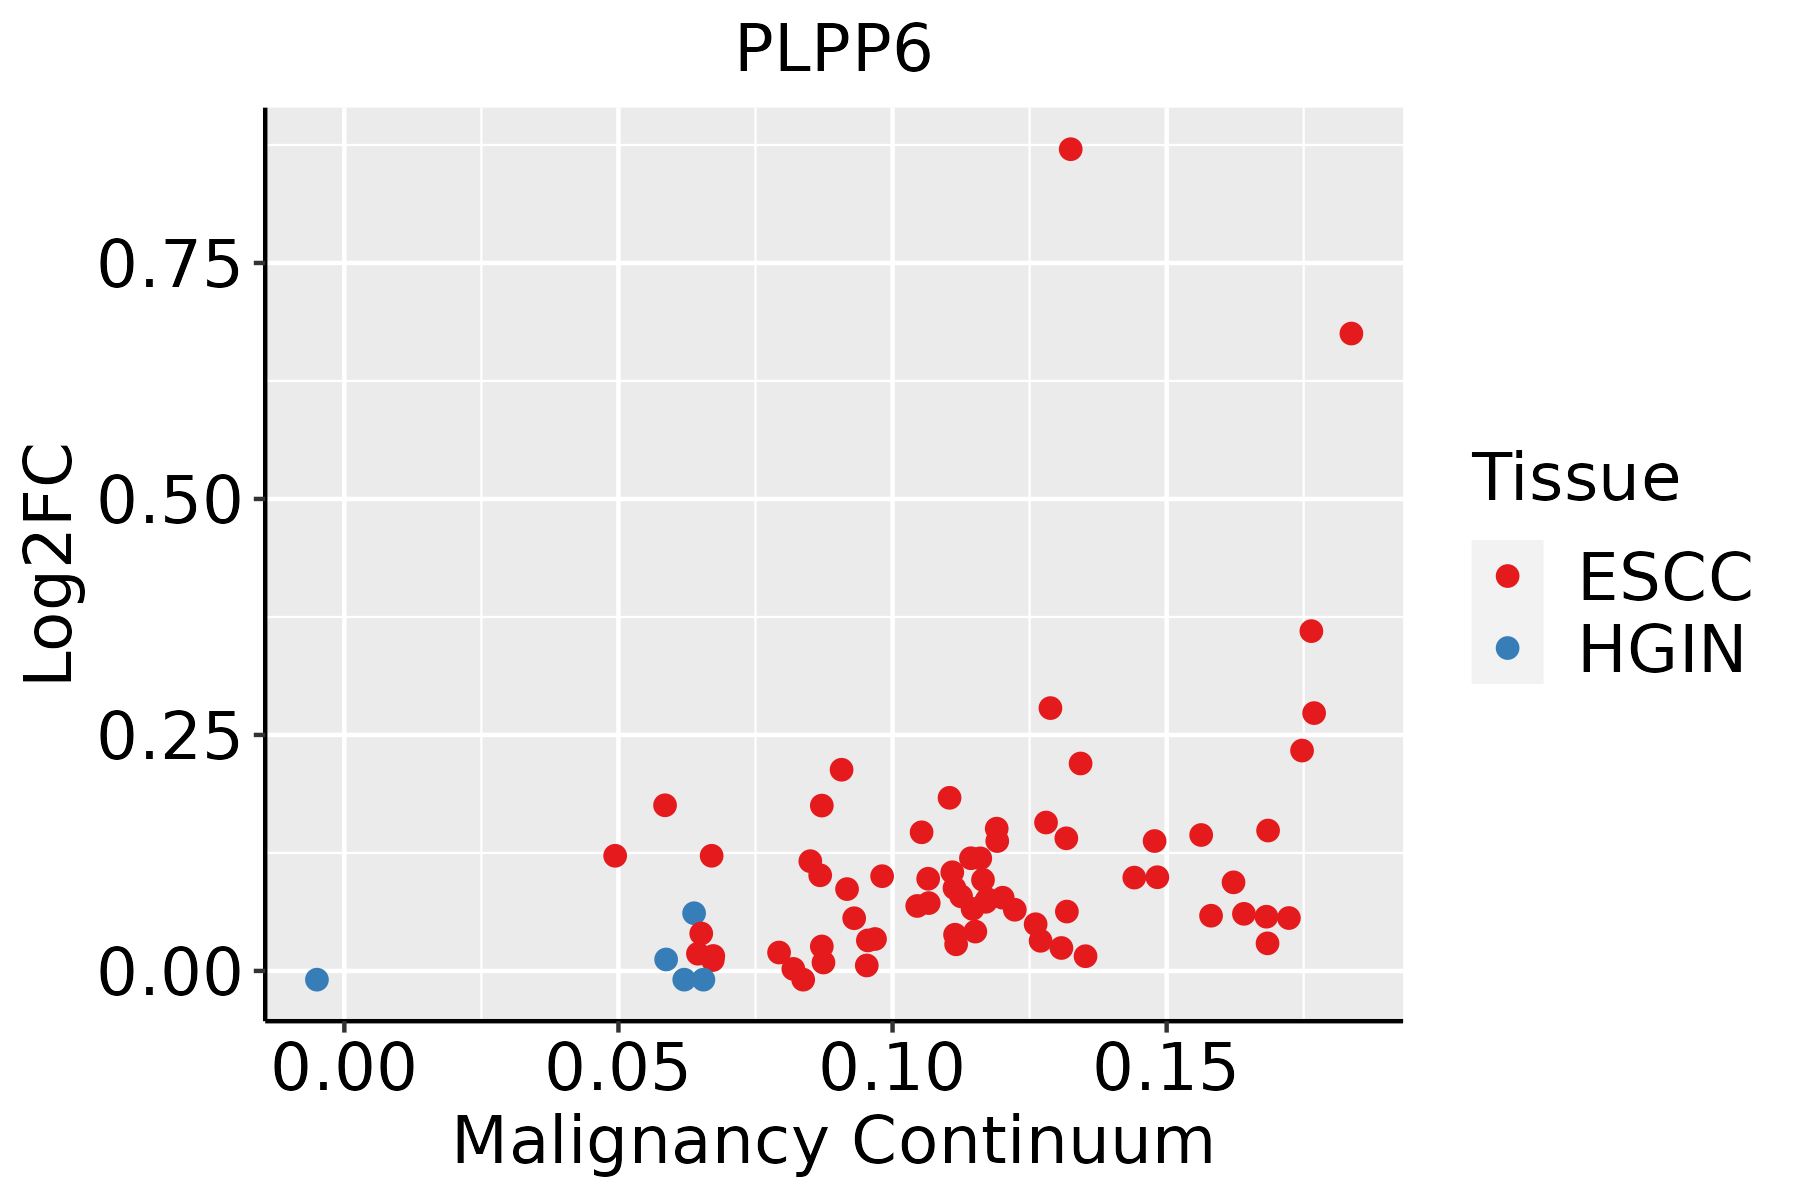 | ESCC: Esophageal squamous cell carcinoma |
| HGIN: High-grade intraepithelial neoplasias | ||
| LGIN: Low-grade intraepithelial neoplasias |
| ∗log2FC in expression of this searched gene in stem-like cells from each diseased tissue sample relative to stem-like cells in normal samples in each tissue plotted against the malignancy continuum. Samples are colored based on if they are from different disease stage. |
Top |
Malignant transformation related pathway analysis |
| Find out the enriched GO biological processes and KEGG pathways involved in transition from healthy to precancer to cancer |
| Tissue | Disease Stage | Enriched GO biological Processes |
| Colorectum | AD |  |
| Colorectum | SER |  |
| Colorectum | MSS |  |
| Colorectum | MSI-H |  |
| Colorectum | FAP |  |
| ∗Top 15 enriched GO BP terms are showed in the bar plot of each disease state in each tissue. Each row represents a significant GO biological process which is colored according to the -log10(p.adjust). |
| Page: 1 2 3 4 5 6 7 8 9 |
| GO ID | Tissue | Disease Stage | Description | Gene Ratio | Bg Ratio | pvalue | p.adjust | Count |
| GO:001631110 | Esophagus | ESCC | dephosphorylation | 251/8552 | 417/18723 | 1.26e-09 | 2.99e-08 | 251 |
| GO:00060668 | Esophagus | ESCC | alcohol metabolic process | 202/8552 | 353/18723 | 7.32e-06 | 7.26e-05 | 202 |
| GO:00161263 | Esophagus | ESCC | sterol biosynthetic process | 46/8552 | 64/18723 | 1.91e-05 | 1.67e-04 | 46 |
| GO:00066953 | Esophagus | ESCC | cholesterol biosynthetic process | 41/8552 | 57/18723 | 5.25e-05 | 4.06e-04 | 41 |
| GO:19026533 | Esophagus | ESCC | secondary alcohol biosynthetic process | 41/8552 | 57/18723 | 5.25e-05 | 4.06e-04 | 41 |
| GO:19026524 | Esophagus | ESCC | secondary alcohol metabolic process | 87/8552 | 147/18723 | 6.58e-04 | 3.50e-03 | 87 |
| GO:00461653 | Esophagus | ESCC | alcohol biosynthetic process | 83/8552 | 140/18723 | 8.04e-04 | 4.16e-03 | 83 |
| GO:00066946 | Esophagus | ESCC | steroid biosynthetic process | 98/8552 | 173/18723 | 2.34e-03 | 1.03e-02 | 98 |
| GO:00082034 | Esophagus | ESCC | cholesterol metabolic process | 79/8552 | 137/18723 | 3.11e-03 | 1.29e-02 | 79 |
| GO:00161254 | Esophagus | ESCC | sterol metabolic process | 86/8552 | 152/18723 | 4.37e-03 | 1.73e-02 | 86 |
| GO:00302586 | Esophagus | ESCC | lipid modification | 116/8552 | 212/18723 | 4.90e-03 | 1.89e-02 | 116 |
| GO:19016174 | Esophagus | ESCC | organic hydroxy compound biosynthetic process | 128/8552 | 237/18723 | 5.86e-03 | 2.16e-02 | 128 |
| Page: 1 |
| Pathway ID | Tissue | Disease Stage | Description | Gene Ratio | Bg Ratio | pvalue | p.adjust | qvalue | Count |
| Page: 1 |
Top |
Cell-cell communication analysis |
| Identification of potential cell-cell interactions between two cell types and their ligand-receptor pairs for different disease states |
| Ligand | Receptor | LRpair | Pathway | Tissue | Disease Stage |
| Page: 1 |
Top |
Single-cell gene regulatory network inference analysis |
| Find out the significant the regulons (TFs) and the target genes of each regulon across cell types for different disease states |
| TF | Cell Type | Tissue | Disease Stage | Target Gene | RSS | Regulon Activity |
| ∗The dot plots of a searched regulon are shown for all cell subpopulations in each disease state of each tissue based on the regulon specific score inferred using pySCENIC and by calculating the average expression. |
| Page: 1 |
Top |
Somatic mutation of malignant transformation related genes |
| Annotation of somatic variants for genes involved in malignant transformation |
| Hugo Symbol | Variant Class | Variant Classification | dbSNP RS | HGVSc | HGVSp | HGVSp Short | SWISSPROT | BIOTYPE | SIFT | PolyPhen | Tumor Sample Barcode | Tissue | Histology | Sex | Age | Stage | Therapy Types | Drugs | Outcome |
| PLPP6 | insertion | In_Frame_Ins | novel | c.800_801insCTCGGTGGACAAGTACTCCTTCCCCTC | p.Leu267_Gly268insSerValAspLysTyrSerPheProSer | p.L267_G268insSVDKYSFPS | Q8IY26 | protein_coding | TCGA-A8-A07G-01 | Breast | breast invasive carcinoma | Female | >=65 | I/II | Chemotherapy | 5-fluorouracil | CR | ||
| PLPP6 | SNV | Missense_Mutation | novel | c.443T>C | p.Leu148Pro | p.L148P | Q8IY26 | protein_coding | tolerated(0.13) | possibly_damaging(0.621) | TCGA-AA-A010-01 | Colorectum | colon adenocarcinoma | Female | <65 | I/II | Chemotherapy | folinic | CR |
| PLPP6 | SNV | Missense_Mutation | c.593A>G | p.Asp198Gly | p.D198G | Q8IY26 | protein_coding | tolerated(0.35) | probably_damaging(0.999) | TCGA-AA-A010-01 | Colorectum | colon adenocarcinoma | Female | <65 | I/II | Chemotherapy | folinic | CR | |
| PLPP6 | SNV | Missense_Mutation | c.345N>T | p.Lys115Asn | p.K115N | Q8IY26 | protein_coding | deleterious(0) | probably_damaging(0.997) | TCGA-AG-A002-01 | Colorectum | rectum adenocarcinoma | Male | <65 | I/II | Unknown | Unknown | SD | |
| PLPP6 | SNV | Missense_Mutation | c.584N>G | p.Asn195Ser | p.N195S | Q8IY26 | protein_coding | tolerated(0.1) | probably_damaging(0.926) | TCGA-AP-A0LM-01 | Endometrium | uterine corpus endometrioid carcinoma | Female | <65 | III/IV | Chemotherapy | cisplatin | SD | |
| PLPP6 | SNV | Missense_Mutation | novel | c.394C>T | p.Pro132Ser | p.P132S | Q8IY26 | protein_coding | tolerated(0.43) | possibly_damaging(0.469) | TCGA-AX-A2HK-01 | Endometrium | uterine corpus endometrioid carcinoma | Female | >=65 | III/IV | Unknown | Unknown | PD |
| PLPP6 | SNV | Missense_Mutation | rs772266617 | c.865N>C | p.Phe289Leu | p.F289L | Q8IY26 | protein_coding | tolerated(0.2) | benign(0.344) | TCGA-BS-A0TA-01 | Endometrium | uterine corpus endometrioid carcinoma | Female | <65 | III/IV | Chemotherapy | taxol | PD |
| PLPP6 | SNV | Missense_Mutation | novel | c.778N>A | p.Asp260Asn | p.D260N | Q8IY26 | protein_coding | deleterious(0) | probably_damaging(0.99) | TCGA-DF-A2KV-01 | Endometrium | uterine corpus endometrioid carcinoma | Female | <65 | I/II | Unknown | Unknown | SD |
| PLPP6 | SNV | Missense_Mutation | novel | c.829T>G | p.Tyr277Asp | p.Y277D | Q8IY26 | protein_coding | tolerated(0.13) | probably_damaging(0.93) | TCGA-EO-A22R-01 | Endometrium | uterine corpus endometrioid carcinoma | Female | <65 | I/II | Unknown | Unknown | SD |
| PLPP6 | SNV | Missense_Mutation | novel | c.438N>T | p.Trp146Cys | p.W146C | Q8IY26 | protein_coding | deleterious(0) | possibly_damaging(0.733) | TCGA-2Y-A9GT-01 | Liver | liver hepatocellular carcinoma | Male | <65 | I/II | Unknown | Unknown | PD |
| Page: 1 2 |
Top |
Related drugs of malignant transformation related genes |
| Identification of chemicals and drugs interact with genes involved in malignant transfromation |
| (DGIdb 4.0) |
| Entrez ID | Symbol | Category | Interaction Types | Drug Claim Name | Drug Name | PMIDs |
| Page: 1 |

Copyright 2023-Present -The University of Texas Health Science Center at Houston |