
|
|||||
|
 | |
| |
| |
| |
| |
| |
|
Gene: PLPP5 |
Gene summary for PLPP5 |
| Gene information | Species | Human | Gene symbol | PLPP5 | Gene ID | 84513 |
| Gene name | phospholipid phosphatase 5 | |
| Gene Alias | DPPL1 | |
| Cytomap | 8p11.23 | |
| Gene Type | protein-coding | GO ID | GO:0006629 | UniProtAcc | A0A140VK38 |
Top |
Malignant transformation analysis |
| Identification of the aberrant gene expression in precancerous and cancerous lesions by comparing the gene expression of stem-like cells in diseased tissues with normal stem cells |
| Entrez ID | Symbol | Replicates | Species | Organ | Tissue | Adj P-value | Log2FC | Malignancy |
| 84513 | PLPP5 | GSM4909281 | Human | Breast | IDC | 4.97e-10 | 3.26e-01 | 0.21 |
| 84513 | PLPP5 | GSM4909297 | Human | Breast | IDC | 2.83e-25 | 7.80e-01 | 0.1517 |
| 84513 | PLPP5 | GSM4909298 | Human | Breast | IDC | 2.28e-33 | 6.30e-01 | 0.1551 |
| 84513 | PLPP5 | GSM4909304 | Human | Breast | IDC | 4.38e-13 | 4.17e-01 | 0.1636 |
| 84513 | PLPP5 | GSM4909308 | Human | Breast | IDC | 9.16e-14 | 4.67e-01 | 0.158 |
| 84513 | PLPP5 | GSM4909311 | Human | Breast | IDC | 8.89e-04 | -1.38e-01 | 0.1534 |
| 84513 | PLPP5 | GSM4909317 | Human | Breast | IDC | 8.26e-21 | 6.57e-01 | 0.1355 |
| 84513 | PLPP5 | GSM4909319 | Human | Breast | IDC | 6.58e-09 | 1.53e-03 | 0.1563 |
| 84513 | PLPP5 | brca2 | Human | Breast | Precancer | 1.75e-06 | 2.31e-01 | -0.024 |
| 84513 | PLPP5 | M1 | Human | Breast | IDC | 6.18e-07 | 4.62e-01 | 0.1577 |
| 84513 | PLPP5 | NCCBC2 | Human | Breast | DCIS | 9.47e-06 | 5.20e-01 | 0.1554 |
| 84513 | PLPP5 | NCCBC5 | Human | Breast | DCIS | 1.44e-03 | -8.78e-02 | 0.2046 |
| 84513 | PLPP5 | P1 | Human | Breast | IDC | 2.87e-05 | 7.69e-03 | 0.1527 |
| 84513 | PLPP5 | P2 | Human | Breast | IDC | 9.09e-12 | 6.46e-01 | 0.21 |
| 84513 | PLPP5 | DCIS2 | Human | Breast | DCIS | 1.32e-59 | 1.99e-01 | 0.0085 |
| 84513 | PLPP5 | LZE2T | Human | Esophagus | ESCC | 2.75e-06 | 5.02e-01 | 0.082 |
| 84513 | PLPP5 | LZE4T | Human | Esophagus | ESCC | 2.91e-11 | 3.08e-01 | 0.0811 |
| 84513 | PLPP5 | LZE7T | Human | Esophagus | ESCC | 1.08e-06 | 4.28e-01 | 0.0667 |
| 84513 | PLPP5 | LZE8T | Human | Esophagus | ESCC | 1.04e-08 | 2.94e-01 | 0.067 |
| 84513 | PLPP5 | LZE22D1 | Human | Esophagus | HGIN | 1.81e-02 | 1.24e-01 | 0.0595 |
| Page: 1 2 3 4 5 6 7 8 |
| Tissue | Expression Dynamics | Abbreviation |
| Breast |  | IDC: Invasive ductal carcinoma |
| DCIS: Ductal carcinoma in situ | ||
| Precancer(BRCA1-mut): Precancerous lesion from BRCA1 mutation carriers | ||
| Esophagus | 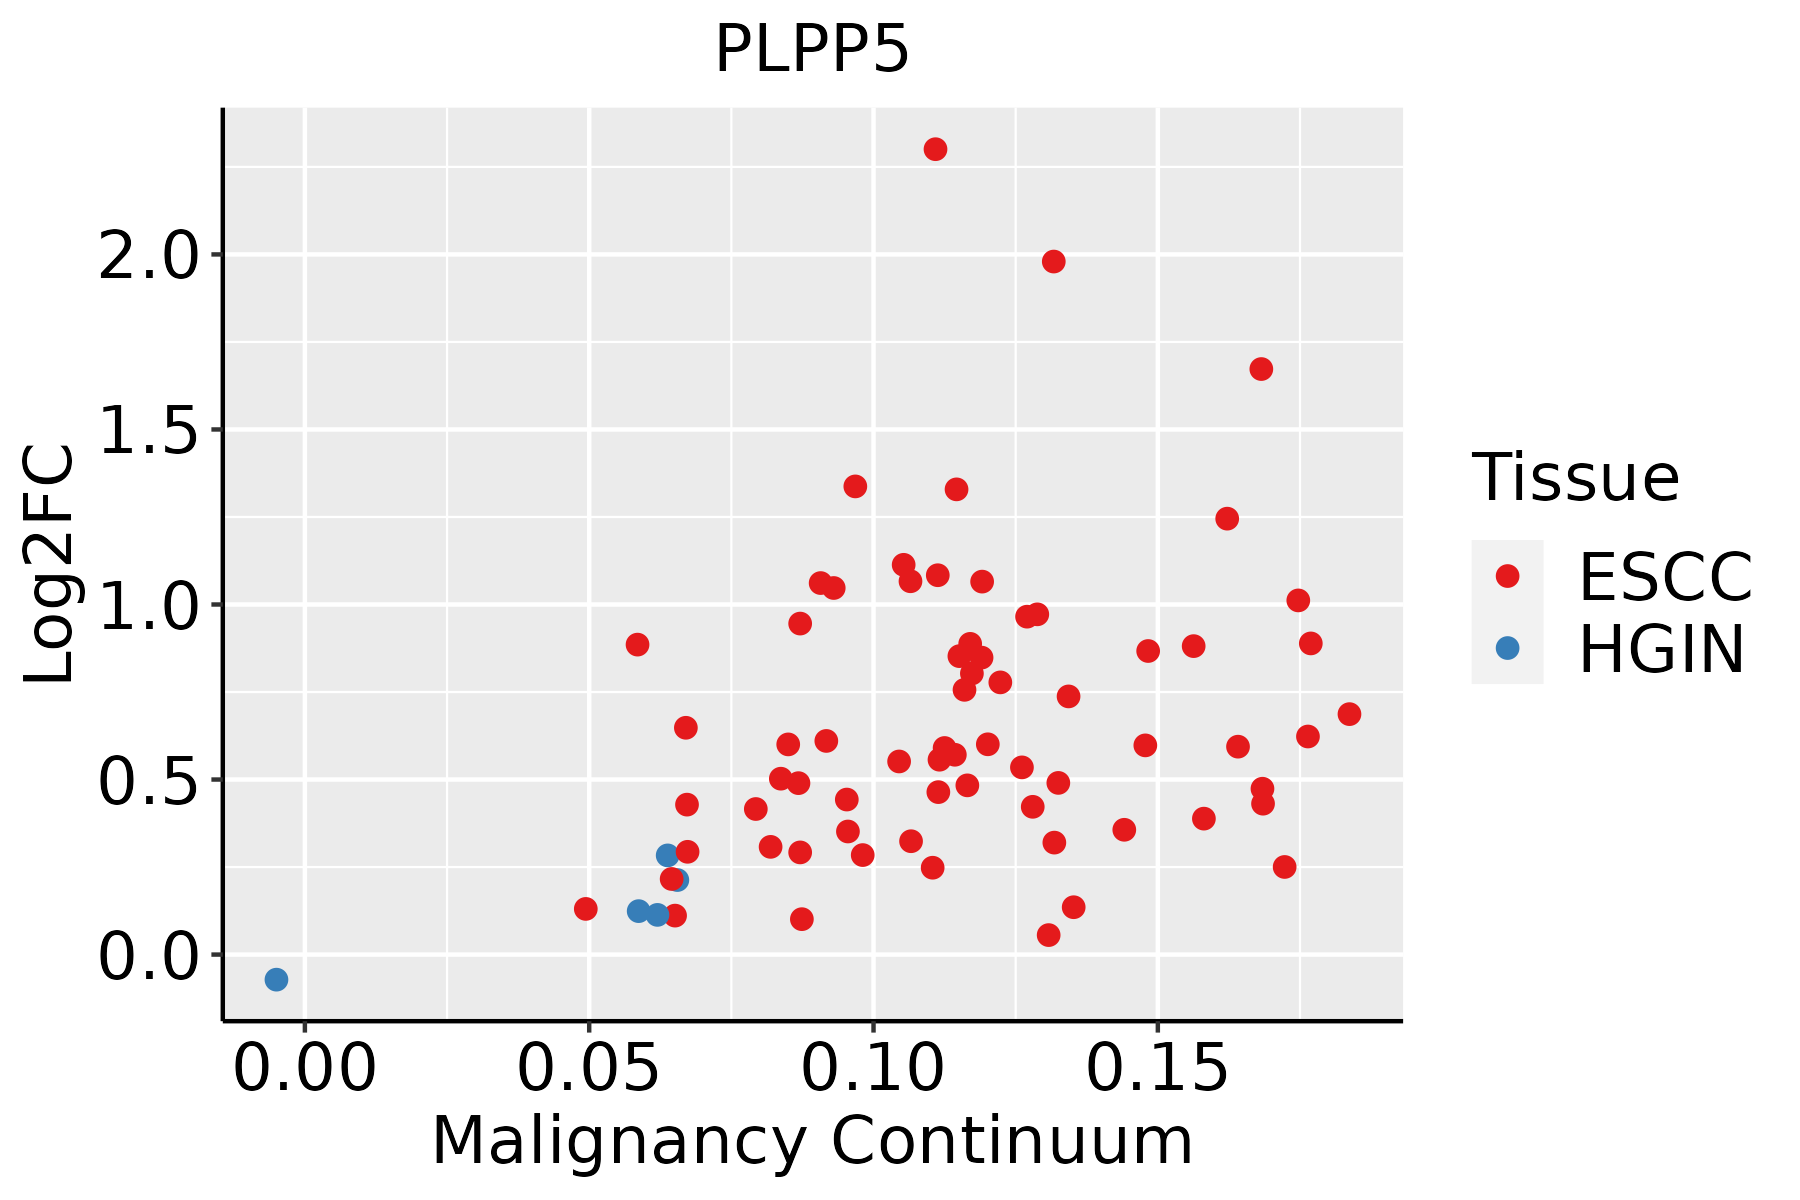 | ESCC: Esophageal squamous cell carcinoma |
| HGIN: High-grade intraepithelial neoplasias | ||
| LGIN: Low-grade intraepithelial neoplasias | ||
| Liver |  | HCC: Hepatocellular carcinoma |
| NAFLD: Non-alcoholic fatty liver disease | ||
| Oral Cavity |  | EOLP: Erosive Oral lichen planus |
| LP: leukoplakia | ||
| NEOLP: Non-erosive oral lichen planus | ||
| OSCC: Oral squamous cell carcinoma | ||
| Prostate | 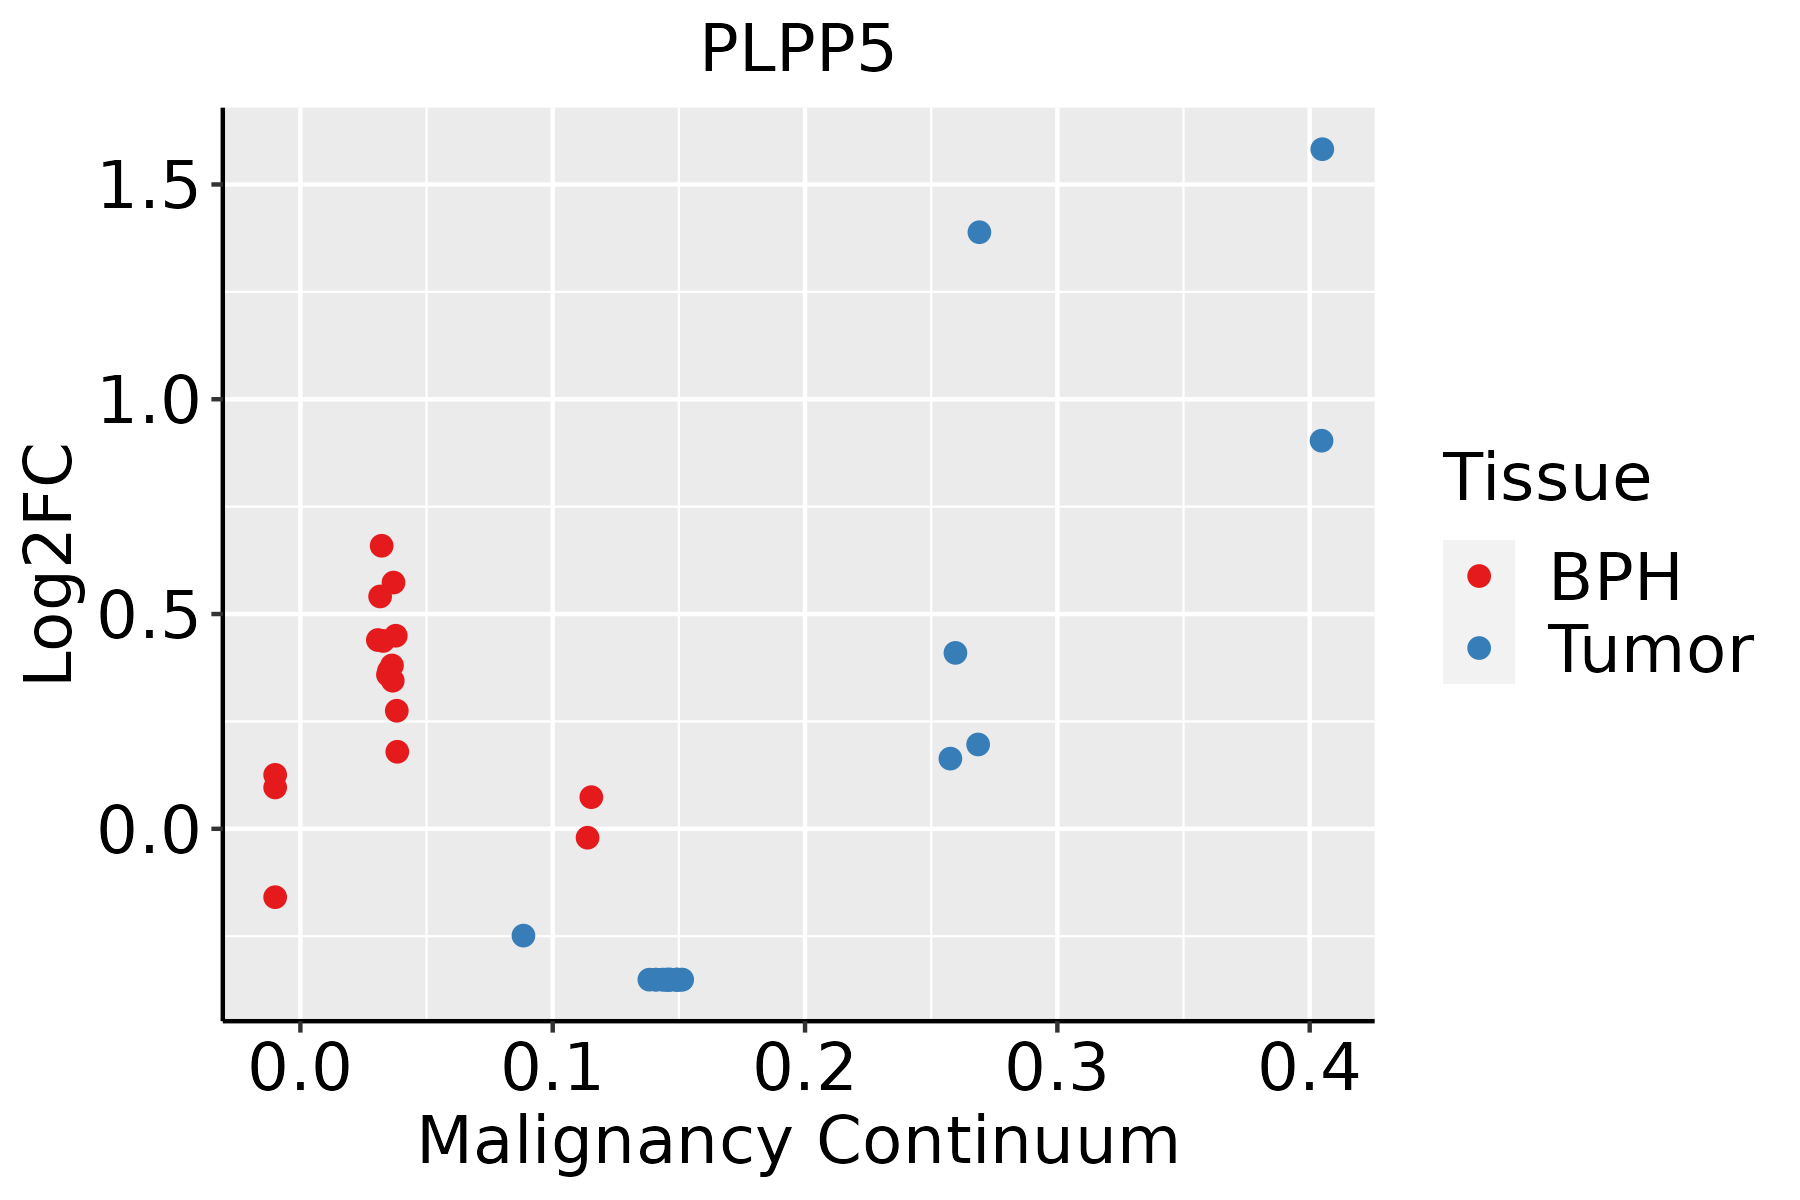 | BPH: Benign Prostatic Hyperplasia |
| Thyroid | 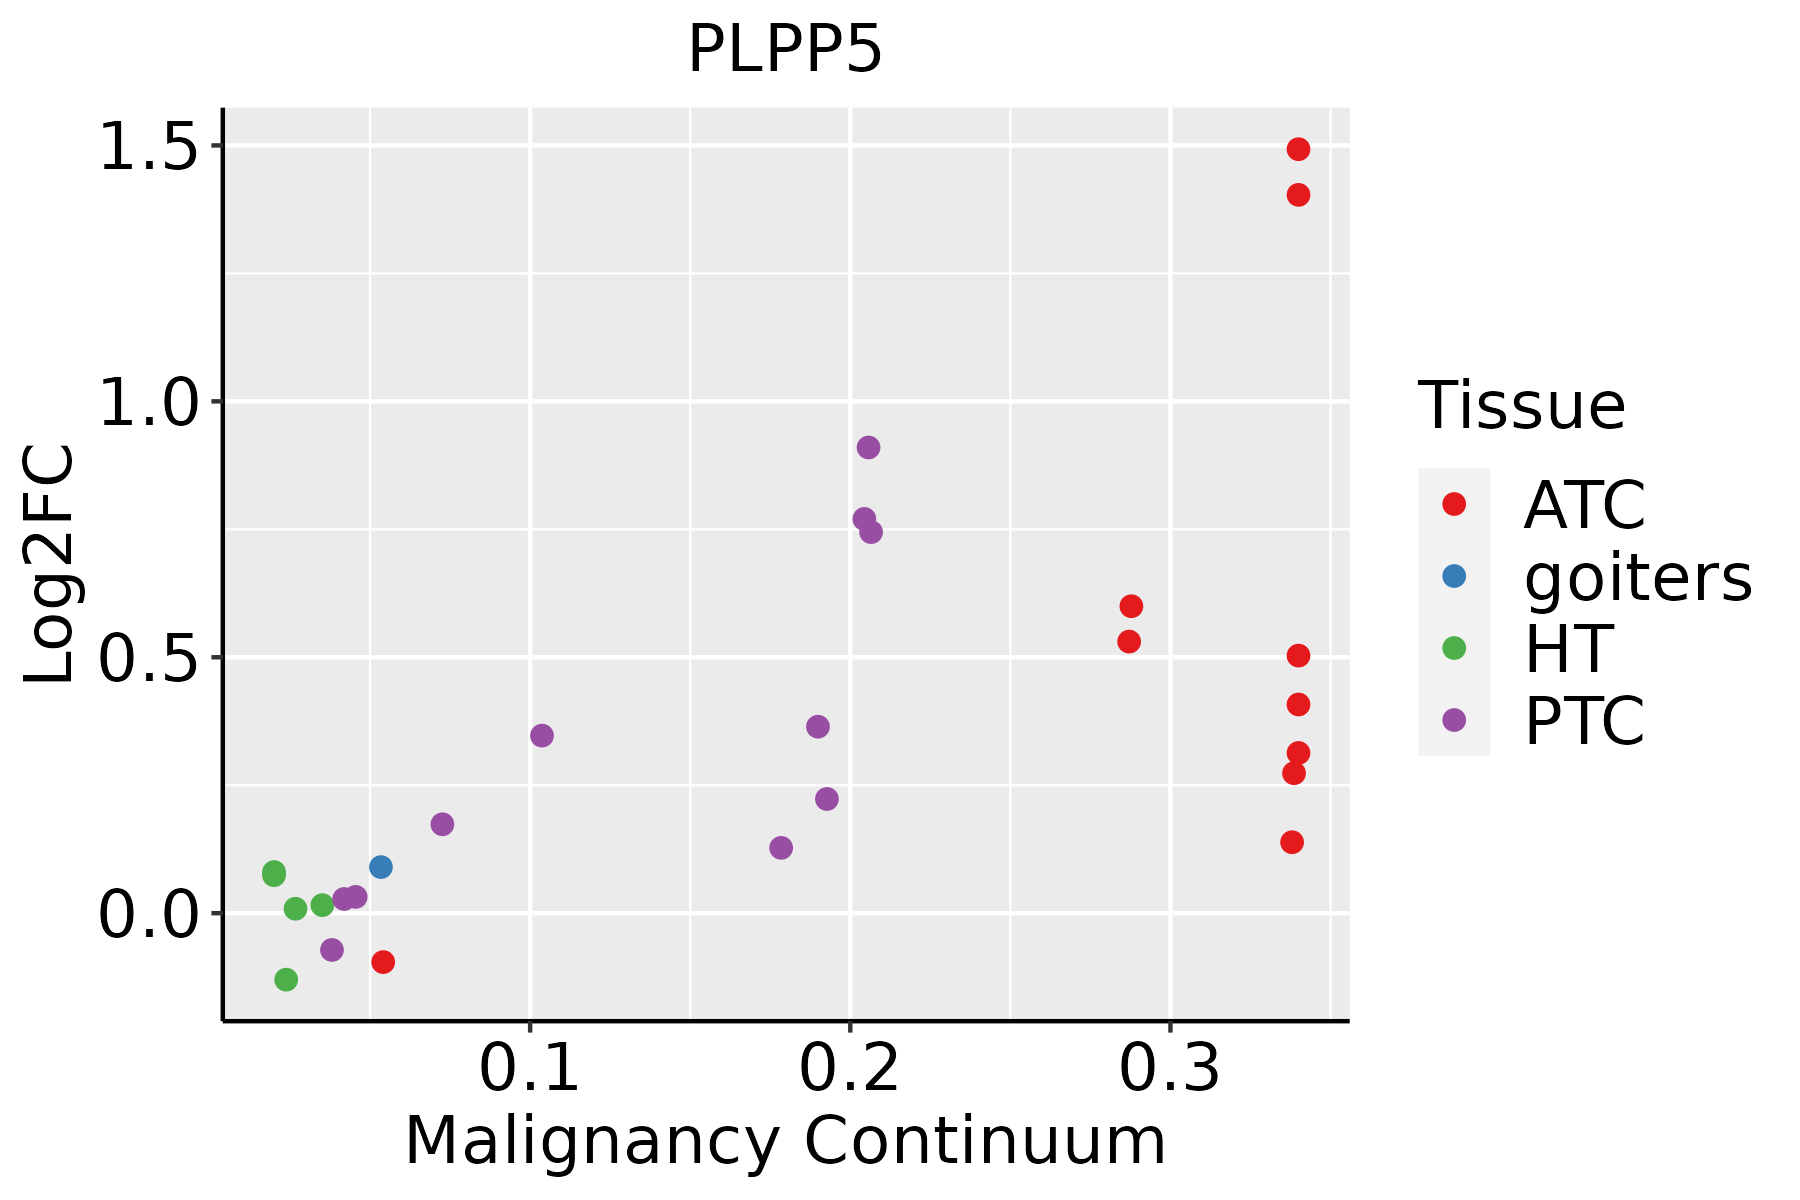 | ATC: Anaplastic thyroid cancer |
| HT: Hashimoto's thyroiditis | ||
| PTC: Papillary thyroid cancer |
| ∗log2FC in expression of this searched gene in stem-like cells from each diseased tissue sample relative to stem-like cells in normal samples in each tissue plotted against the malignancy continuum. Samples are colored based on if they are from different disease stage. |
Top |
Malignant transformation related pathway analysis |
| Find out the enriched GO biological processes and KEGG pathways involved in transition from healthy to precancer to cancer |
| Tissue | Disease Stage | Enriched GO biological Processes |
| Colorectum | AD |  |
| Colorectum | SER |  |
| Colorectum | MSS |  |
| Colorectum | MSI-H |  |
| Colorectum | FAP |  |
| ∗Top 15 enriched GO BP terms are showed in the bar plot of each disease state in each tissue. Each row represents a significant GO biological process which is colored according to the -log10(p.adjust). |
| Page: 1 2 3 4 5 6 7 8 9 |
| GO ID | Tissue | Disease Stage | Description | Gene Ratio | Bg Ratio | pvalue | p.adjust | Count |
| GO:001631110 | Esophagus | ESCC | dephosphorylation | 251/8552 | 417/18723 | 1.26e-09 | 2.99e-08 | 251 |
| GO:00066446 | Esophagus | ESCC | phospholipid metabolic process | 218/8552 | 383/18723 | 5.37e-06 | 5.59e-05 | 218 |
| GO:00302586 | Esophagus | ESCC | lipid modification | 116/8552 | 212/18723 | 4.90e-03 | 1.89e-02 | 116 |
| GO:003025811 | Liver | Cirrhotic | lipid modification | 75/4634 | 212/18723 | 3.33e-04 | 2.87e-03 | 75 |
| GO:001631111 | Liver | Cirrhotic | dephosphorylation | 130/4634 | 417/18723 | 1.58e-03 | 1.03e-02 | 130 |
| GO:00066444 | Liver | HCC | phospholipid metabolic process | 214/7958 | 383/18723 | 7.25e-08 | 1.48e-06 | 214 |
| GO:001631121 | Liver | HCC | dephosphorylation | 230/7958 | 417/18723 | 1.00e-07 | 1.96e-06 | 230 |
| GO:003025821 | Liver | HCC | lipid modification | 123/7958 | 212/18723 | 3.50e-06 | 4.58e-05 | 123 |
| GO:00163119 | Oral cavity | OSCC | dephosphorylation | 220/7305 | 417/18723 | 6.33e-09 | 1.34e-07 | 220 |
| GO:00066445 | Oral cavity | OSCC | phospholipid metabolic process | 175/7305 | 383/18723 | 4.21e-03 | 1.71e-02 | 175 |
| GO:00163118 | Prostate | BPH | dephosphorylation | 98/3107 | 417/18723 | 1.53e-04 | 1.35e-03 | 98 |
| GO:001631113 | Prostate | Tumor | dephosphorylation | 98/3246 | 417/18723 | 7.31e-04 | 5.08e-03 | 98 |
| GO:001631116 | Thyroid | PTC | dephosphorylation | 174/5968 | 417/18723 | 1.20e-05 | 1.31e-04 | 174 |
| GO:001631117 | Thyroid | ATC | dephosphorylation | 179/6293 | 417/18723 | 3.88e-05 | 3.15e-04 | 179 |
| Page: 1 |
| Pathway ID | Tissue | Disease Stage | Description | Gene Ratio | Bg Ratio | pvalue | p.adjust | qvalue | Count |
| hsa005615 | Liver | HCC | Glycerolipid metabolism | 41/4020 | 63/8465 | 3.59e-03 | 1.12e-02 | 6.22e-03 | 41 |
| hsa0056112 | Liver | HCC | Glycerolipid metabolism | 41/4020 | 63/8465 | 3.59e-03 | 1.12e-02 | 6.22e-03 | 41 |
| Page: 1 |
Top |
Cell-cell communication analysis |
| Identification of potential cell-cell interactions between two cell types and their ligand-receptor pairs for different disease states |
| Ligand | Receptor | LRpair | Pathway | Tissue | Disease Stage |
| Page: 1 |
Top |
Single-cell gene regulatory network inference analysis |
| Find out the significant the regulons (TFs) and the target genes of each regulon across cell types for different disease states |
| TF | Cell Type | Tissue | Disease Stage | Target Gene | RSS | Regulon Activity |
| ∗The dot plots of a searched regulon are shown for all cell subpopulations in each disease state of each tissue based on the regulon specific score inferred using pySCENIC and by calculating the average expression. |
| Page: 1 |
Top |
Somatic mutation of malignant transformation related genes |
| Annotation of somatic variants for genes involved in malignant transformation |
| Hugo Symbol | Variant Class | Variant Classification | dbSNP RS | HGVSc | HGVSp | HGVSp Short | SWISSPROT | BIOTYPE | SIFT | PolyPhen | Tumor Sample Barcode | Tissue | Histology | Sex | Age | Stage | Therapy Types | Drugs | Outcome |
| PLPP5 | SNV | Missense_Mutation | novel | c.160T>G | p.Tyr54Asp | p.Y54D | Q8NEB5 | protein_coding | tolerated(0.08) | benign(0.284) | TCGA-BH-A0DI-01 | Breast | breast invasive carcinoma | Female | <65 | I/II | Chemotherapy | adriamycin | CR |
| PLPP5 | SNV | Missense_Mutation | novel | c.164N>C | p.Phe55Ser | p.F55S | Q8NEB5 | protein_coding | deleterious(0.03) | benign(0.017) | TCGA-C8-A1HO-01 | Breast | breast invasive carcinoma | Female | <65 | III/IV | Chemotherapy | 5-fluorouracil | CR |
| PLPP5 | insertion | In_Frame_Ins | novel | c.398_399insCACTGGCAAGGTAAG | p.Met133delinsIleThrGlyLysValArg | p.M133delinsITGKVR | Q8NEB5 | protein_coding | TCGA-AO-A03R-01 | Breast | breast invasive carcinoma | Female | <65 | I/II | Chemotherapy | doxorubicin | SD | ||
| PLPP5 | SNV | Missense_Mutation | rs865872661 | c.196N>A | p.Leu66Ile | p.L66I | Q8NEB5 | protein_coding | tolerated(0.17) | benign(0.027) | TCGA-2W-A8YY-01 | Cervix | cervical & endocervical cancer | Female | <65 | I/II | Chemotherapy | cisplatin | CR |
| PLPP5 | SNV | Missense_Mutation | c.427N>A | p.Glu143Lys | p.E143K | Q8NEB5 | protein_coding | deleterious(0) | probably_damaging(0.985) | TCGA-A6-6648-01 | Colorectum | colon adenocarcinoma | Male | <65 | I/II | Chemotherapy | oxaliplatin | PD | |
| PLPP5 | SNV | Missense_Mutation | rs773079258 | c.343C>T | p.Arg115Cys | p.R115C | Q8NEB5 | protein_coding | deleterious(0) | probably_damaging(1) | TCGA-AA-3877-01 | Colorectum | colon adenocarcinoma | Female | >=65 | I/II | Unknown | Unknown | SD |
| PLPP5 | SNV | Missense_Mutation | c.231N>G | p.Phe77Leu | p.F77L | Q8NEB5 | protein_coding | tolerated(0.56) | benign(0.001) | TCGA-CA-6718-01 | Colorectum | colon adenocarcinoma | Male | <65 | I/II | Unknown | Unknown | PD | |
| PLPP5 | deletion | Frame_Shift_Del | novel | c.418delN | p.Val140TrpfsTer2 | p.V140Wfs*2 | Q8NEB5 | protein_coding | TCGA-AU-6004-01 | Colorectum | colon adenocarcinoma | Female | >=65 | I/II | Unknown | Unknown | SD | ||
| PLPP5 | SNV | Missense_Mutation | rs761573701 | c.590N>C | p.Val197Ala | p.V197A | Q8NEB5 | protein_coding | tolerated(0.1) | benign(0.01) | TCGA-AP-A059-01 | Endometrium | uterine corpus endometrioid carcinoma | Female | >=65 | I/II | Unknown | Unknown | SD |
| PLPP5 | SNV | Missense_Mutation | rs757419576 | c.76N>T | p.Val26Leu | p.V26L | Q8NEB5 | protein_coding | tolerated(0.58) | benign(0.006) | TCGA-AX-A2H2-01 | Endometrium | uterine corpus endometrioid carcinoma | Female | >=65 | I/II | Unknown | Unknown | SD |
| Page: 1 2 |
Top |
Related drugs of malignant transformation related genes |
| Identification of chemicals and drugs interact with genes involved in malignant transfromation |
| (DGIdb 4.0) |
| Entrez ID | Symbol | Category | Interaction Types | Drug Claim Name | Drug Name | PMIDs |
| Page: 1 |

Copyright 2023-Present -The University of Texas Health Science Center at Houston |