
|
|||||
|
 | |
| |
| |
| |
| |
| |
|
Gene: PLPP3 |
Gene summary for PLPP3 |
| Gene information | Species | Human | Gene symbol | PLPP3 | Gene ID | 8613 |
| Gene name | phospholipid phosphatase 3 | |
| Gene Alias | Dri42 | |
| Cytomap | 1p32.2 | |
| Gene Type | protein-coding | GO ID | GO:0001667 | UniProtAcc | O14495 |
Top |
Malignant transformation analysis |
| Identification of the aberrant gene expression in precancerous and cancerous lesions by comparing the gene expression of stem-like cells in diseased tissues with normal stem cells |
| Entrez ID | Symbol | Replicates | Species | Organ | Tissue | Adj P-value | Log2FC | Malignancy |
| 8613 | PLPP3 | HTA11_3410_2000001011 | Human | Colorectum | AD | 2.58e-09 | 2.93e-01 | 0.0155 |
| 8613 | PLPP3 | HTA11_2487_2000001011 | Human | Colorectum | SER | 1.94e-09 | 5.45e-01 | -0.1808 |
| 8613 | PLPP3 | HTA11_2951_2000001011 | Human | Colorectum | AD | 1.81e-16 | 1.20e+00 | 0.0216 |
| 8613 | PLPP3 | HTA11_1938_2000001011 | Human | Colorectum | AD | 9.03e-14 | 9.68e-01 | -0.0811 |
| 8613 | PLPP3 | HTA11_78_2000001011 | Human | Colorectum | AD | 6.15e-03 | 3.51e-01 | -0.1088 |
| 8613 | PLPP3 | HTA11_347_2000001011 | Human | Colorectum | AD | 3.49e-23 | 6.48e-01 | -0.1954 |
| 8613 | PLPP3 | HTA11_411_2000001011 | Human | Colorectum | SER | 9.12e-07 | 8.78e-01 | -0.2602 |
| 8613 | PLPP3 | HTA11_2112_2000001011 | Human | Colorectum | SER | 2.85e-02 | 9.88e-01 | -0.2196 |
| 8613 | PLPP3 | HTA11_3361_2000001011 | Human | Colorectum | AD | 4.39e-19 | 7.72e-01 | -0.1207 |
| 8613 | PLPP3 | HTA11_83_2000001011 | Human | Colorectum | SER | 7.25e-12 | 7.30e-01 | -0.1526 |
| 8613 | PLPP3 | HTA11_696_2000001011 | Human | Colorectum | AD | 3.23e-45 | 1.13e+00 | -0.1464 |
| 8613 | PLPP3 | HTA11_866_2000001011 | Human | Colorectum | AD | 1.57e-30 | 8.71e-01 | -0.1001 |
| 8613 | PLPP3 | HTA11_1391_2000001011 | Human | Colorectum | AD | 1.16e-37 | 1.38e+00 | -0.059 |
| 8613 | PLPP3 | HTA11_2992_2000001011 | Human | Colorectum | SER | 1.04e-04 | 6.27e-01 | -0.1706 |
| 8613 | PLPP3 | HTA11_5212_2000001011 | Human | Colorectum | AD | 2.83e-02 | 4.63e-01 | -0.2061 |
| 8613 | PLPP3 | HTA11_5216_2000001011 | Human | Colorectum | SER | 3.41e-07 | 7.15e-01 | -0.1462 |
| 8613 | PLPP3 | HTA11_546_2000001011 | Human | Colorectum | AD | 4.89e-10 | 7.67e-01 | -0.0842 |
| 8613 | PLPP3 | HTA11_9341_2000001011 | Human | Colorectum | SER | 2.81e-09 | 1.03e+00 | -0.00410000000000005 |
| 8613 | PLPP3 | HTA11_7862_2000001011 | Human | Colorectum | AD | 9.15e-06 | 4.77e-01 | -0.0179 |
| 8613 | PLPP3 | HTA11_866_3004761011 | Human | Colorectum | AD | 1.82e-71 | 1.64e+00 | 0.096 |
| Page: 1 2 3 4 5 6 7 8 |
| Tissue | Expression Dynamics | Abbreviation |
| Colorectum (GSE201348) |  | FAP: Familial adenomatous polyposis |
| CRC: Colorectal cancer | ||
| Colorectum (HTA11) |  | AD: Adenomas |
| SER: Sessile serrated lesions | ||
| MSI-H: Microsatellite-high colorectal cancer | ||
| MSS: Microsatellite stable colorectal cancer | ||
| Esophagus |  | ESCC: Esophageal squamous cell carcinoma |
| HGIN: High-grade intraepithelial neoplasias | ||
| LGIN: Low-grade intraepithelial neoplasias | ||
| Liver | 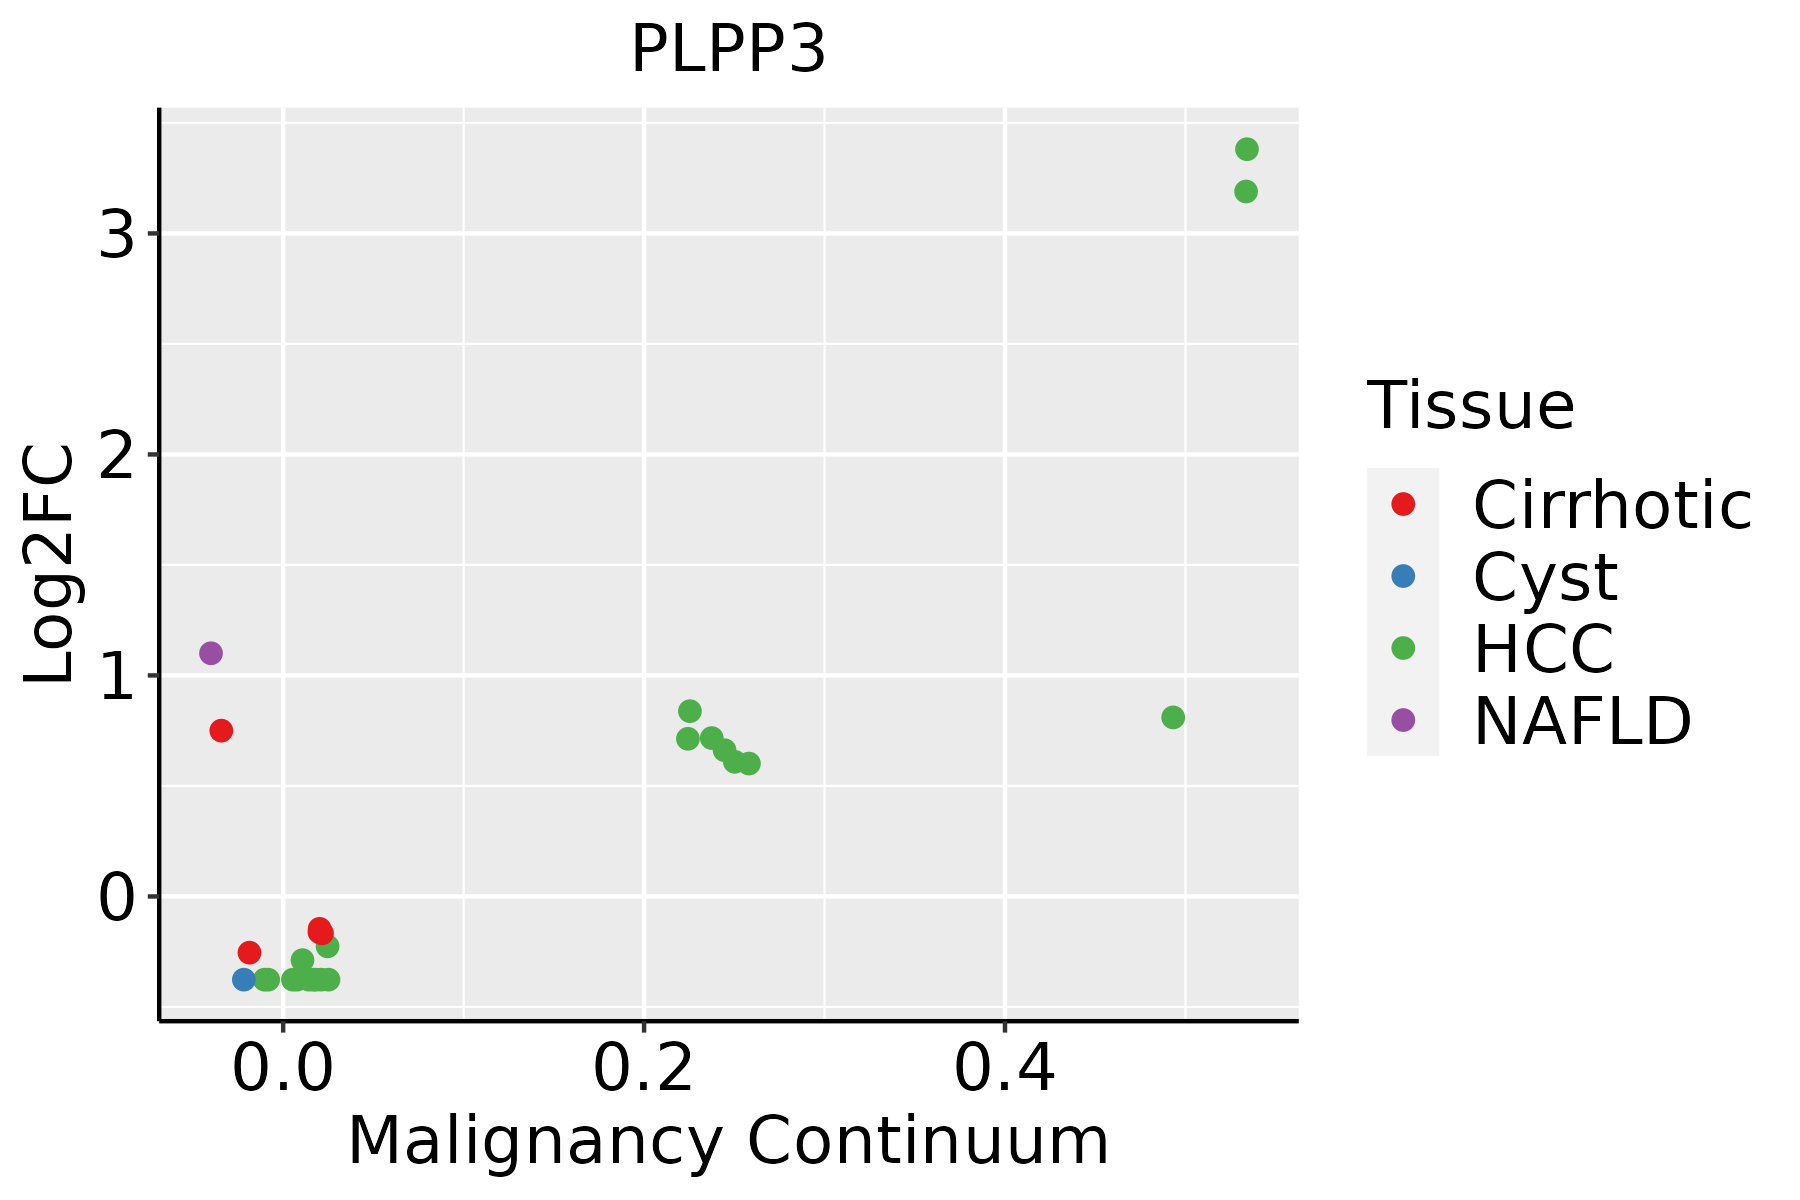 | HCC: Hepatocellular carcinoma |
| NAFLD: Non-alcoholic fatty liver disease | ||
| Oral Cavity |  | EOLP: Erosive Oral lichen planus |
| LP: leukoplakia | ||
| NEOLP: Non-erosive oral lichen planus | ||
| OSCC: Oral squamous cell carcinoma | ||
| Skin | 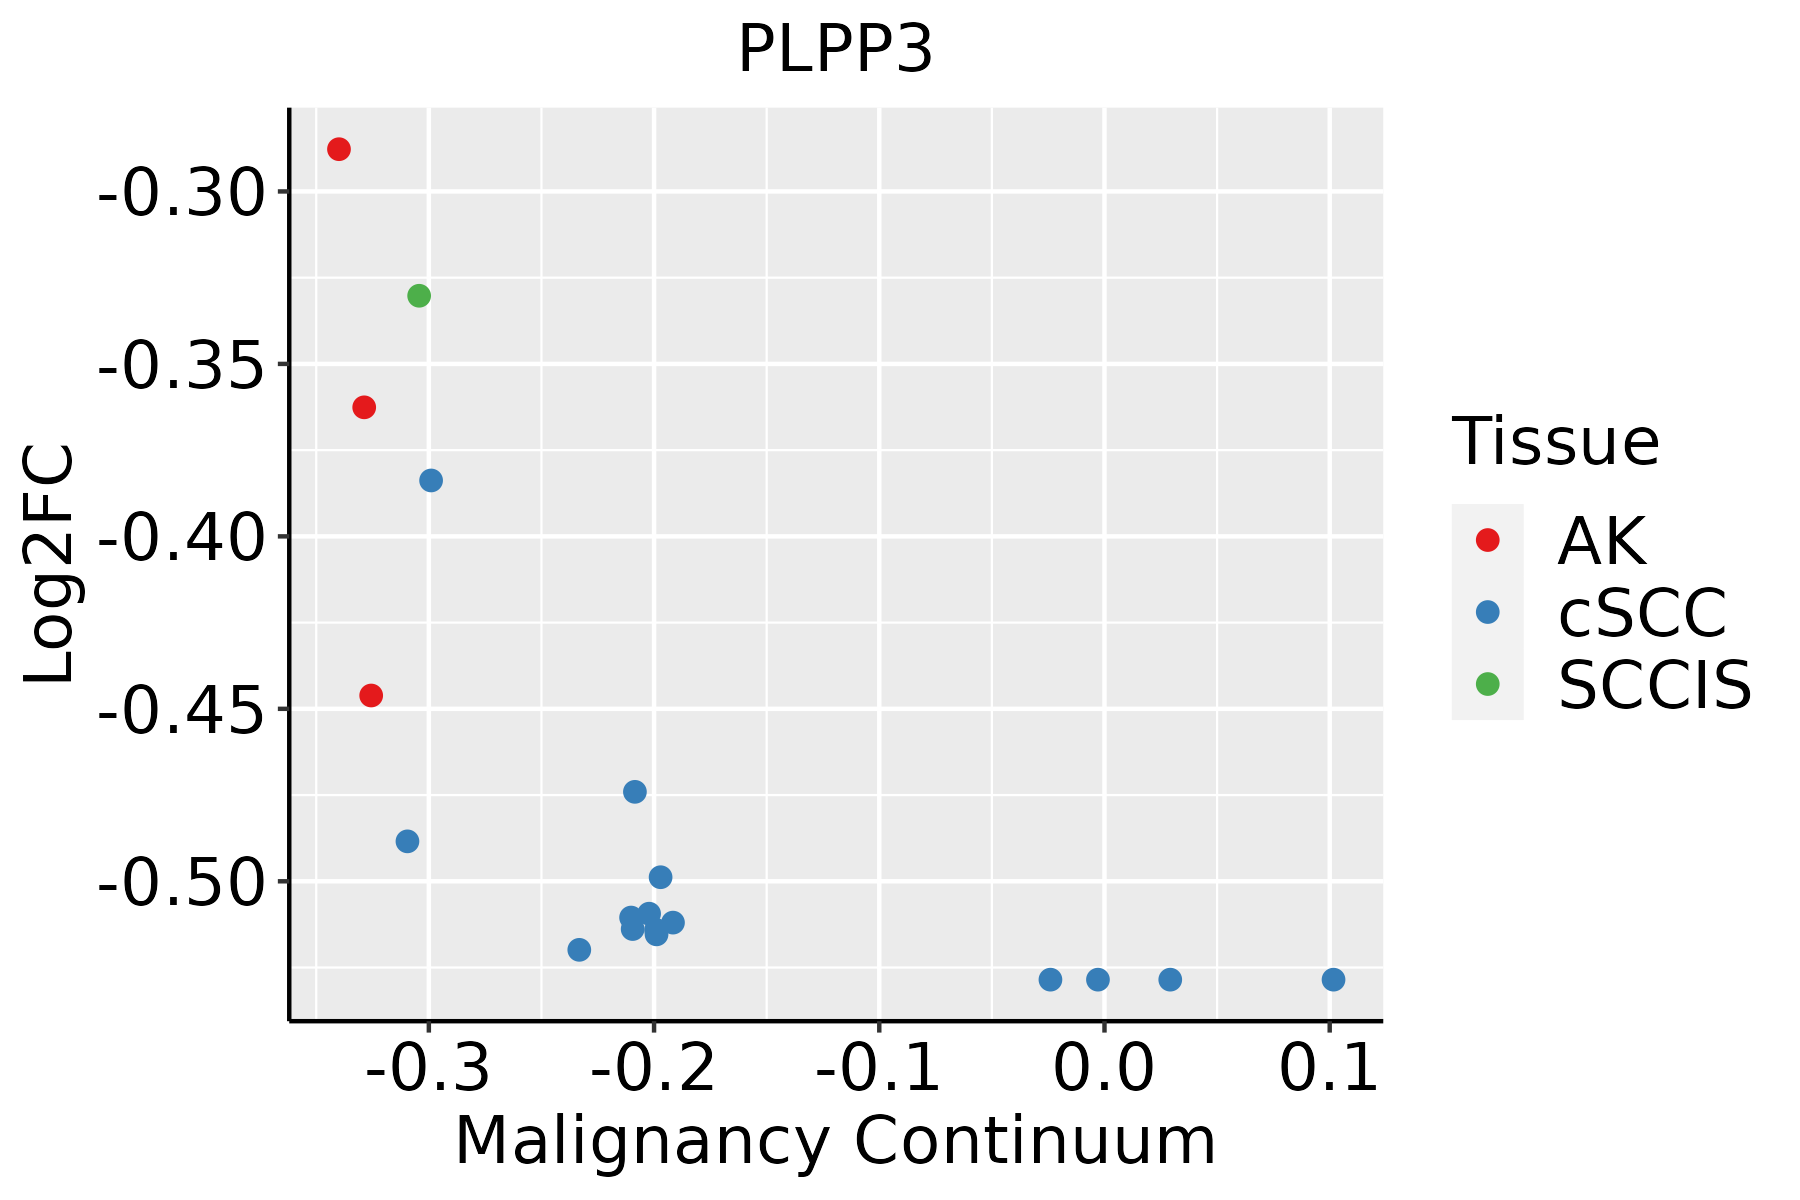 | AK: Actinic keratosis |
| cSCC: Cutaneous squamous cell carcinoma | ||
| SCCIS:squamous cell carcinoma in situ | ||
| Thyroid |  | ATC: Anaplastic thyroid cancer |
| HT: Hashimoto's thyroiditis | ||
| PTC: Papillary thyroid cancer |
| ∗log2FC in expression of this searched gene in stem-like cells from each diseased tissue sample relative to stem-like cells in normal samples in each tissue plotted against the malignancy continuum. Samples are colored based on if they are from different disease stage. |
Top |
Malignant transformation related pathway analysis |
| Find out the enriched GO biological processes and KEGG pathways involved in transition from healthy to precancer to cancer |
| Tissue | Disease Stage | Enriched GO biological Processes |
| Colorectum | AD |  |
| Colorectum | SER |  |
| Colorectum | MSS |  |
| Colorectum | MSI-H |  |
| Colorectum | FAP |  |
| ∗Top 15 enriched GO BP terms are showed in the bar plot of each disease state in each tissue. Each row represents a significant GO biological process which is colored according to the -log10(p.adjust). |
| Page: 1 2 3 4 5 6 7 8 9 |
| GO ID | Tissue | Disease Stage | Description | Gene Ratio | Bg Ratio | pvalue | p.adjust | Count |
| GO:0048193 | Colorectum | AD | Golgi vesicle transport | 109/3918 | 296/18723 | 1.80e-10 | 1.68e-08 | 109 |
| GO:0031647 | Colorectum | AD | regulation of protein stability | 108/3918 | 298/18723 | 6.33e-10 | 5.08e-08 | 108 |
| GO:0050821 | Colorectum | AD | protein stabilization | 73/3918 | 191/18723 | 3.02e-08 | 1.64e-06 | 73 |
| GO:0034109 | Colorectum | AD | homotypic cell-cell adhesion | 40/3918 | 90/18723 | 4.37e-07 | 1.67e-05 | 40 |
| GO:0006890 | Colorectum | AD | retrograde vesicle-mediated transport, Golgi to endoplasmic reticulum | 27/3918 | 52/18723 | 7.67e-07 | 2.70e-05 | 27 |
| GO:0042060 | Colorectum | AD | wound healing | 128/3918 | 422/18723 | 2.73e-06 | 7.89e-05 | 128 |
| GO:0030111 | Colorectum | AD | regulation of Wnt signaling pathway | 102/3918 | 328/18723 | 8.51e-06 | 2.03e-04 | 102 |
| GO:0010563 | Colorectum | AD | negative regulation of phosphorus metabolic process | 130/3918 | 442/18723 | 1.26e-05 | 2.76e-04 | 130 |
| GO:0016055 | Colorectum | AD | Wnt signaling pathway | 130/3918 | 444/18723 | 1.60e-05 | 3.37e-04 | 130 |
| GO:0045936 | Colorectum | AD | negative regulation of phosphate metabolic process | 129/3918 | 441/18723 | 1.81e-05 | 3.76e-04 | 129 |
| GO:0016311 | Colorectum | AD | dephosphorylation | 123/3918 | 417/18723 | 1.84e-05 | 3.82e-04 | 123 |
| GO:0198738 | Colorectum | AD | cell-cell signaling by wnt | 130/3918 | 446/18723 | 2.02e-05 | 4.10e-04 | 130 |
| GO:0001667 | Colorectum | AD | ameboidal-type cell migration | 137/3918 | 475/18723 | 2.17e-05 | 4.33e-04 | 137 |
| GO:0006066 | Colorectum | AD | alcohol metabolic process | 106/3918 | 353/18723 | 3.02e-05 | 5.57e-04 | 106 |
| GO:0042326 | Colorectum | AD | negative regulation of phosphorylation | 112/3918 | 385/18723 | 8.02e-05 | 1.27e-03 | 112 |
| GO:0001933 | Colorectum | AD | negative regulation of protein phosphorylation | 101/3918 | 342/18723 | 9.39e-05 | 1.42e-03 | 101 |
| GO:0090132 | Colorectum | AD | epithelium migration | 105/3918 | 360/18723 | 1.18e-04 | 1.73e-03 | 105 |
| GO:0010632 | Colorectum | AD | regulation of epithelial cell migration | 88/3918 | 292/18723 | 1.19e-04 | 1.75e-03 | 88 |
| GO:0010631 | Colorectum | AD | epithelial cell migration | 104/3918 | 357/18723 | 1.33e-04 | 1.90e-03 | 104 |
| GO:0030258 | Colorectum | AD | lipid modification | 67/3918 | 212/18723 | 1.66e-04 | 2.27e-03 | 67 |
| Page: 1 2 3 4 5 6 7 8 9 10 11 12 13 14 15 16 17 18 19 20 21 22 23 24 25 |
| Pathway ID | Tissue | Disease Stage | Description | Gene Ratio | Bg Ratio | pvalue | p.adjust | qvalue | Count |
| hsa04666 | Colorectum | AD | Fc gamma R-mediated phagocytosis | 46/2092 | 97/8465 | 9.10e-07 | 1.22e-05 | 7.77e-06 | 46 |
| hsa00561 | Colorectum | AD | Glycerolipid metabolism | 24/2092 | 63/8465 | 1.25e-02 | 4.54e-02 | 2.90e-02 | 24 |
| hsa046661 | Colorectum | AD | Fc gamma R-mediated phagocytosis | 46/2092 | 97/8465 | 9.10e-07 | 1.22e-05 | 7.77e-06 | 46 |
| hsa005611 | Colorectum | AD | Glycerolipid metabolism | 24/2092 | 63/8465 | 1.25e-02 | 4.54e-02 | 2.90e-02 | 24 |
| hsa046662 | Colorectum | SER | Fc gamma R-mediated phagocytosis | 39/1580 | 97/8465 | 5.84e-07 | 9.70e-06 | 7.04e-06 | 39 |
| hsa046663 | Colorectum | SER | Fc gamma R-mediated phagocytosis | 39/1580 | 97/8465 | 5.84e-07 | 9.70e-06 | 7.04e-06 | 39 |
| hsa046664 | Colorectum | MSS | Fc gamma R-mediated phagocytosis | 45/1875 | 97/8465 | 9.30e-08 | 1.56e-06 | 9.55e-07 | 45 |
| hsa05231 | Colorectum | MSS | Choline metabolism in cancer | 34/1875 | 98/8465 | 2.90e-03 | 1.39e-02 | 8.50e-03 | 34 |
| hsa005612 | Colorectum | MSS | Glycerolipid metabolism | 23/1875 | 63/8465 | 6.55e-03 | 2.64e-02 | 1.62e-02 | 23 |
| hsa046665 | Colorectum | MSS | Fc gamma R-mediated phagocytosis | 45/1875 | 97/8465 | 9.30e-08 | 1.56e-06 | 9.55e-07 | 45 |
| hsa052311 | Colorectum | MSS | Choline metabolism in cancer | 34/1875 | 98/8465 | 2.90e-03 | 1.39e-02 | 8.50e-03 | 34 |
| hsa005613 | Colorectum | MSS | Glycerolipid metabolism | 23/1875 | 63/8465 | 6.55e-03 | 2.64e-02 | 1.62e-02 | 23 |
| hsa0466620 | Esophagus | ESCC | Fc gamma R-mediated phagocytosis | 63/4205 | 97/8465 | 1.63e-03 | 4.89e-03 | 2.50e-03 | 63 |
| hsa006003 | Esophagus | ESCC | Sphingolipid metabolism | 36/4205 | 53/8465 | 5.41e-03 | 1.36e-02 | 6.99e-03 | 36 |
| hsa052319 | Esophagus | ESCC | Choline metabolism in cancer | 61/4205 | 98/8465 | 7.97e-03 | 1.92e-02 | 9.84e-03 | 61 |
| hsa04666110 | Esophagus | ESCC | Fc gamma R-mediated phagocytosis | 63/4205 | 97/8465 | 1.63e-03 | 4.89e-03 | 2.50e-03 | 63 |
| hsa0060012 | Esophagus | ESCC | Sphingolipid metabolism | 36/4205 | 53/8465 | 5.41e-03 | 1.36e-02 | 6.99e-03 | 36 |
| hsa0523114 | Esophagus | ESCC | Choline metabolism in cancer | 61/4205 | 98/8465 | 7.97e-03 | 1.92e-02 | 9.84e-03 | 61 |
| hsa005615 | Liver | HCC | Glycerolipid metabolism | 41/4020 | 63/8465 | 3.59e-03 | 1.12e-02 | 6.22e-03 | 41 |
| hsa0466610 | Liver | HCC | Fc gamma R-mediated phagocytosis | 58/4020 | 97/8465 | 9.65e-03 | 2.52e-02 | 1.40e-02 | 58 |
| Page: 1 2 |
Top |
Cell-cell communication analysis |
| Identification of potential cell-cell interactions between two cell types and their ligand-receptor pairs for different disease states |
| Ligand | Receptor | LRpair | Pathway | Tissue | Disease Stage |
| Page: 1 |
Top |
Single-cell gene regulatory network inference analysis |
| Find out the significant the regulons (TFs) and the target genes of each regulon across cell types for different disease states |
| TF | Cell Type | Tissue | Disease Stage | Target Gene | RSS | Regulon Activity |
| ∗The dot plots of a searched regulon are shown for all cell subpopulations in each disease state of each tissue based on the regulon specific score inferred using pySCENIC and by calculating the average expression. |
| Page: 1 |
Top |
Somatic mutation of malignant transformation related genes |
| Annotation of somatic variants for genes involved in malignant transformation |
| Hugo Symbol | Variant Class | Variant Classification | dbSNP RS | HGVSc | HGVSp | HGVSp Short | SWISSPROT | BIOTYPE | SIFT | PolyPhen | Tumor Sample Barcode | Tissue | Histology | Sex | Age | Stage | Therapy Types | Drugs | Outcome |
| PLPP3 | SNV | Missense_Mutation | c.866C>G | p.Pro289Arg | p.P289R | O14495 | protein_coding | deleterious(0.02) | benign(0.007) | TCGA-A2-A25A-01 | Breast | breast invasive carcinoma | Female | <65 | I/II | Unspecific | Cytoxan | SD | |
| PLPP3 | deletion | Frame_Shift_Del | novel | c.363delC | p.Tyr122ThrfsTer30 | p.Y122Tfs*30 | O14495 | protein_coding | TCGA-D8-A27V-01 | Breast | breast invasive carcinoma | Female | <65 | I/II | Hormone Therapy | tamoxiphen | SD | ||
| PLPP3 | SNV | Missense_Mutation | c.477N>T | p.Leu159Phe | p.L159F | O14495 | protein_coding | deleterious(0.01) | probably_damaging(0.927) | TCGA-C5-A1MH-01 | Cervix | cervical & endocervical cancer | Female | >=65 | III/IV | Chemotherapy | cisplatin | PD | |
| PLPP3 | SNV | Missense_Mutation | c.324N>G | p.Ile108Met | p.I108M | O14495 | protein_coding | deleterious(0) | probably_damaging(0.921) | TCGA-JW-A5VL-01 | Cervix | cervical & endocervical cancer | Female | <65 | I/II | Unknown | Unknown | SD | |
| PLPP3 | SNV | Missense_Mutation | c.531N>C | p.Gln177His | p.Q177H | O14495 | protein_coding | tolerated(0.06) | possibly_damaging(0.796) | TCGA-JX-A3Q0-01 | Cervix | cervical & endocervical cancer | Female | <65 | III/IV | Unknown | Unknown | SD | |
| PLPP3 | SNV | Missense_Mutation | novel | c.464N>A | p.Arg155His | p.R155H | O14495 | protein_coding | deleterious(0) | probably_damaging(0.999) | TCGA-MA-AA3Z-01 | Cervix | cervical & endocervical cancer | Female | <65 | I/II | Unknown | Unknown | SD |
| PLPP3 | SNV | Missense_Mutation | novel | c.834N>G | p.Phe278Leu | p.F278L | O14495 | protein_coding | deleterious(0.01) | probably_damaging(0.951) | TCGA-VS-A8EL-01 | Cervix | cervical & endocervical cancer | Female | <65 | I/II | Chemotherapy | cisplatin | CR |
| PLPP3 | SNV | Missense_Mutation | c.187N>T | p.His63Tyr | p.H63Y | O14495 | protein_coding | deleterious(0) | benign(0.141) | TCGA-AA-A004-01 | Colorectum | colon adenocarcinoma | Male | >=65 | I/II | Unknown | Unknown | SD | |
| PLPP3 | SNV | Missense_Mutation | c.585N>A | p.Phe195Leu | p.F195L | O14495 | protein_coding | deleterious(0) | probably_damaging(0.951) | TCGA-CA-6718-01 | Colorectum | colon adenocarcinoma | Male | <65 | I/II | Unknown | Unknown | PD | |
| PLPP3 | SNV | Missense_Mutation | c.235N>G | p.Thr79Ala | p.T79A | O14495 | protein_coding | tolerated(0.37) | benign(0.003) | TCGA-CA-6718-01 | Colorectum | colon adenocarcinoma | Male | <65 | I/II | Unknown | Unknown | PD |
| Page: 1 2 3 |
Top |
Related drugs of malignant transformation related genes |
| Identification of chemicals and drugs interact with genes involved in malignant transfromation |
| (DGIdb 4.0) |
| Entrez ID | Symbol | Category | Interaction Types | Drug Claim Name | Drug Name | PMIDs |
| Page: 1 |

Copyright 2023-Present -The University of Texas Health Science Center at Houston |