| Tissue | Expression Dynamics | Abbreviation |
| Cervix | 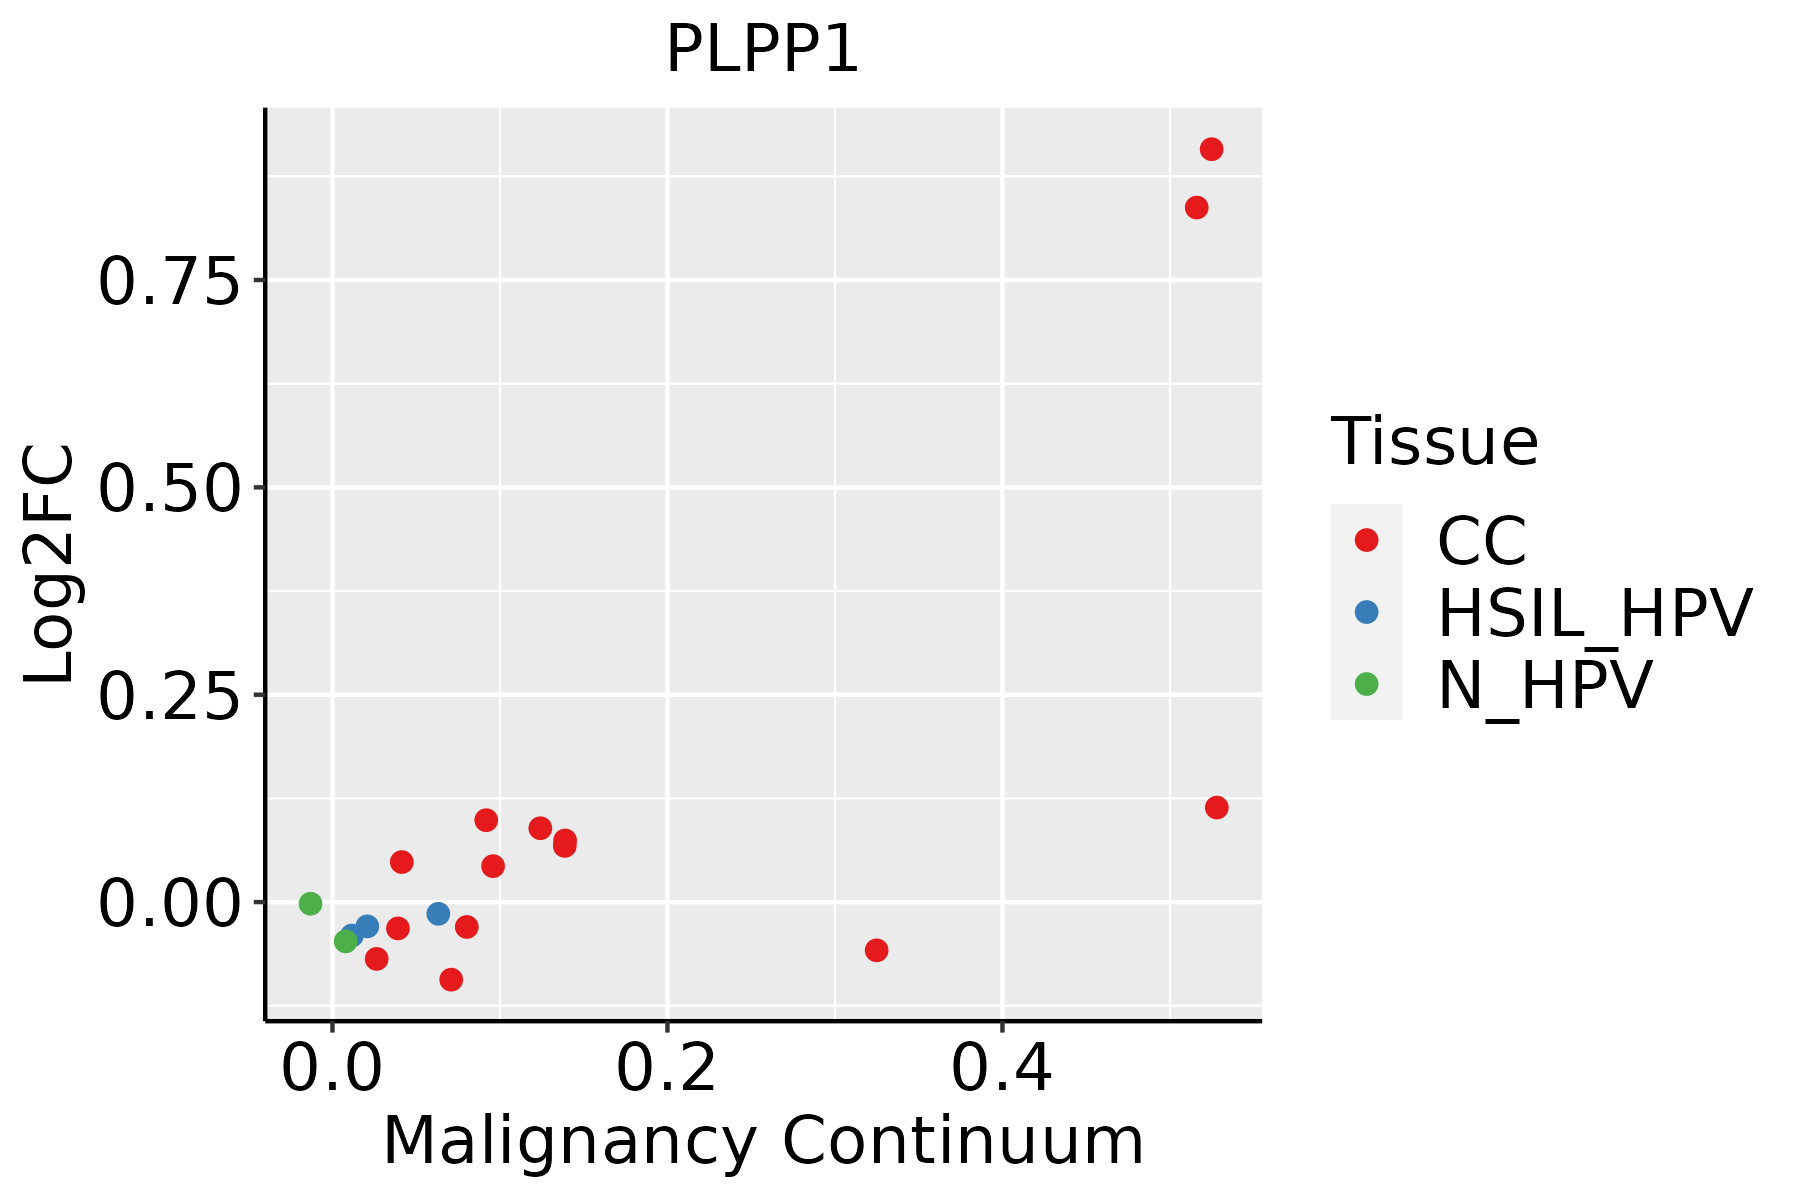 | CC: Cervix cancer |
| HSIL_HPV: HPV-infected high-grade squamous intraepithelial lesions |
| N_HPV: HPV-infected normal cervix |
| Colorectum (GSE201348) |  | FAP: Familial adenomatous polyposis |
| CRC: Colorectal cancer |
| Colorectum (HTA11) | 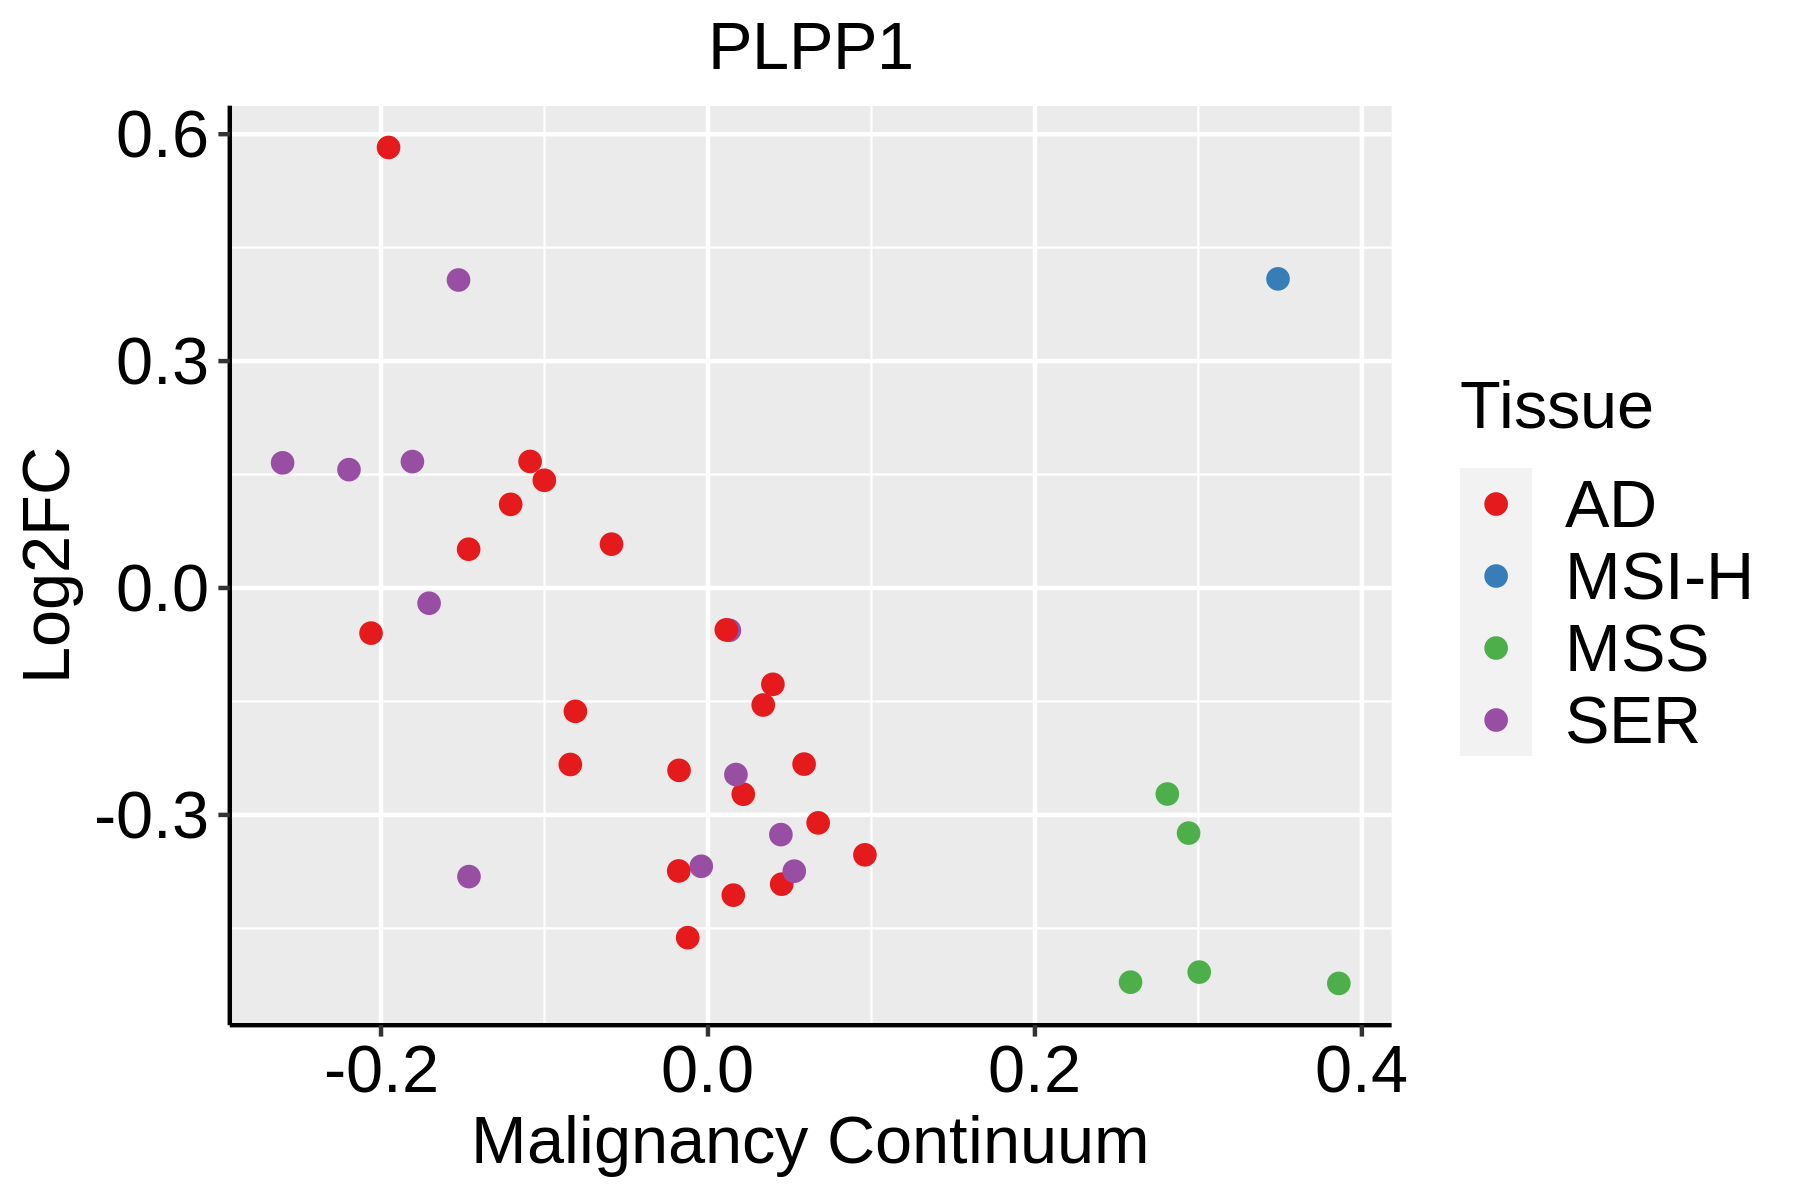 | AD: Adenomas |
| SER: Sessile serrated lesions |
| MSI-H: Microsatellite-high colorectal cancer |
| MSS: Microsatellite stable colorectal cancer |
| Endometrium | 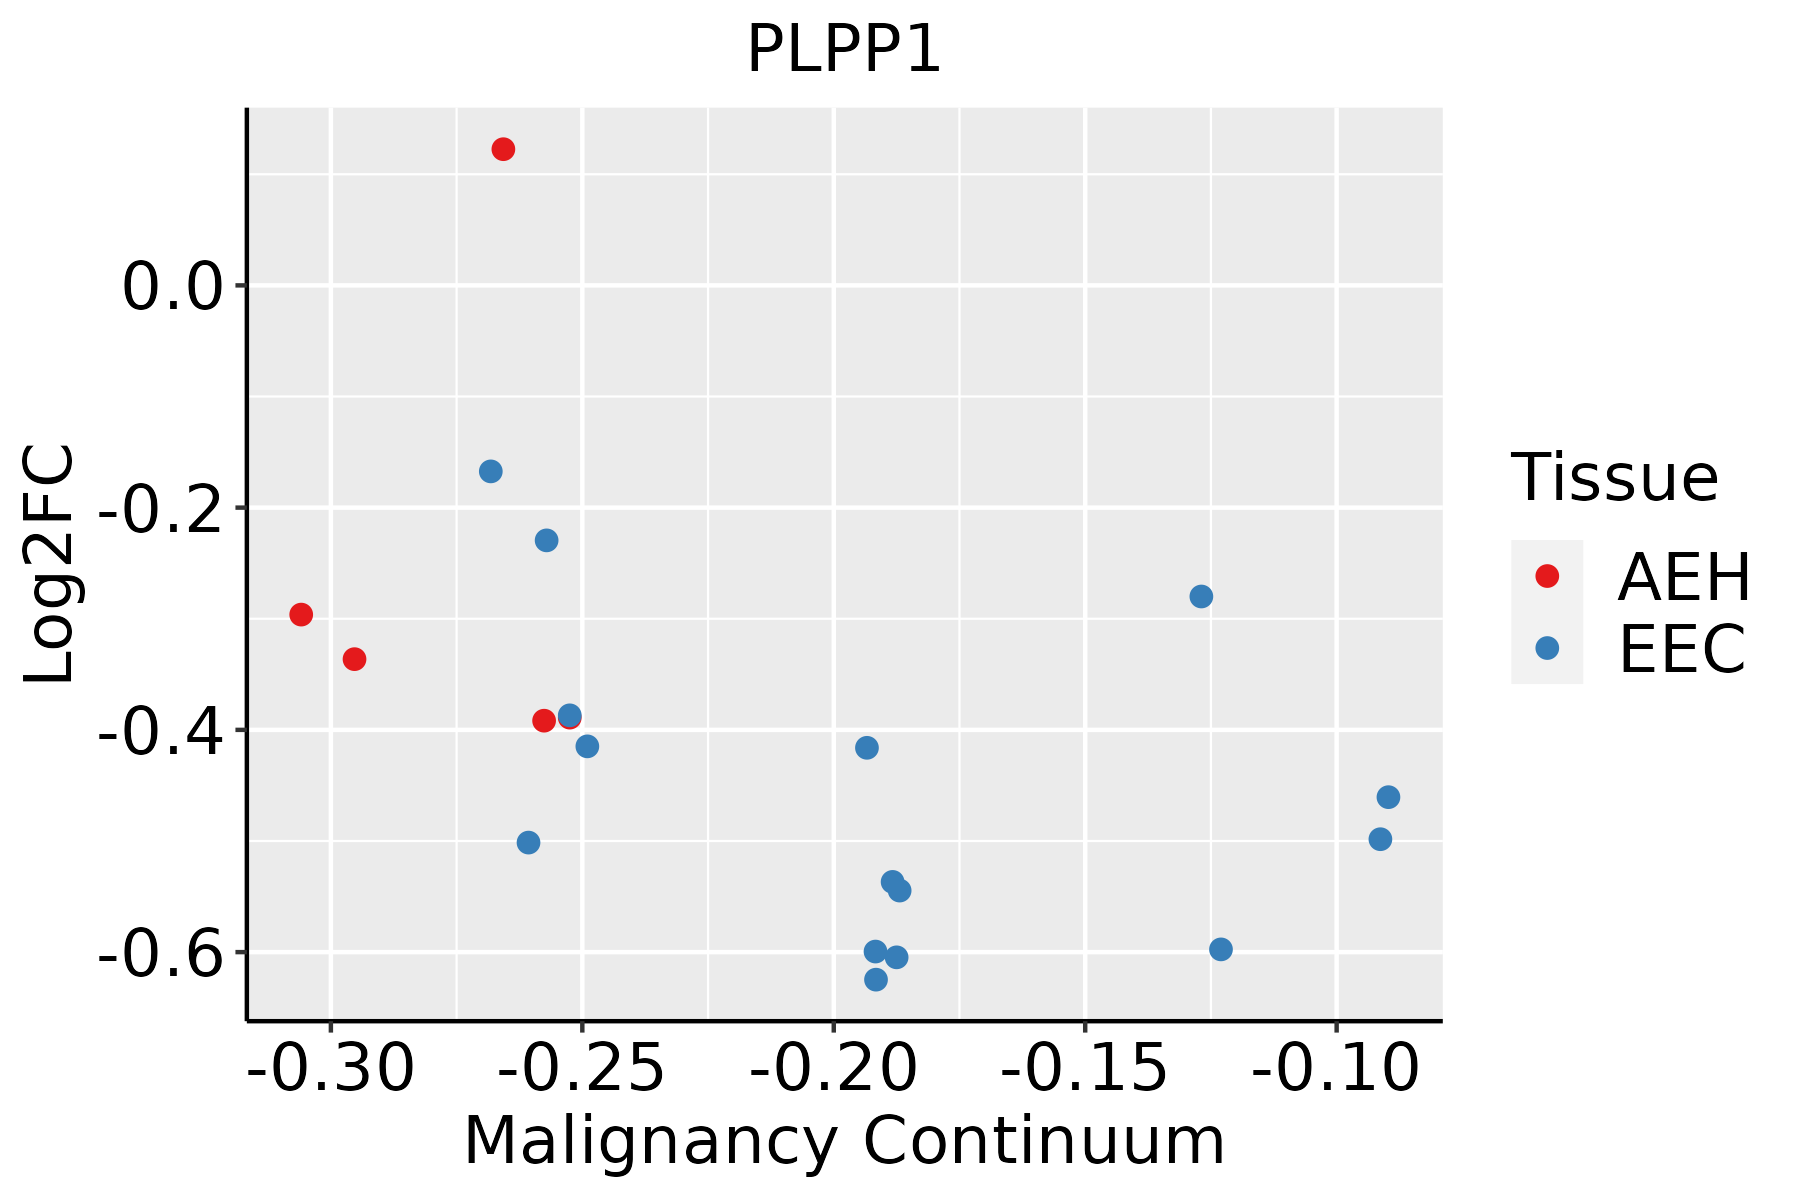 | AEH: Atypical endometrial hyperplasia |
| EEC: Endometrioid Cancer |
| Esophagus | 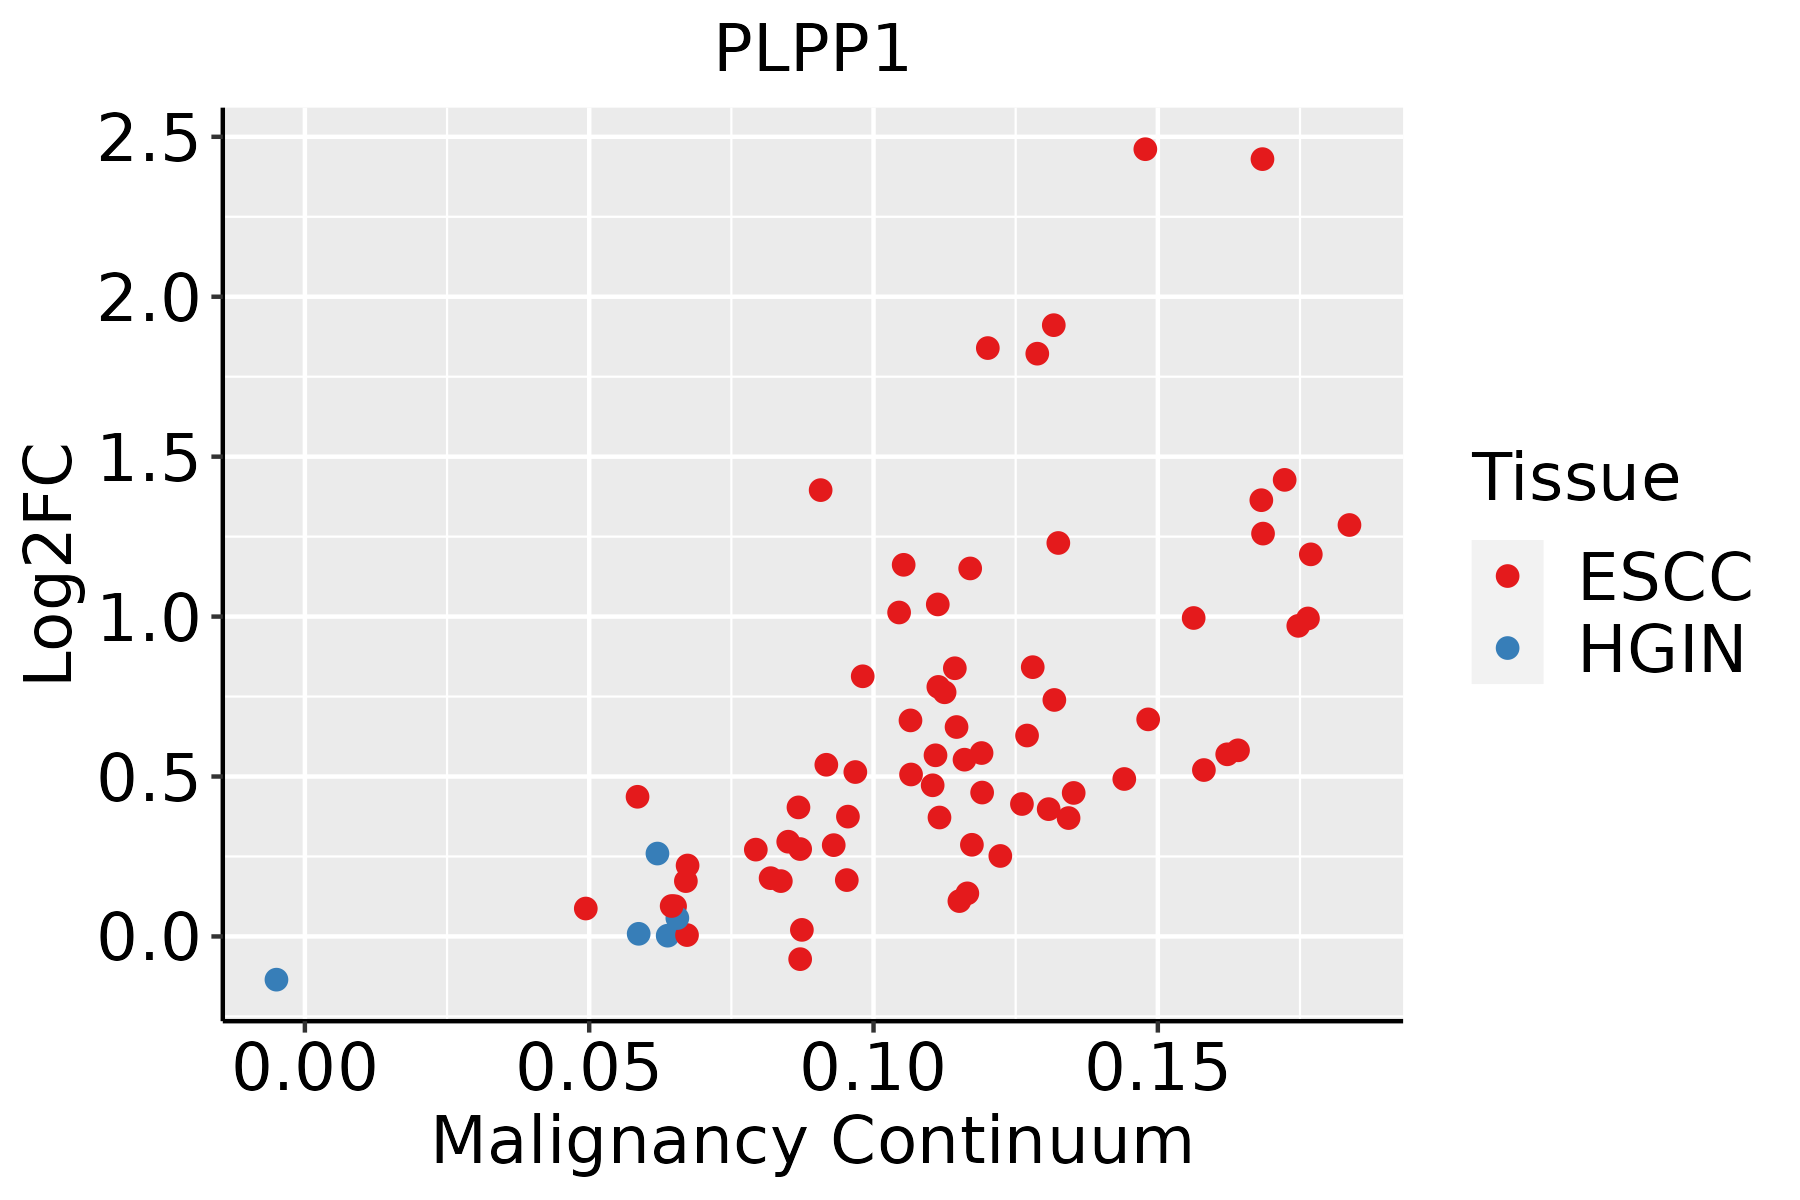 | ESCC: Esophageal squamous cell carcinoma |
| HGIN: High-grade intraepithelial neoplasias |
| LGIN: Low-grade intraepithelial neoplasias |
| Liver |  | HCC: Hepatocellular carcinoma |
| NAFLD: Non-alcoholic fatty liver disease |
| Oral Cavity | 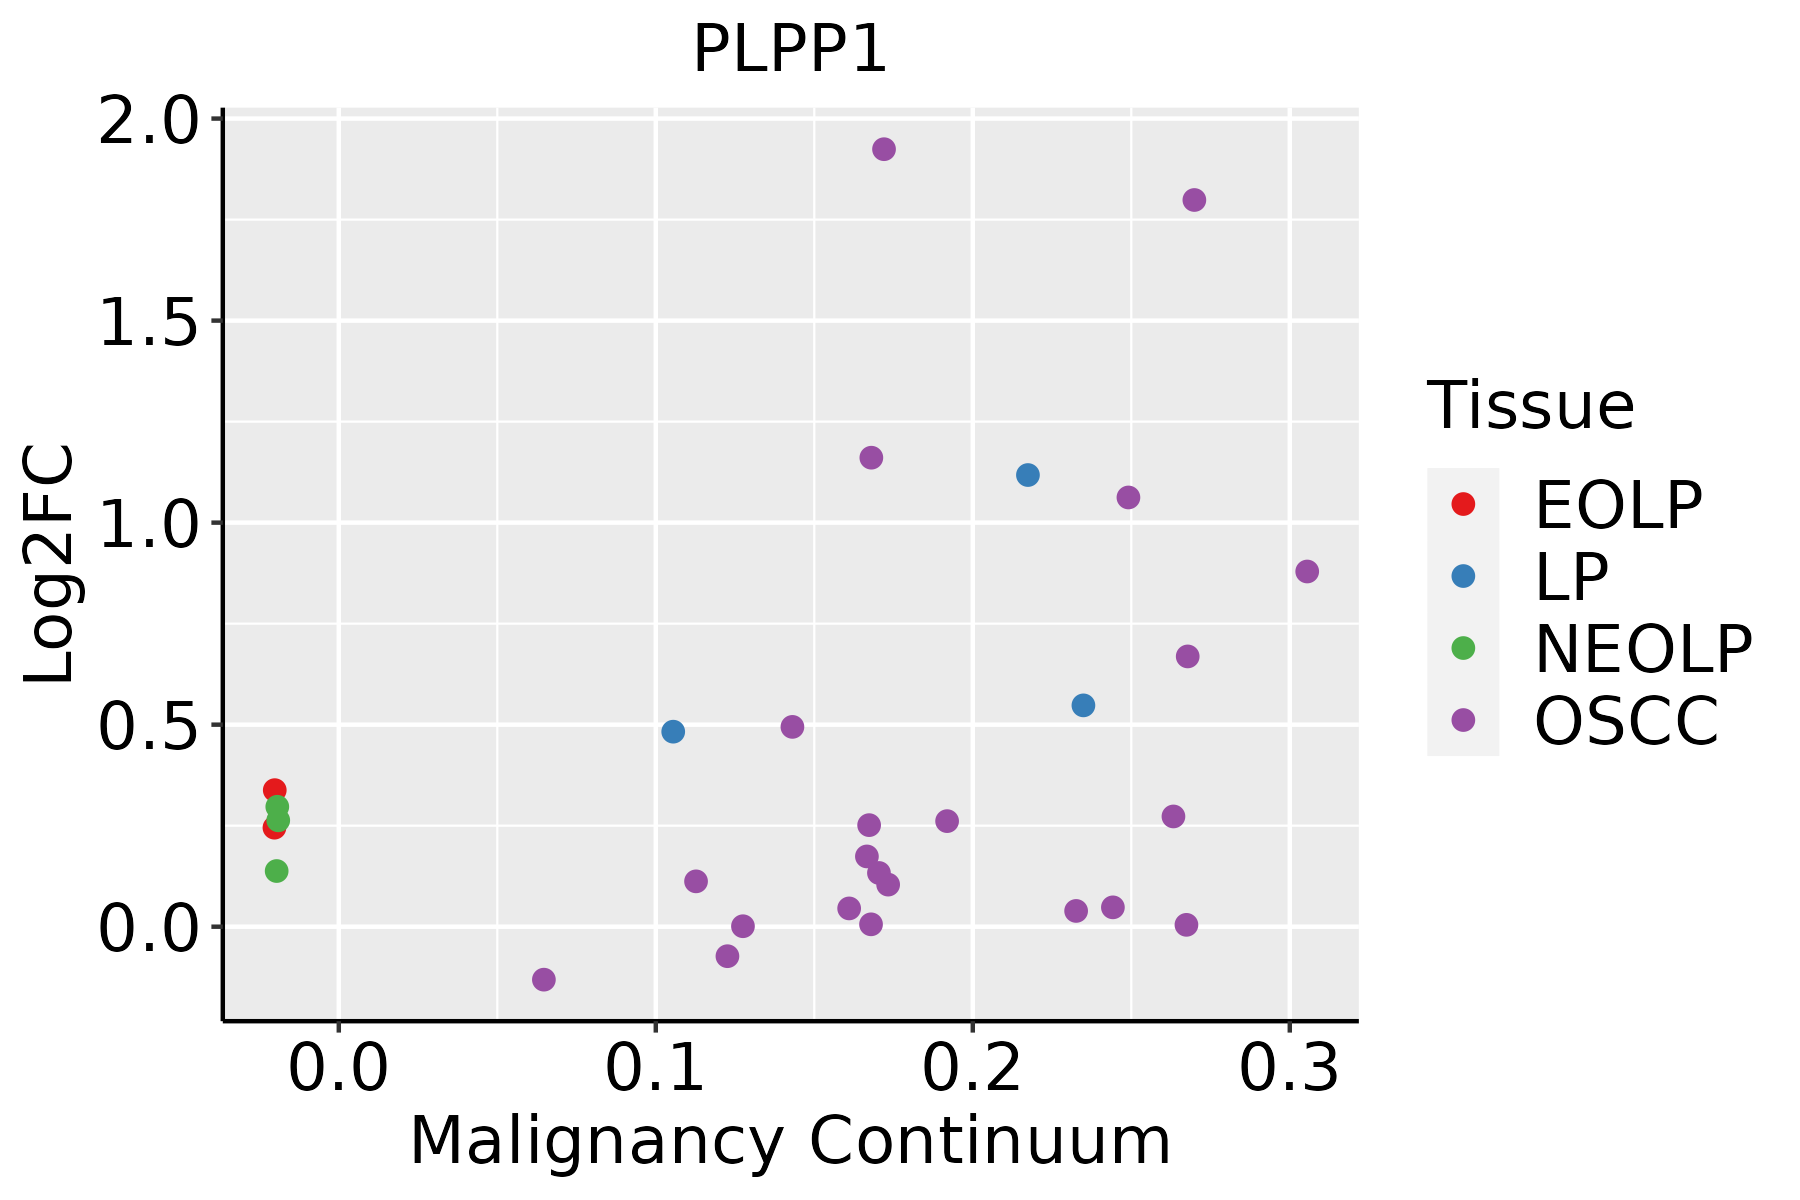 | EOLP: Erosive Oral lichen planus |
| LP: leukoplakia |
| NEOLP: Non-erosive oral lichen planus |
| OSCC: Oral squamous cell carcinoma |
| Prostate | 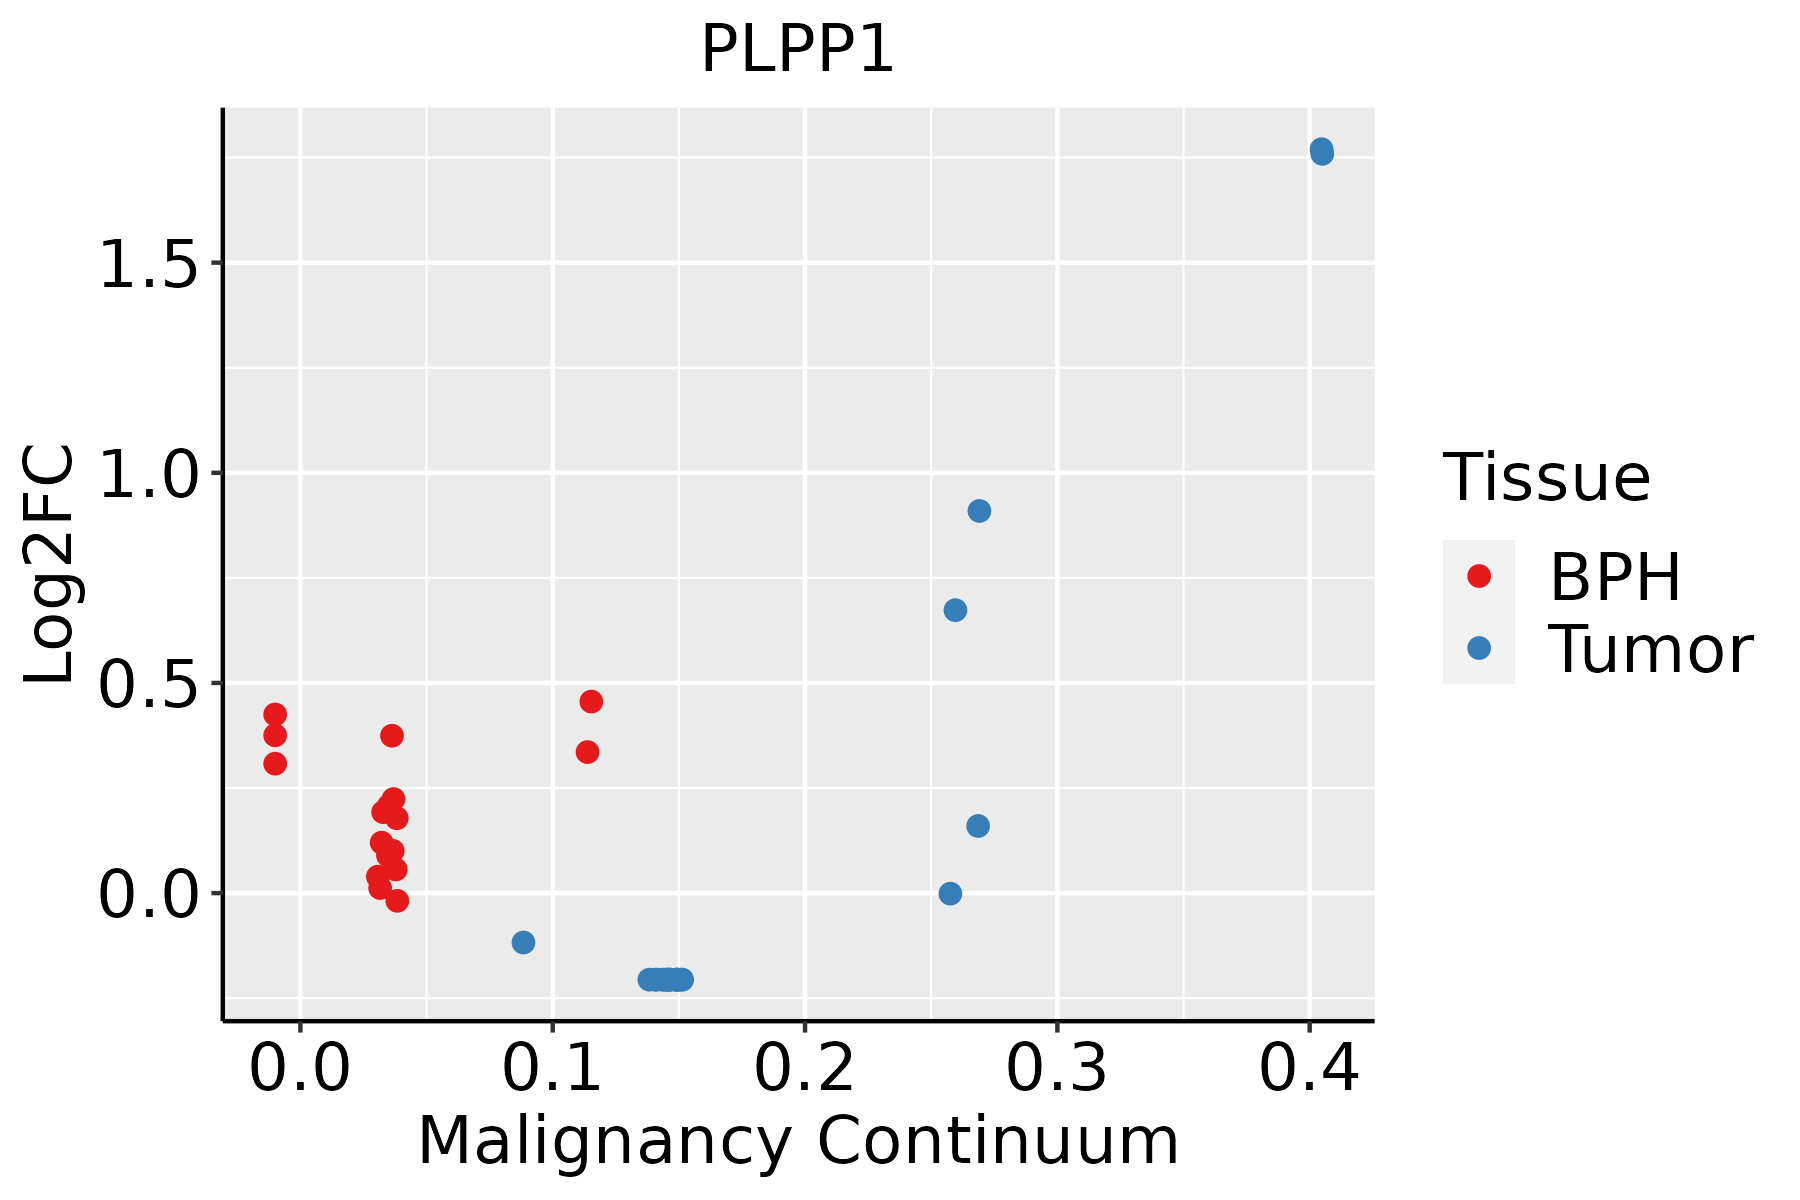 | BPH: Benign Prostatic Hyperplasia |
| Thyroid | 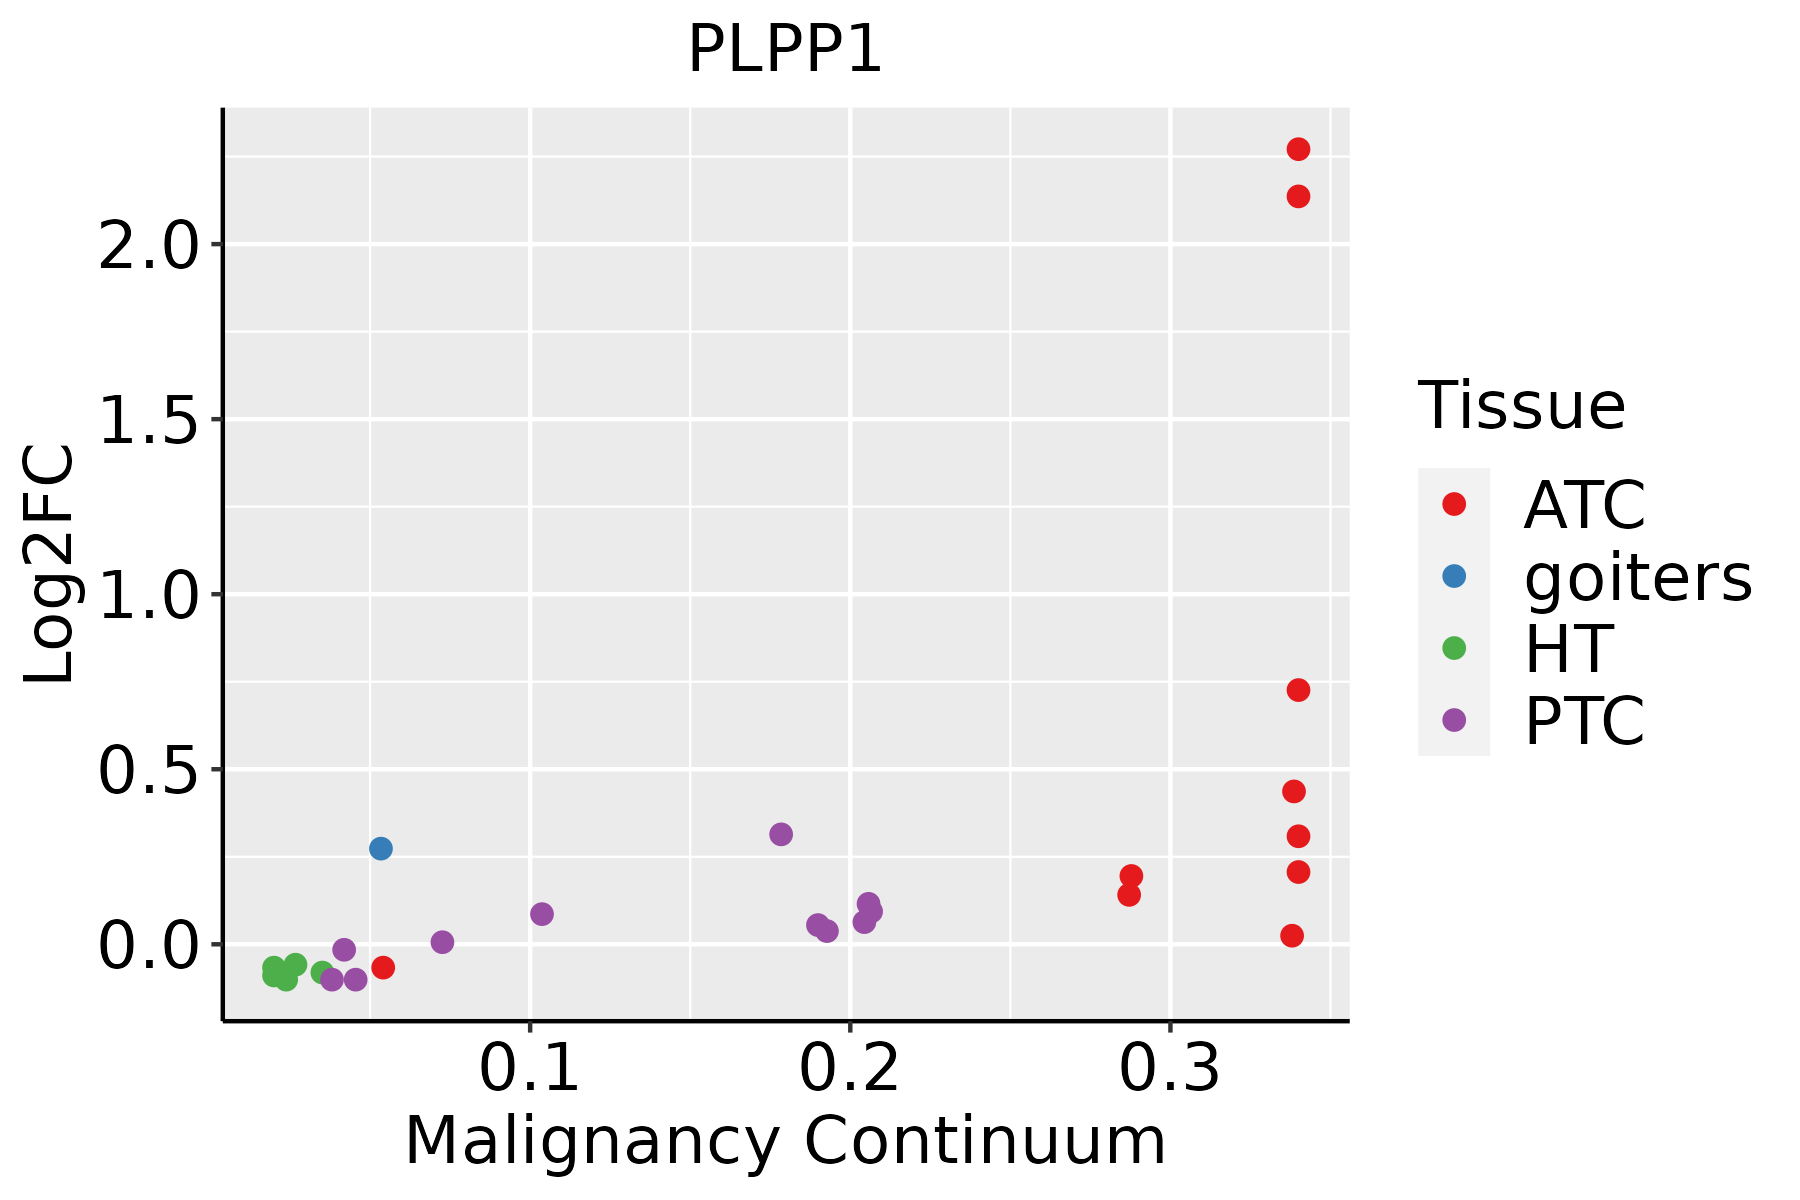 | ATC: Anaplastic thyroid cancer |
| HT: Hashimoto's thyroiditis |
| PTC: Papillary thyroid cancer |
| GO ID | Tissue | Disease Stage | Description | Gene Ratio | Bg Ratio | pvalue | p.adjust | Count |
| GO:004854510 | Cervix | CC | response to steroid hormone | 74/2311 | 339/18723 | 5.71e-07 | 2.09e-05 | 74 |
| GO:00305229 | Cervix | CC | intracellular receptor signaling pathway | 60/2311 | 265/18723 | 1.89e-06 | 5.97e-05 | 60 |
| GO:00163117 | Cervix | CC | dephosphorylation | 73/2311 | 417/18723 | 1.23e-03 | 9.87e-03 | 73 |
| GO:00713839 | Cervix | CC | cellular response to steroid hormone stimulus | 40/2311 | 204/18723 | 1.93e-03 | 1.42e-02 | 40 |
| GO:00305188 | Cervix | CC | intracellular steroid hormone receptor signaling pathway | 25/2311 | 116/18723 | 3.59e-03 | 2.30e-02 | 25 |
| GO:00305218 | Cervix | CC | androgen receptor signaling pathway | 12/2311 | 44/18723 | 5.76e-03 | 3.30e-02 | 12 |
| GO:0071383 | Colorectum | AD | cellular response to steroid hormone stimulus | 73/3918 | 204/18723 | 6.31e-07 | 2.24e-05 | 73 |
| GO:0030522 | Colorectum | AD | intracellular receptor signaling pathway | 87/3918 | 265/18723 | 3.69e-06 | 1.03e-04 | 87 |
| GO:0043401 | Colorectum | AD | steroid hormone mediated signaling pathway | 51/3918 | 136/18723 | 6.52e-06 | 1.63e-04 | 51 |
| GO:0048545 | Colorectum | AD | response to steroid hormone | 104/3918 | 339/18723 | 1.33e-05 | 2.90e-04 | 104 |
| GO:0016311 | Colorectum | AD | dephosphorylation | 123/3918 | 417/18723 | 1.84e-05 | 3.82e-04 | 123 |
| GO:0009755 | Colorectum | AD | hormone-mediated signaling pathway | 64/3918 | 190/18723 | 2.78e-05 | 5.24e-04 | 64 |
| GO:0006066 | Colorectum | AD | alcohol metabolic process | 106/3918 | 353/18723 | 3.02e-05 | 5.57e-04 | 106 |
| GO:0030518 | Colorectum | AD | intracellular steroid hormone receptor signaling pathway | 43/3918 | 116/18723 | 4.61e-05 | 7.97e-04 | 43 |
| GO:0030258 | Colorectum | AD | lipid modification | 67/3918 | 212/18723 | 1.66e-04 | 2.27e-03 | 67 |
| GO:0030521 | Colorectum | AD | androgen receptor signaling pathway | 20/3918 | 44/18723 | 2.26e-04 | 2.94e-03 | 20 |
| GO:0006644 | Colorectum | AD | phospholipid metabolic process | 101/3918 | 383/18723 | 5.80e-03 | 3.67e-02 | 101 |
| GO:00713832 | Colorectum | MSS | cellular response to steroid hormone stimulus | 72/3467 | 204/18723 | 8.87e-09 | 5.43e-07 | 72 |
| GO:00434012 | Colorectum | MSS | steroid hormone mediated signaling pathway | 51/3467 | 136/18723 | 1.43e-07 | 6.67e-06 | 51 |
| GO:00305222 | Colorectum | MSS | intracellular receptor signaling pathway | 84/3467 | 265/18723 | 1.47e-07 | 6.79e-06 | 84 |
| Pathway ID | Tissue | Disease Stage | Description | Gene Ratio | Bg Ratio | pvalue | p.adjust | qvalue | Count |
| hsa0466612 | Cervix | CC | Fc gamma R-mediated phagocytosis | 31/1267 | 97/8465 | 1.78e-05 | 1.42e-04 | 8.40e-05 | 31 |
| hsa0466613 | Cervix | CC | Fc gamma R-mediated phagocytosis | 31/1267 | 97/8465 | 1.78e-05 | 1.42e-04 | 8.40e-05 | 31 |
| hsa04666 | Colorectum | AD | Fc gamma R-mediated phagocytosis | 46/2092 | 97/8465 | 9.10e-07 | 1.22e-05 | 7.77e-06 | 46 |
| hsa00561 | Colorectum | AD | Glycerolipid metabolism | 24/2092 | 63/8465 | 1.25e-02 | 4.54e-02 | 2.90e-02 | 24 |
| hsa046661 | Colorectum | AD | Fc gamma R-mediated phagocytosis | 46/2092 | 97/8465 | 9.10e-07 | 1.22e-05 | 7.77e-06 | 46 |
| hsa005611 | Colorectum | AD | Glycerolipid metabolism | 24/2092 | 63/8465 | 1.25e-02 | 4.54e-02 | 2.90e-02 | 24 |
| hsa046664 | Colorectum | MSS | Fc gamma R-mediated phagocytosis | 45/1875 | 97/8465 | 9.30e-08 | 1.56e-06 | 9.55e-07 | 45 |
| hsa05231 | Colorectum | MSS | Choline metabolism in cancer | 34/1875 | 98/8465 | 2.90e-03 | 1.39e-02 | 8.50e-03 | 34 |
| hsa005612 | Colorectum | MSS | Glycerolipid metabolism | 23/1875 | 63/8465 | 6.55e-03 | 2.64e-02 | 1.62e-02 | 23 |
| hsa046665 | Colorectum | MSS | Fc gamma R-mediated phagocytosis | 45/1875 | 97/8465 | 9.30e-08 | 1.56e-06 | 9.55e-07 | 45 |
| hsa052311 | Colorectum | MSS | Choline metabolism in cancer | 34/1875 | 98/8465 | 2.90e-03 | 1.39e-02 | 8.50e-03 | 34 |
| hsa005613 | Colorectum | MSS | Glycerolipid metabolism | 23/1875 | 63/8465 | 6.55e-03 | 2.64e-02 | 1.62e-02 | 23 |
| hsa046666 | Colorectum | FAP | Fc gamma R-mediated phagocytosis | 35/1404 | 97/8465 | 2.46e-06 | 4.28e-05 | 2.60e-05 | 35 |
| hsa052312 | Colorectum | FAP | Choline metabolism in cancer | 29/1404 | 98/8465 | 9.03e-04 | 5.20e-03 | 3.16e-03 | 29 |
| hsa046667 | Colorectum | FAP | Fc gamma R-mediated phagocytosis | 35/1404 | 97/8465 | 2.46e-06 | 4.28e-05 | 2.60e-05 | 35 |
| hsa052313 | Colorectum | FAP | Choline metabolism in cancer | 29/1404 | 98/8465 | 9.03e-04 | 5.20e-03 | 3.16e-03 | 29 |
| hsa046668 | Colorectum | CRC | Fc gamma R-mediated phagocytosis | 27/1091 | 97/8465 | 6.24e-05 | 1.12e-03 | 7.57e-04 | 27 |
| hsa052314 | Colorectum | CRC | Choline metabolism in cancer | 24/1091 | 98/8465 | 1.21e-03 | 9.84e-03 | 6.67e-03 | 24 |
| hsa046669 | Colorectum | CRC | Fc gamma R-mediated phagocytosis | 27/1091 | 97/8465 | 6.24e-05 | 1.12e-03 | 7.57e-04 | 27 |
| hsa052315 | Colorectum | CRC | Choline metabolism in cancer | 24/1091 | 98/8465 | 1.21e-03 | 9.84e-03 | 6.67e-03 | 24 |
| Hugo Symbol | Variant Class | Variant Classification | dbSNP RS | HGVSc | HGVSp | HGVSp Short | SWISSPROT | BIOTYPE | SIFT | PolyPhen | Tumor Sample Barcode | Tissue | Histology | Sex | Age | Stage | Therapy Types | Drugs | Outcome |
| PLPP1 | SNV | Missense_Mutation | novel | c.350C>G | p.Thr117Ser | p.T117S | O14494 | protein_coding | deleterious(0) | possibly_damaging(0.834) | TCGA-GM-A3NW-01 | Breast | breast invasive carcinoma | Female | <65 | I/II | Chemotherapy | fluorouracil | SD |
| PLPP1 | SNV | Missense_Mutation | rs757205685 | c.580G>A | p.Asp194Asn | p.D194N | O14494 | protein_coding | tolerated(0.1) | possibly_damaging(0.479) | TCGA-DS-A1OB-01 | Cervix | cervical & endocervical cancer | Female | <65 | I/II | Chemotherapy | carboplatin | PD |
| PLPP1 | SNV | Missense_Mutation | | c.761G>T | p.Arg254Ile | p.R254I | O14494 | protein_coding | deleterious(0) | possibly_damaging(0.514) | TCGA-AG-A002-01 | Colorectum | rectum adenocarcinoma | Male | <65 | I/II | Unknown | Unknown | SD |
| PLPP1 | SNV | Missense_Mutation | | c.548N>C | p.Val183Ala | p.V183A | O14494 | protein_coding | deleterious(0) | benign(0.167) | TCGA-A5-A0GW-01 | Endometrium | uterine corpus endometrioid carcinoma | Female | <65 | I/II | Unknown | Unknown | SD |
| PLPP1 | SNV | Missense_Mutation | | c.112N>T | p.Gly38Cys | p.G38C | O14494 | protein_coding | deleterious(0) | probably_damaging(1) | TCGA-AP-A059-01 | Endometrium | uterine corpus endometrioid carcinoma | Female | >=65 | I/II | Unknown | Unknown | SD |
| PLPP1 | SNV | Missense_Mutation | novel | c.303N>C | p.Lys101Asn | p.K101N | O14494 | protein_coding | deleterious(0) | probably_damaging(0.99) | TCGA-AX-A05Z-01 | Endometrium | uterine corpus endometrioid carcinoma | Female | <65 | III/IV | Chemotherapy | adriamycin | SD |
| PLPP1 | SNV | Missense_Mutation | | c.302N>C | p.Lys101Thr | p.K101T | O14494 | protein_coding | deleterious(0) | probably_damaging(0.985) | TCGA-AX-A0J0-01 | Endometrium | uterine corpus endometrioid carcinoma | Female | <65 | I/II | Unknown | Unknown | SD |
| PLPP1 | SNV | Missense_Mutation | novel | c.479G>C | p.Arg160Thr | p.R160T | O14494 | protein_coding | tolerated(0.21) | benign(0.017) | TCGA-B5-A3S1-01 | Endometrium | uterine corpus endometrioid carcinoma | Female | >=65 | III/IV | Chemotherapy | paclitaxel | SD |
| PLPP1 | SNV | Missense_Mutation | | c.305C>T | p.Ala102Val | p.A102V | O14494 | protein_coding | tolerated(0.61) | possibly_damaging(0.619) | TCGA-D1-A103-01 | Endometrium | uterine corpus endometrioid carcinoma | Female | >=65 | I/II | Unknown | Unknown | SD |
| PLPP1 | SNV | Missense_Mutation | | c.745G>A | p.Asp249Asn | p.D249N | O14494 | protein_coding | tolerated(0.09) | benign(0.134) | TCGA-D1-A16Y-01 | Endometrium | uterine corpus endometrioid carcinoma | Female | <65 | I/II | Unknown | Unknown | SD |


