| Tissue | Expression Dynamics | Abbreviation |
| Breast | 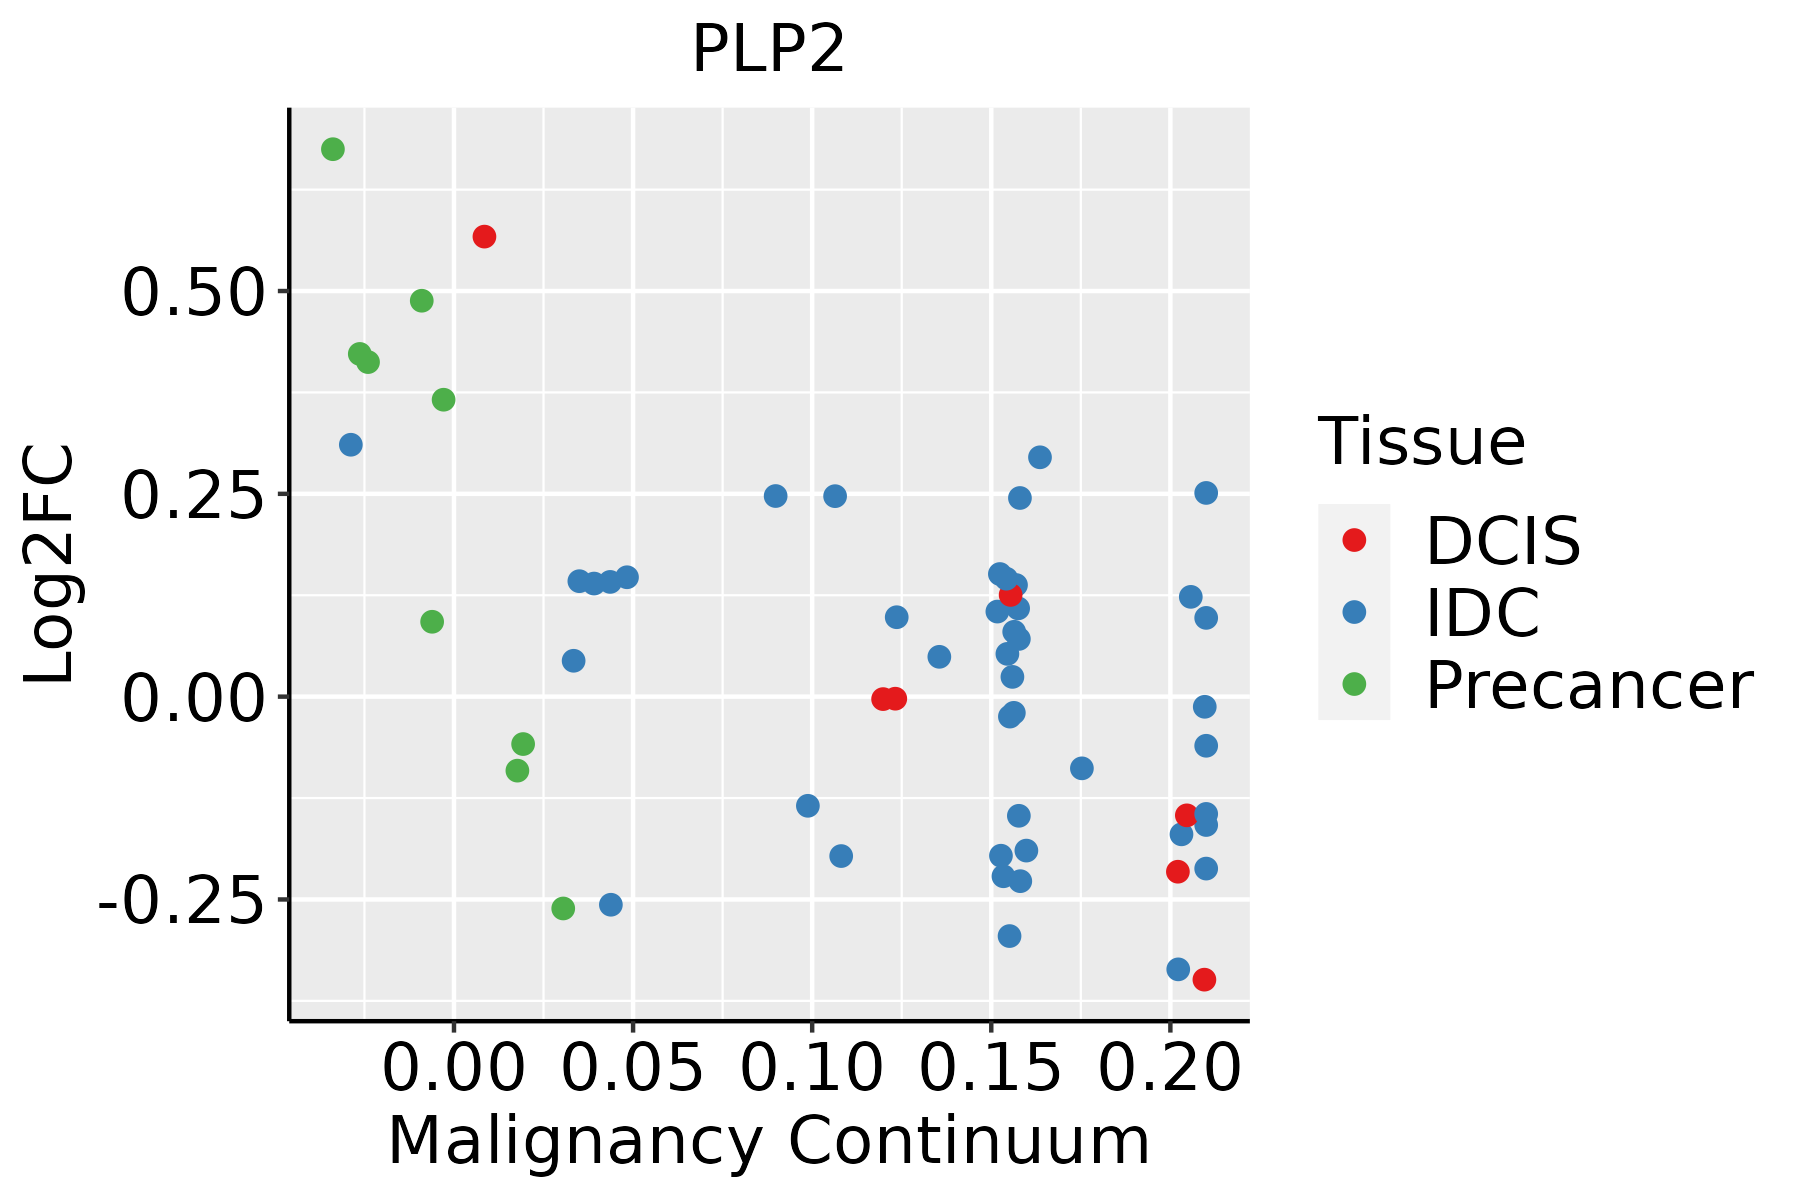 | IDC: Invasive ductal carcinoma |
| DCIS: Ductal carcinoma in situ |
| Precancer(BRCA1-mut): Precancerous lesion from BRCA1 mutation carriers |
| Cervix | 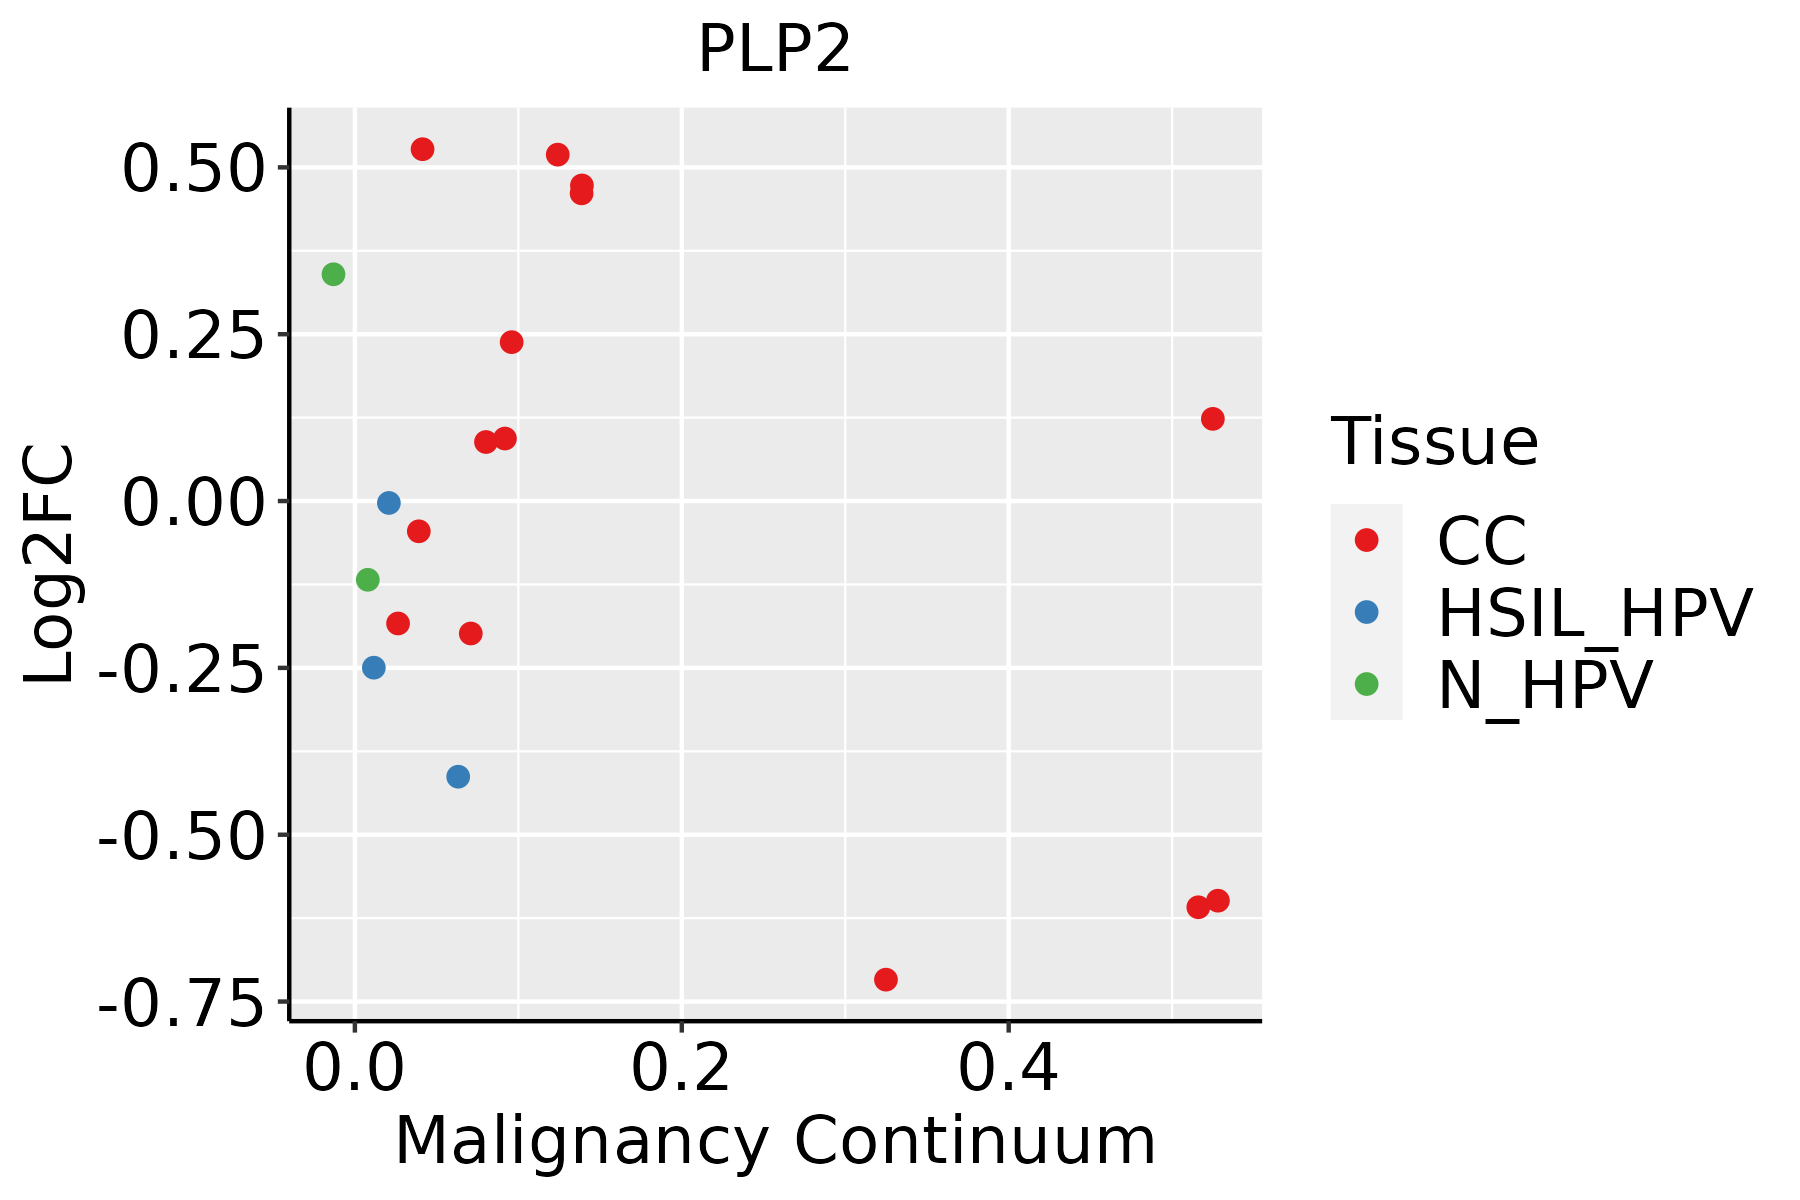 | CC: Cervix cancer |
| HSIL_HPV: HPV-infected high-grade squamous intraepithelial lesions |
| N_HPV: HPV-infected normal cervix |
| Colorectum (GSE201348) |  | FAP: Familial adenomatous polyposis |
| CRC: Colorectal cancer |
| Colorectum (HTA11) |  | AD: Adenomas |
| SER: Sessile serrated lesions |
| MSI-H: Microsatellite-high colorectal cancer |
| MSS: Microsatellite stable colorectal cancer |
| Esophagus | 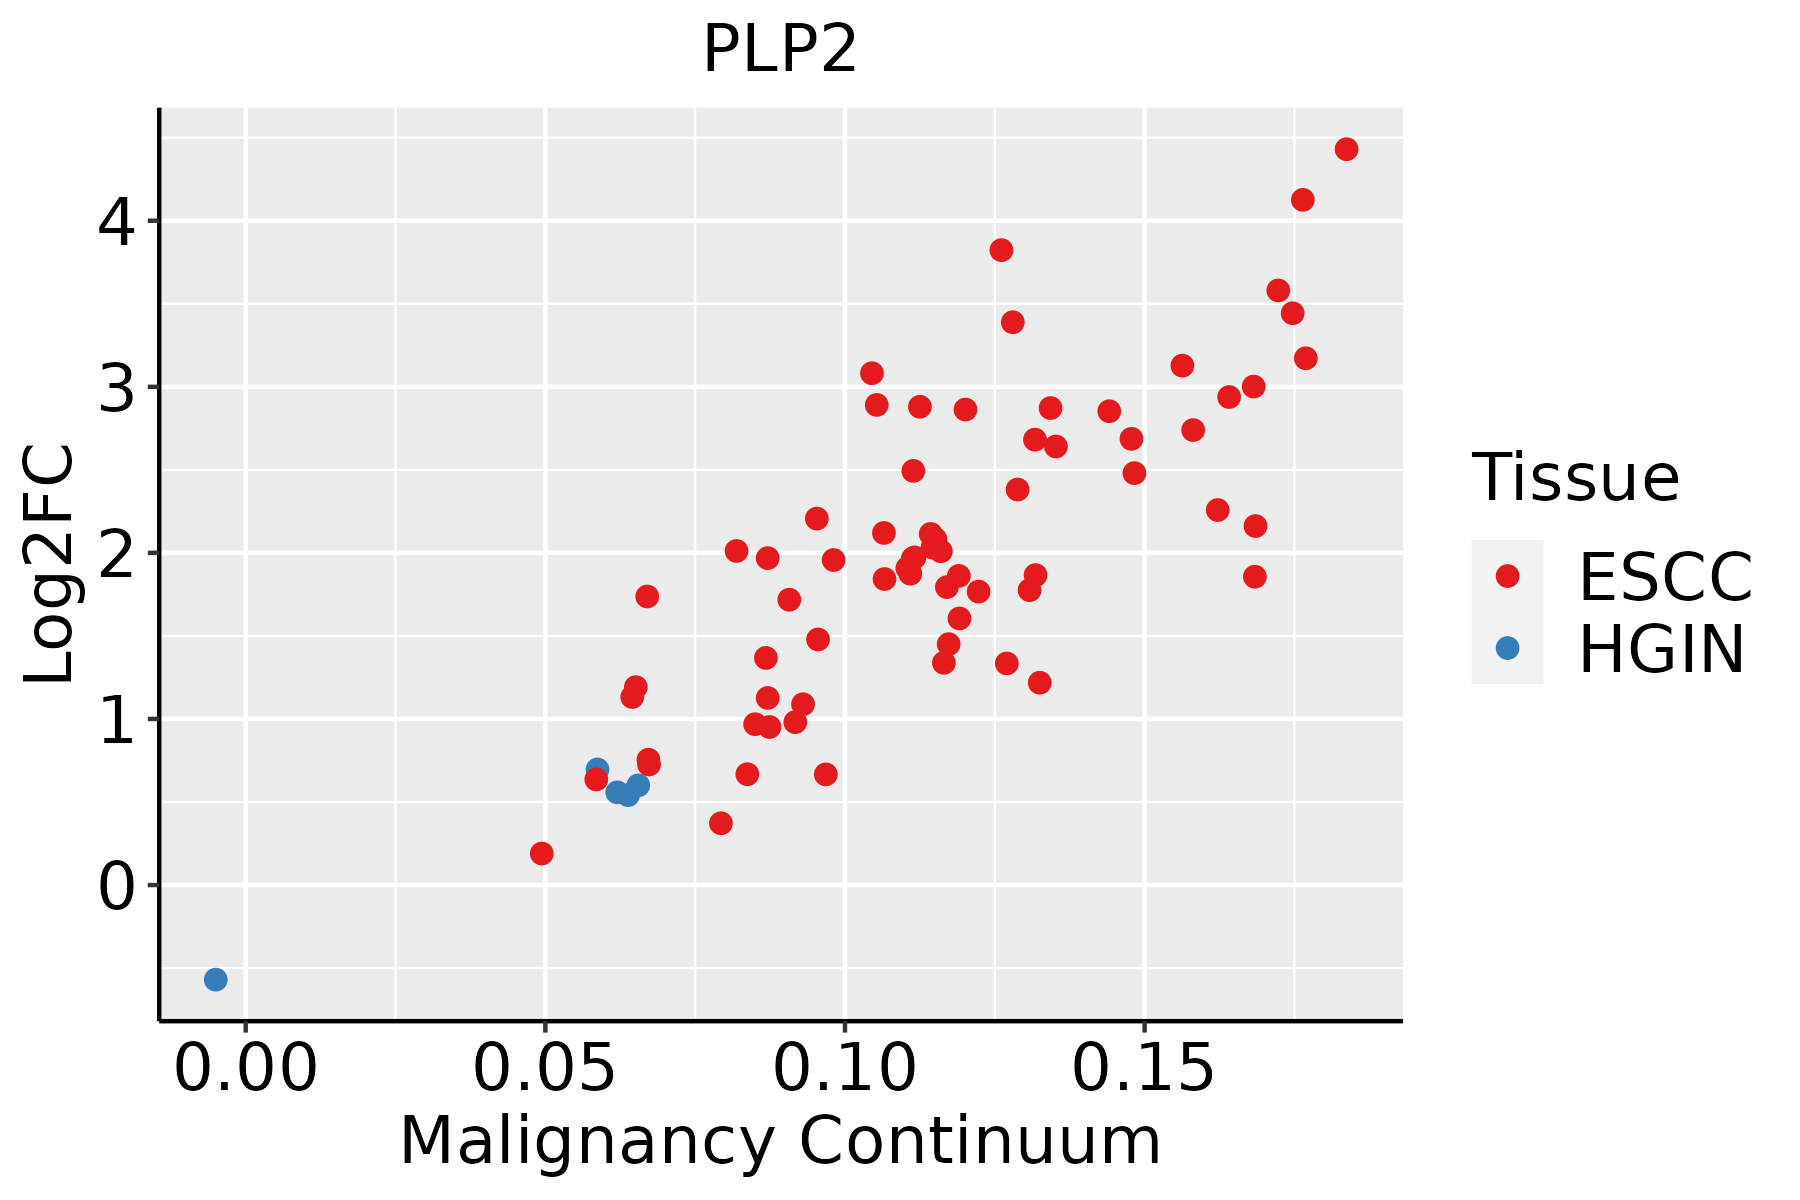 | ESCC: Esophageal squamous cell carcinoma |
| HGIN: High-grade intraepithelial neoplasias |
| LGIN: Low-grade intraepithelial neoplasias |
| Liver |  | HCC: Hepatocellular carcinoma |
| NAFLD: Non-alcoholic fatty liver disease |
| Oral Cavity |  | EOLP: Erosive Oral lichen planus |
| LP: leukoplakia |
| NEOLP: Non-erosive oral lichen planus |
| OSCC: Oral squamous cell carcinoma |
| Prostate | 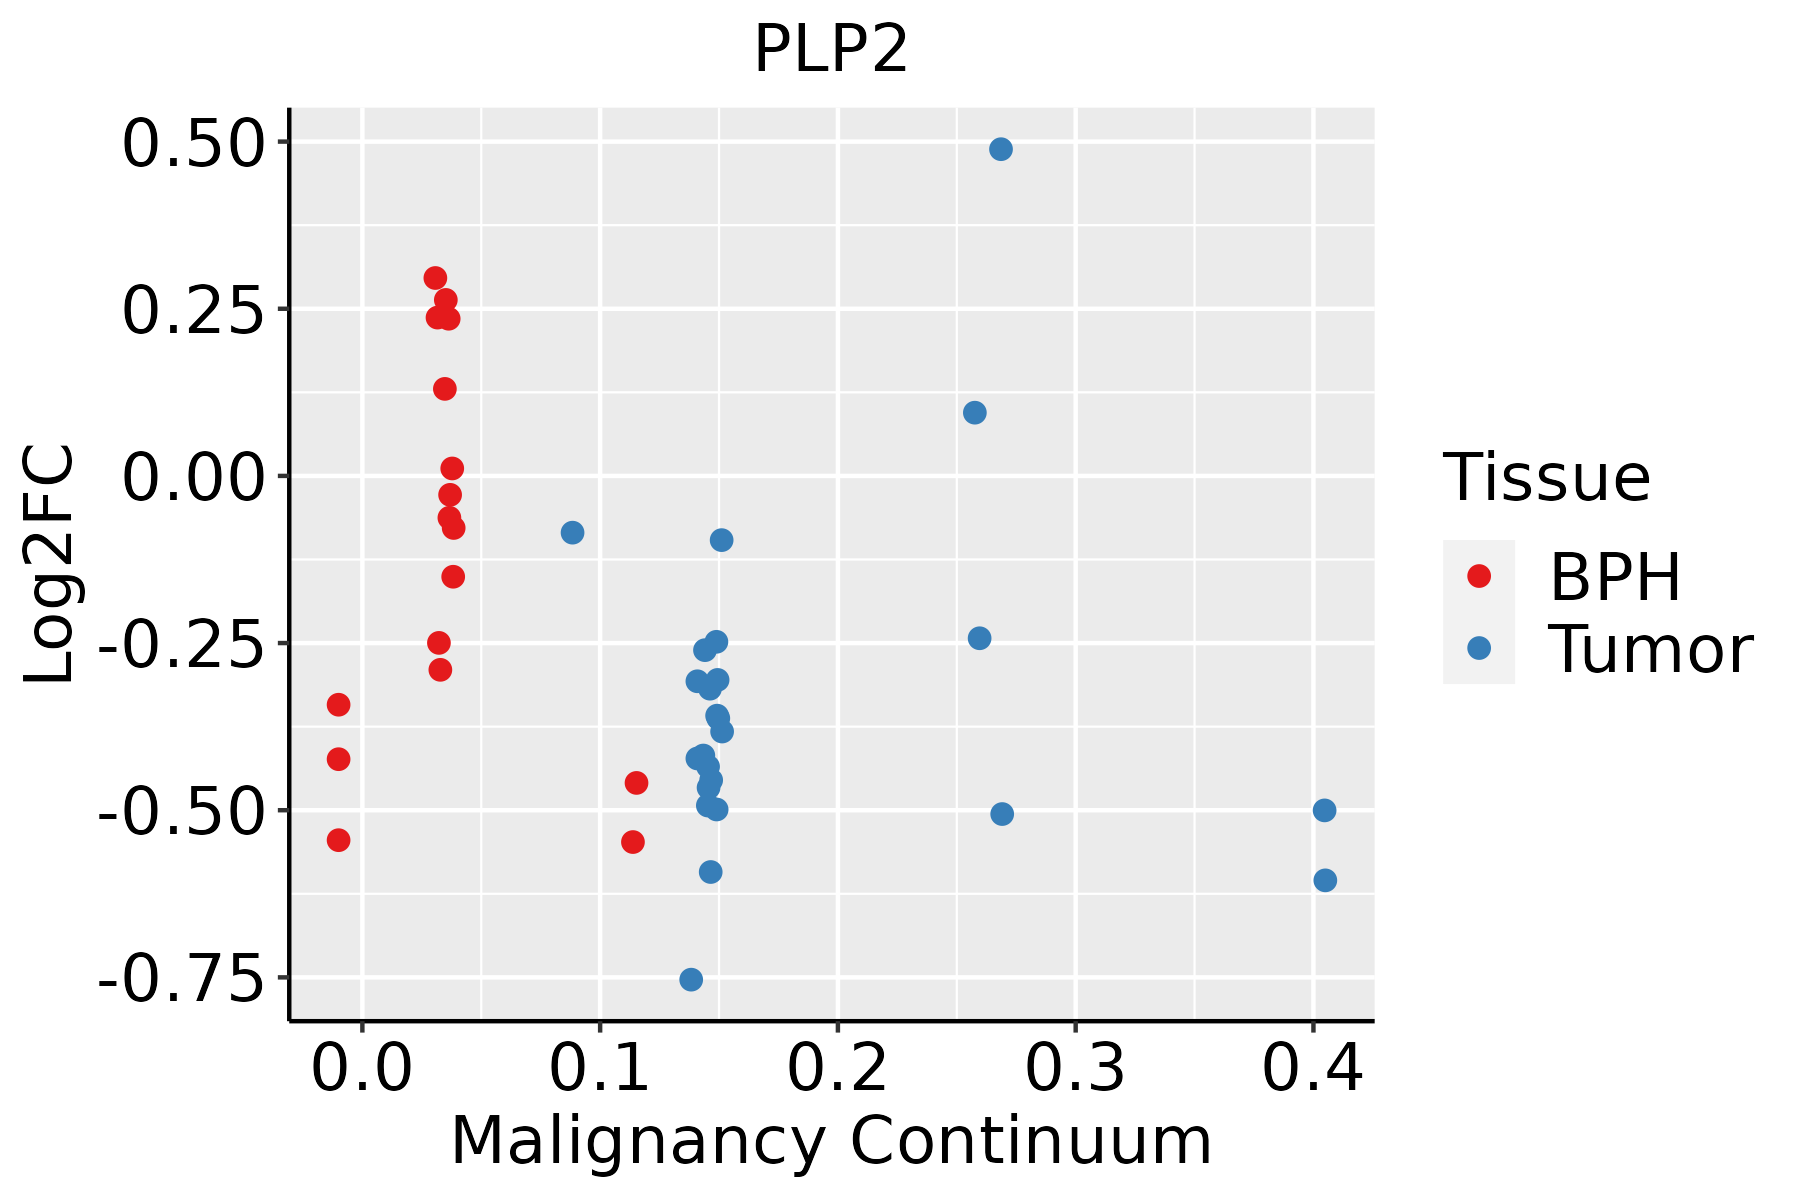 | BPH: Benign Prostatic Hyperplasia |
| Skin | 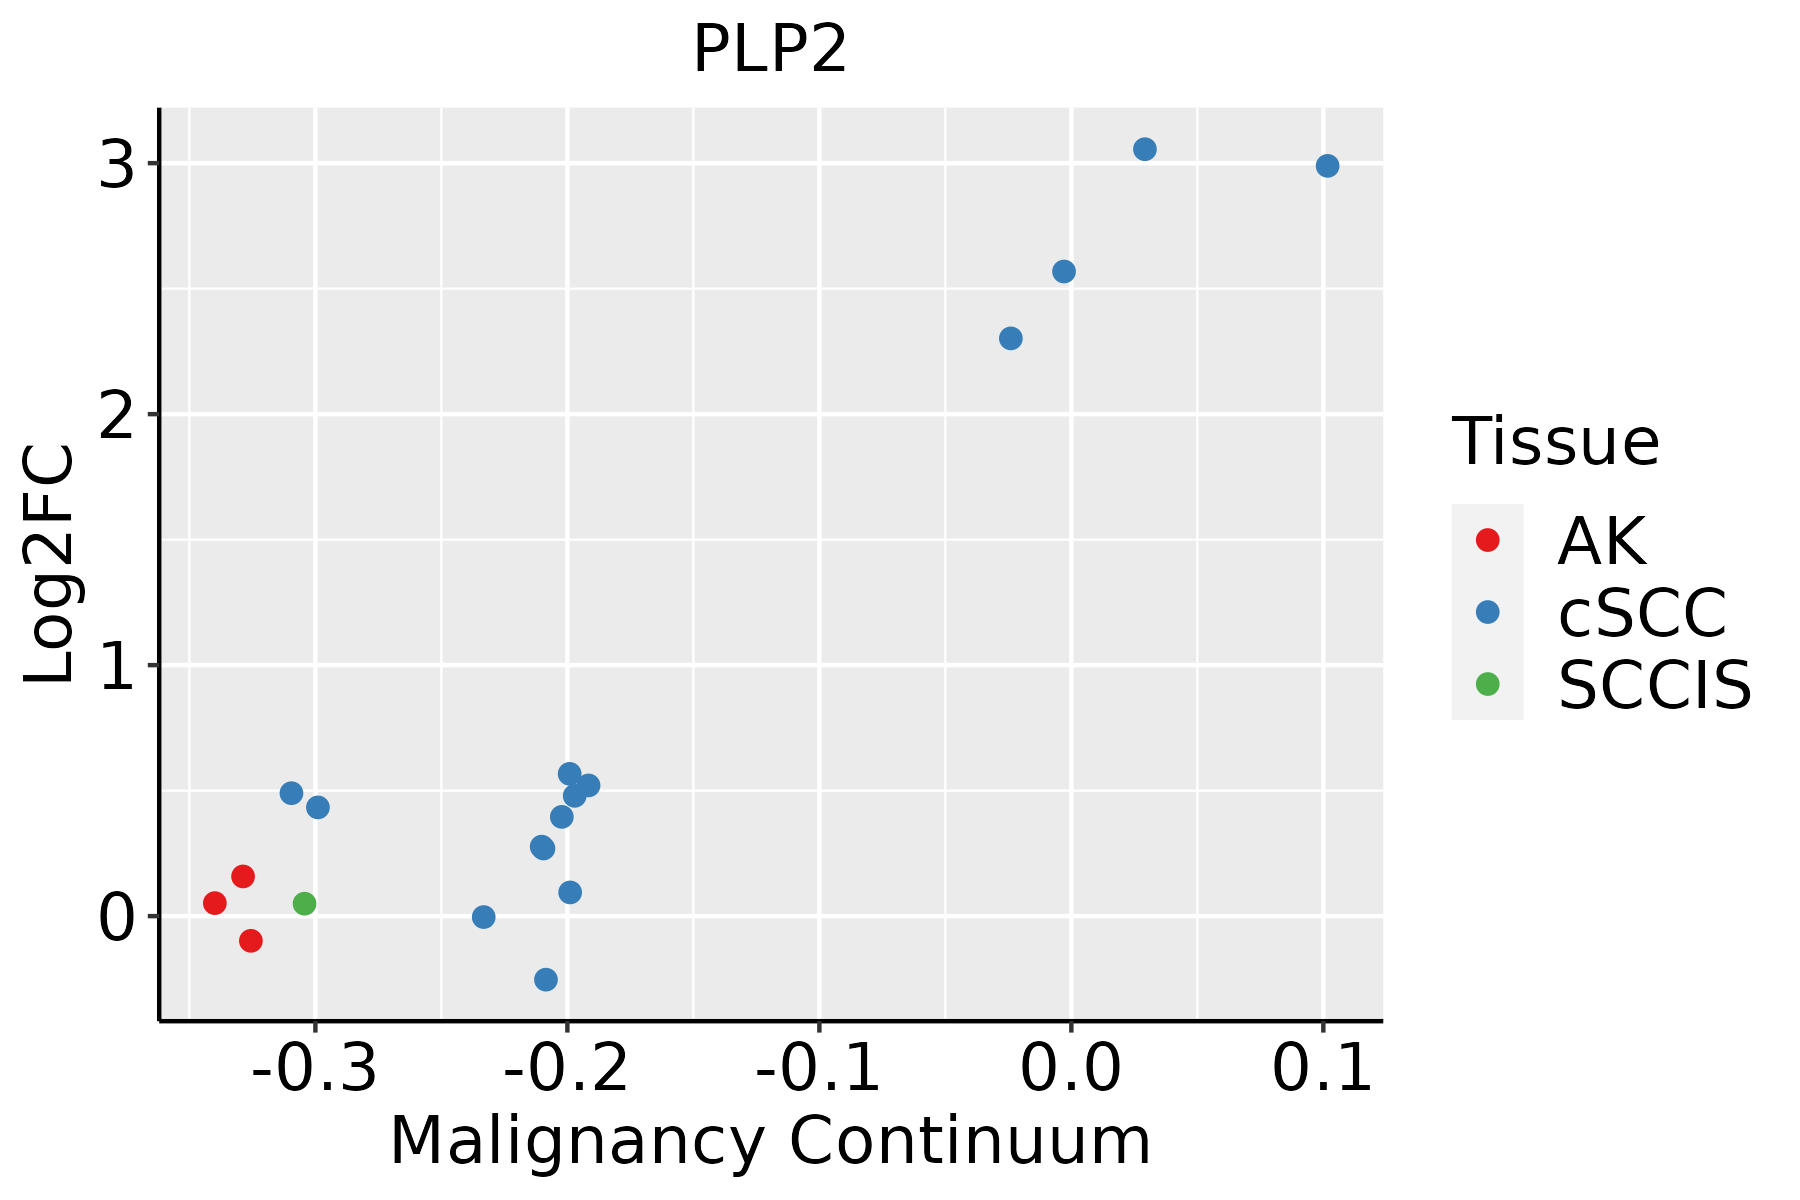 | AK: Actinic keratosis |
| cSCC: Cutaneous squamous cell carcinoma |
| SCCIS:squamous cell carcinoma in situ |
| Thyroid | 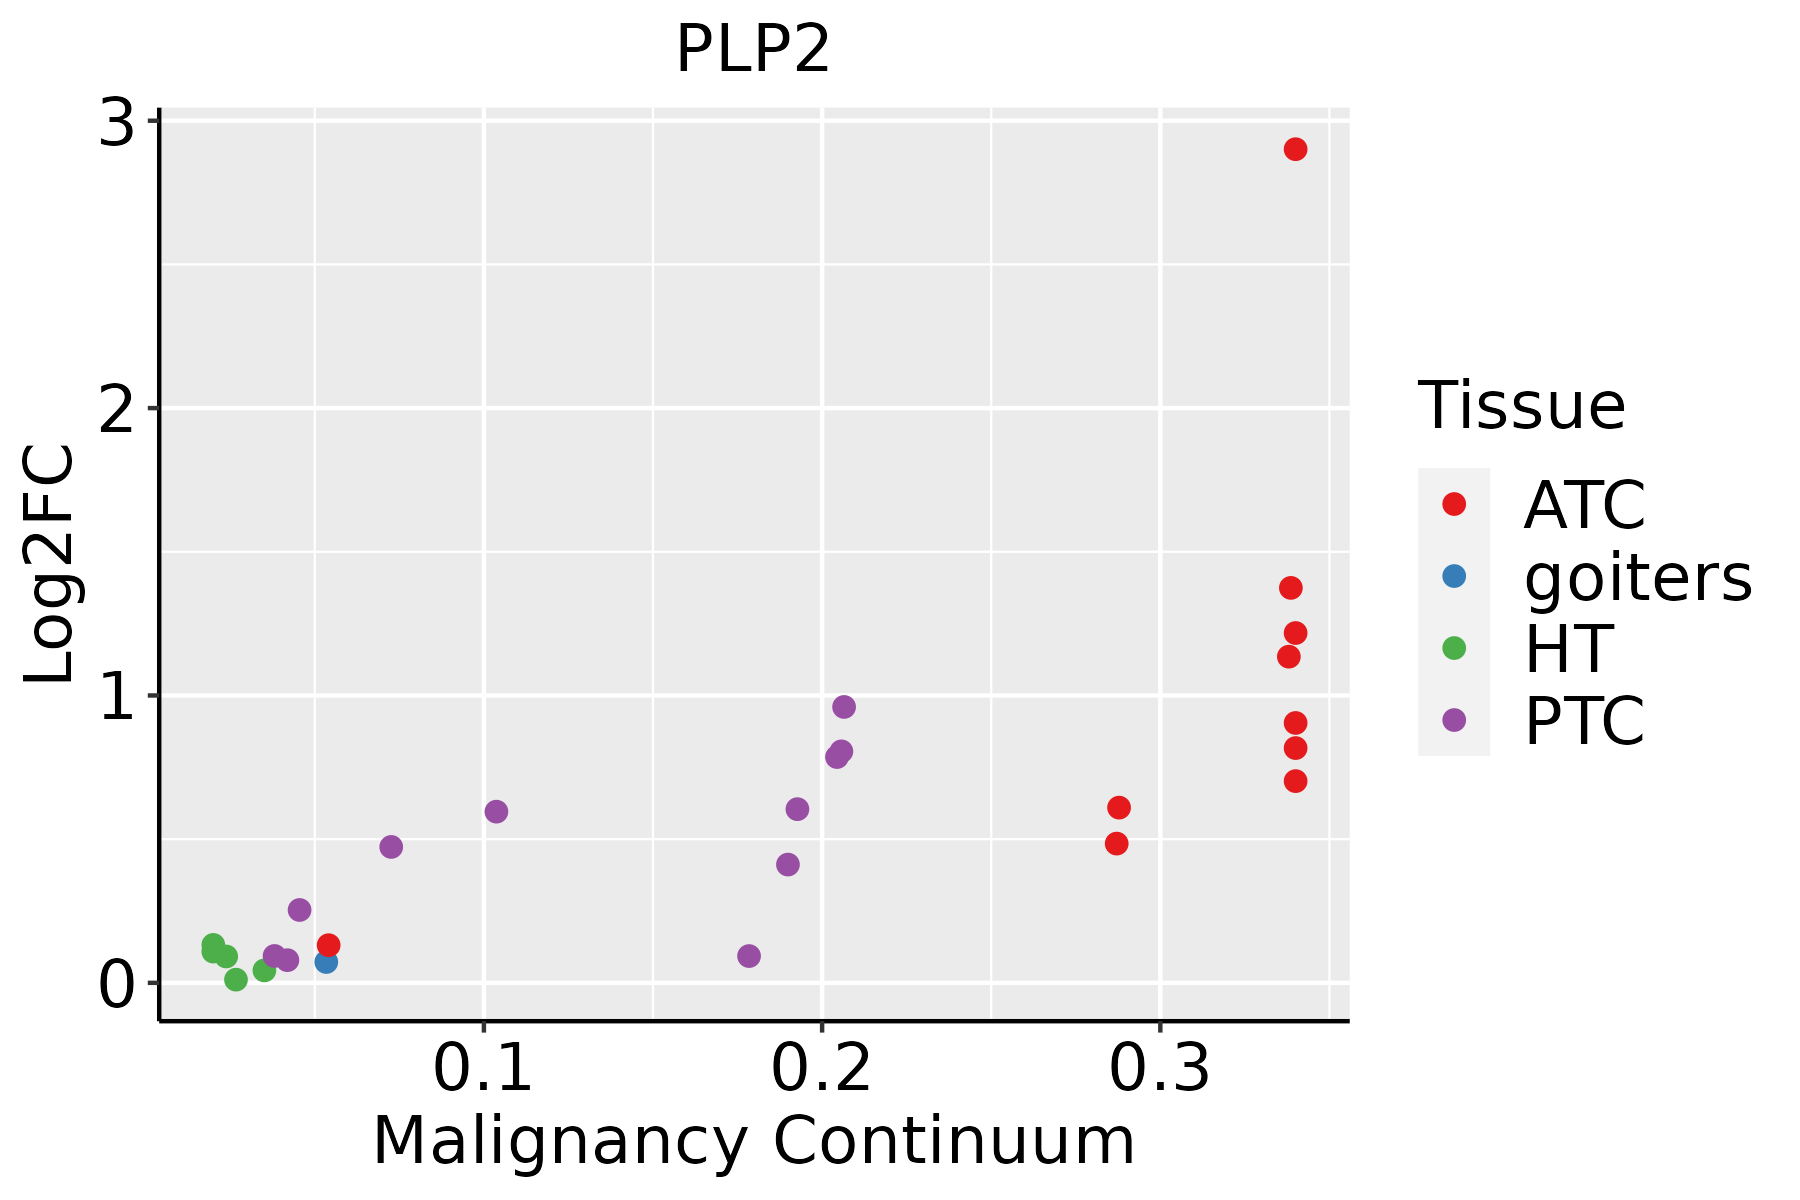 | ATC: Anaplastic thyroid cancer |
| HT: Hashimoto's thyroiditis |
| PTC: Papillary thyroid cancer |
| GO ID | Tissue | Disease Stage | Description | Gene Ratio | Bg Ratio | pvalue | p.adjust | Count |
| GO:00021819 | Breast | Precancer | cytoplasmic translation | 80/1080 | 148/18723 | 1.59e-59 | 8.54e-56 | 80 |
| GO:00064147 | Breast | Precancer | translational elongation | 10/1080 | 55/18723 | 1.06e-03 | 1.18e-02 | 10 |
| GO:000218114 | Breast | IDC | cytoplasmic translation | 82/1434 | 148/18723 | 2.60e-52 | 1.48e-48 | 82 |
| GO:000218124 | Breast | DCIS | cytoplasmic translation | 82/1390 | 148/18723 | 2.21e-53 | 1.25e-49 | 82 |
| GO:000641413 | Breast | DCIS | translational elongation | 10/1390 | 55/18723 | 6.66e-03 | 4.62e-02 | 10 |
| GO:000218110 | Cervix | CC | cytoplasmic translation | 96/2311 | 148/18723 | 4.87e-51 | 2.91e-47 | 96 |
| GO:00192213 | Cervix | CC | cytokine-mediated signaling pathway | 84/2311 | 472/18723 | 3.25e-04 | 3.44e-03 | 84 |
| GO:000218115 | Cervix | HSIL_HPV | cytoplasmic translation | 86/737 | 148/18723 | 3.97e-82 | 1.91e-78 | 86 |
| GO:00064148 | Cervix | HSIL_HPV | translational elongation | 7/737 | 55/18723 | 5.59e-03 | 4.47e-02 | 7 |
| GO:001922121 | Cervix | N_HPV | cytokine-mediated signaling pathway | 36/534 | 472/18723 | 9.30e-08 | 9.21e-06 | 36 |
| GO:0002181 | Colorectum | AD | cytoplasmic translation | 109/3918 | 148/18723 | 3.40e-43 | 2.13e-39 | 109 |
| GO:0052547 | Colorectum | AD | regulation of peptidase activity | 137/3918 | 461/18723 | 4.12e-06 | 1.12e-04 | 137 |
| GO:0045861 | Colorectum | AD | negative regulation of proteolysis | 106/3918 | 351/18723 | 2.33e-05 | 4.57e-04 | 106 |
| GO:0052548 | Colorectum | AD | regulation of endopeptidase activity | 124/3918 | 432/18723 | 6.58e-05 | 1.07e-03 | 124 |
| GO:0006414 | Colorectum | AD | translational elongation | 21/3918 | 55/18723 | 2.53e-03 | 1.93e-02 | 21 |
| GO:00021811 | Colorectum | SER | cytoplasmic translation | 102/2897 | 148/18723 | 1.38e-48 | 8.49e-45 | 102 |
| GO:00525471 | Colorectum | SER | regulation of peptidase activity | 114/2897 | 461/18723 | 1.18e-07 | 7.17e-06 | 114 |
| GO:00458611 | Colorectum | SER | negative regulation of proteolysis | 88/2897 | 351/18723 | 1.74e-06 | 7.50e-05 | 88 |
| GO:00525481 | Colorectum | SER | regulation of endopeptidase activity | 103/2897 | 432/18723 | 2.86e-06 | 1.16e-04 | 103 |
| GO:0051346 | Colorectum | SER | negative regulation of hydrolase activity | 82/2897 | 379/18723 | 8.19e-04 | 1.01e-02 | 82 |
| Hugo Symbol | Variant Class | Variant Classification | dbSNP RS | HGVSc | HGVSp | HGVSp Short | SWISSPROT | BIOTYPE | SIFT | PolyPhen | Tumor Sample Barcode | Tissue | Histology | Sex | Age | Stage | Therapy Types | Drugs | Outcome |
| PLP2 | SNV | Missense_Mutation | rs782265454 | c.406C>T | p.Arg136Trp | p.R136W | Q04941 | protein_coding | deleterious(0.02) | possibly_damaging(0.446) | TCGA-AN-A046-01 | Breast | breast invasive carcinoma | Female | >=65 | I/II | Unknown | Unknown | SD |
| PLP2 | SNV | Missense_Mutation | novel | c.407N>A | p.Arg136Gln | p.R136Q | Q04941 | protein_coding | tolerated(0.33) | benign(0.01) | TCGA-BH-A18G-01 | Breast | breast invasive carcinoma | Female | >=65 | I/II | Unknown | Unknown | SD |
| PLP2 | insertion | Nonsense_Mutation | novel | c.361_362insATTGAGATGATC | p.Ala121delinsAspTerAspAspPro | p.A121delinsD*DDP | Q04941 | protein_coding | | | TCGA-A2-A0T2-01 | Breast | breast invasive carcinoma | Female | >=65 | III/IV | Chemotherapy | xeloda | PD |
| PLP2 | insertion | Frame_Shift_Ins | novel | c.291_292insG | p.Thr98AspfsTer8 | p.T98Dfs*8 | Q04941 | protein_coding | | | TCGA-A8-A09E-01 | Breast | breast invasive carcinoma | Female | >=65 | III/IV | Hormone Therapy | anastrozole | SD |
| PLP2 | insertion | Frame_Shift_Ins | novel | c.292_293insTCCACCCGCCTCGG | p.Thr98IlefsTer27 | p.T98Ifs*27 | Q04941 | protein_coding | | | TCGA-A8-A09E-01 | Breast | breast invasive carcinoma | Female | >=65 | III/IV | Hormone Therapy | anastrozole | SD |
| PLP2 | SNV | Missense_Mutation | rs782265454 | c.406N>T | p.Arg136Trp | p.R136W | Q04941 | protein_coding | deleterious(0.02) | possibly_damaging(0.446) | TCGA-Q1-A73O-01 | Cervix | cervical & endocervical cancer | Female | <65 | I/II | Chemotherapy | cisplatin | CR |
| PLP2 | SNV | Missense_Mutation | rs782368813 | c.212T>C | p.Leu71Pro | p.L71P | Q04941 | protein_coding | deleterious(0) | probably_damaging(0.993) | TCGA-AA-3815-01 | Colorectum | colon adenocarcinoma | Female | >=65 | I/II | Unknown | Unknown | SD |
| PLP2 | SNV | Missense_Mutation | | c.130N>A | p.Ala44Thr | p.A44T | Q04941 | protein_coding | tolerated(0.1) | benign(0.011) | TCGA-AZ-6601-01 | Colorectum | colon adenocarcinoma | Male | >=65 | I/II | Unknown | Unknown | PD |
| PLP2 | SNV | Missense_Mutation | | c.107N>C | p.Leu36Pro | p.L36P | Q04941 | protein_coding | deleterious(0) | benign(0.362) | TCGA-CK-4951-01 | Colorectum | colon adenocarcinoma | Female | >=65 | I/II | Unknown | Unknown | PD |
| PLP2 | SNV | Missense_Mutation | novel | c.315N>T | p.Glu105Asp | p.E105D | Q04941 | protein_coding | tolerated(0.46) | benign(0.005) | TCGA-A5-A0G2-01 | Endometrium | uterine corpus endometrioid carcinoma | Female | <65 | III/IV | Unknown | Unknown | SD |


