
|
|||||
|
 | |
| |
| |
| |
| |
| |
|
Gene: PLOD1 |
Gene summary for PLOD1 |
| Gene information | Species | Human | Gene symbol | PLOD1 | Gene ID | 5351 |
| Gene name | procollagen-lysine,2-oxoglutarate 5-dioxygenase 1 | |
| Gene Alias | EDS6 | |
| Cytomap | 1p36.22 | |
| Gene Type | protein-coding | GO ID | GO:0001666 | UniProtAcc | A0A024R4H0 |
Top |
Malignant transformation analysis |
| Identification of the aberrant gene expression in precancerous and cancerous lesions by comparing the gene expression of stem-like cells in diseased tissues with normal stem cells |
| Entrez ID | Symbol | Replicates | Species | Organ | Tissue | Adj P-value | Log2FC | Malignancy |
| 5351 | PLOD1 | LZE4T | Human | Esophagus | ESCC | 3.15e-05 | 3.18e-01 | 0.0811 |
| 5351 | PLOD1 | LZE5T | Human | Esophagus | ESCC | 6.06e-06 | 3.53e-01 | 0.0514 |
| 5351 | PLOD1 | LZE7T | Human | Esophagus | ESCC | 1.61e-03 | 3.37e-01 | 0.0667 |
| 5351 | PLOD1 | LZE8T | Human | Esophagus | ESCC | 1.80e-04 | 3.72e-01 | 0.067 |
| 5351 | PLOD1 | LZE22T | Human | Esophagus | ESCC | 1.20e-04 | 5.00e-01 | 0.068 |
| 5351 | PLOD1 | LZE24T | Human | Esophagus | ESCC | 2.30e-05 | 3.11e-01 | 0.0596 |
| 5351 | PLOD1 | LZE22D3 | Human | Esophagus | HGIN | 1.06e-02 | 4.53e-01 | 0.0653 |
| 5351 | PLOD1 | LZE6T | Human | Esophagus | ESCC | 2.06e-03 | 7.32e-01 | 0.0845 |
| 5351 | PLOD1 | P2T-E | Human | Esophagus | ESCC | 1.01e-58 | 9.45e-01 | 0.1177 |
| 5351 | PLOD1 | P4T-E | Human | Esophagus | ESCC | 1.16e-22 | 6.61e-01 | 0.1323 |
| 5351 | PLOD1 | P5T-E | Human | Esophagus | ESCC | 6.52e-14 | 2.20e-01 | 0.1327 |
| 5351 | PLOD1 | P8T-E | Human | Esophagus | ESCC | 6.45e-32 | 5.74e-01 | 0.0889 |
| 5351 | PLOD1 | P9T-E | Human | Esophagus | ESCC | 2.26e-06 | 3.17e-01 | 0.1131 |
| 5351 | PLOD1 | P10T-E | Human | Esophagus | ESCC | 1.57e-33 | 8.25e-01 | 0.116 |
| 5351 | PLOD1 | P11T-E | Human | Esophagus | ESCC | 1.76e-25 | 1.40e+00 | 0.1426 |
| 5351 | PLOD1 | P12T-E | Human | Esophagus | ESCC | 3.44e-36 | 6.23e-01 | 0.1122 |
| 5351 | PLOD1 | P15T-E | Human | Esophagus | ESCC | 8.74e-40 | 1.07e+00 | 0.1149 |
| 5351 | PLOD1 | P16T-E | Human | Esophagus | ESCC | 2.63e-41 | 8.54e-01 | 0.1153 |
| 5351 | PLOD1 | P17T-E | Human | Esophagus | ESCC | 4.10e-19 | 9.56e-01 | 0.1278 |
| 5351 | PLOD1 | P19T-E | Human | Esophagus | ESCC | 9.19e-19 | 1.89e+00 | 0.1662 |
| Page: 1 2 3 4 5 6 |
| Tissue | Expression Dynamics | Abbreviation |
| Esophagus |  | ESCC: Esophageal squamous cell carcinoma |
| HGIN: High-grade intraepithelial neoplasias | ||
| LGIN: Low-grade intraepithelial neoplasias | ||
| Liver | 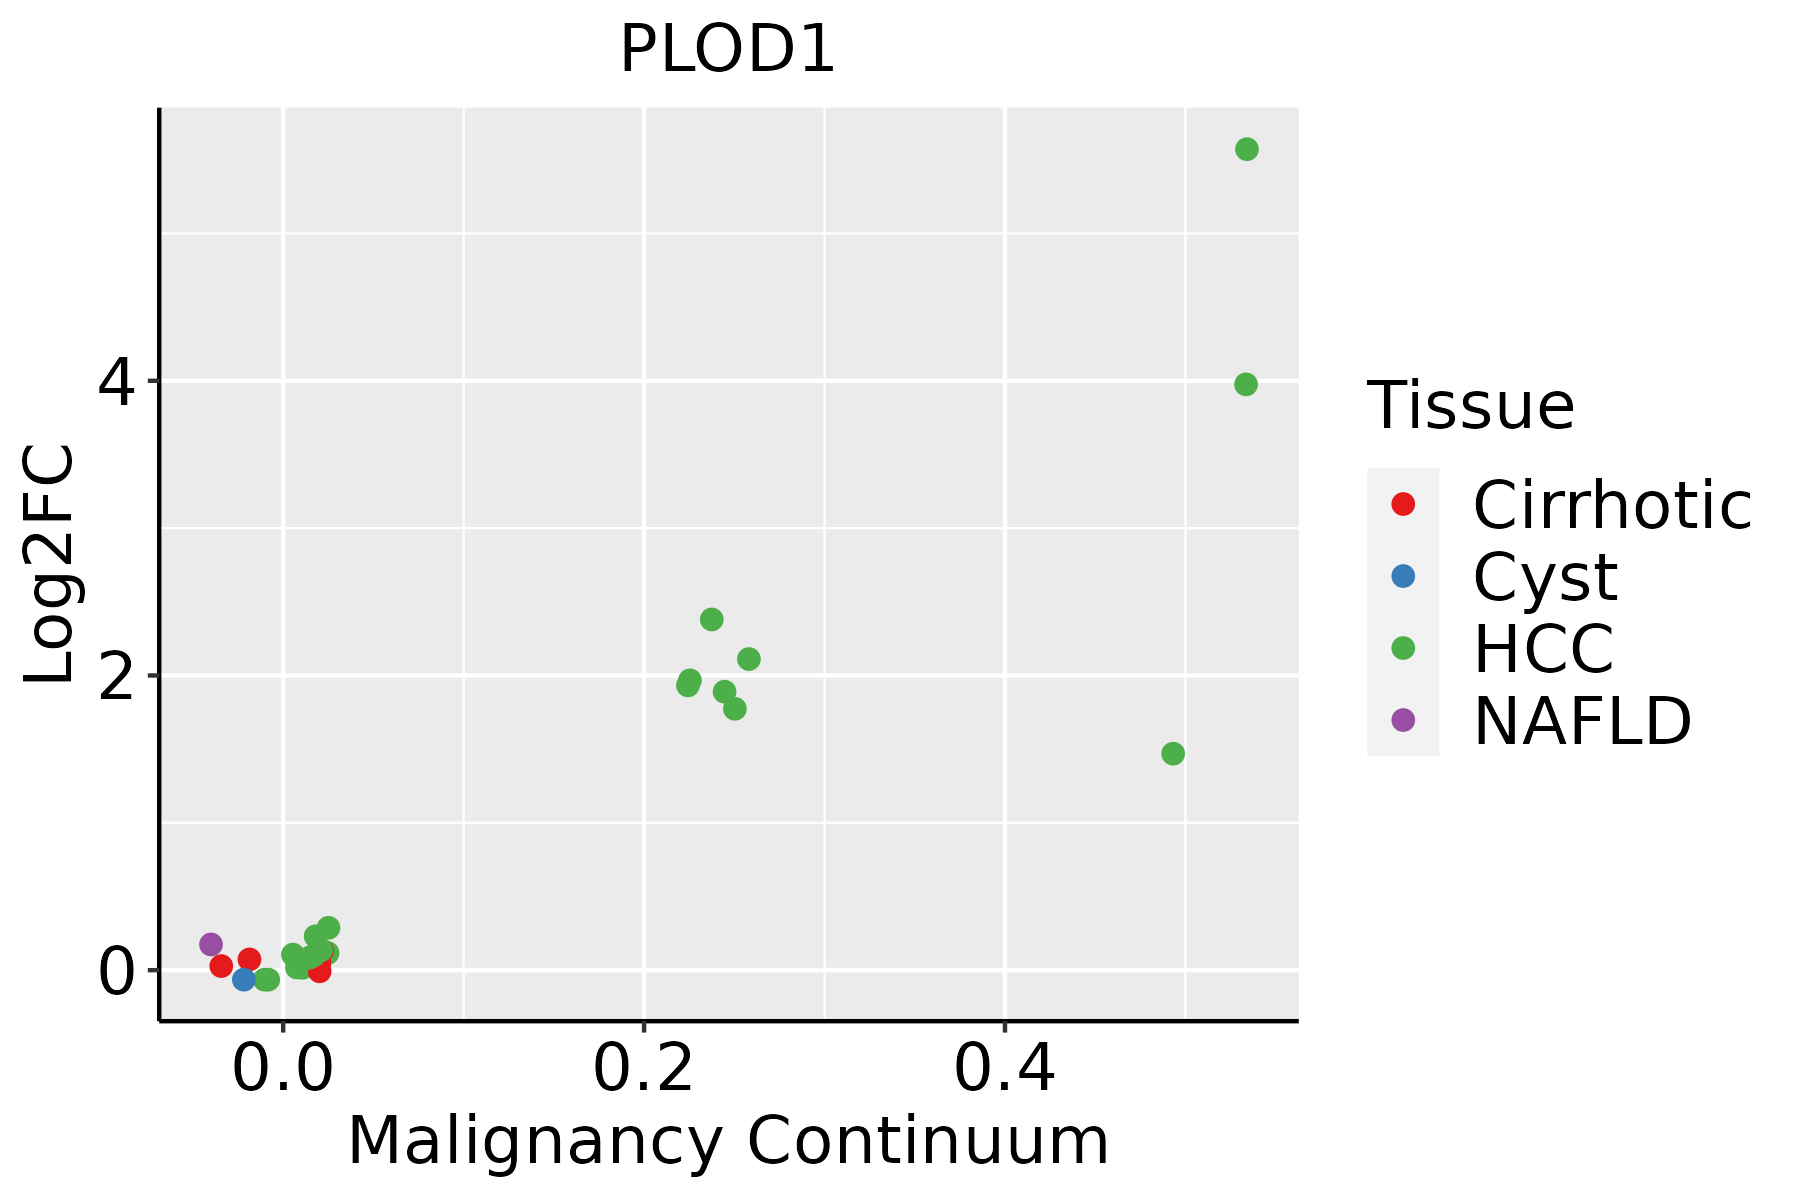 | HCC: Hepatocellular carcinoma |
| NAFLD: Non-alcoholic fatty liver disease | ||
| Oral Cavity | 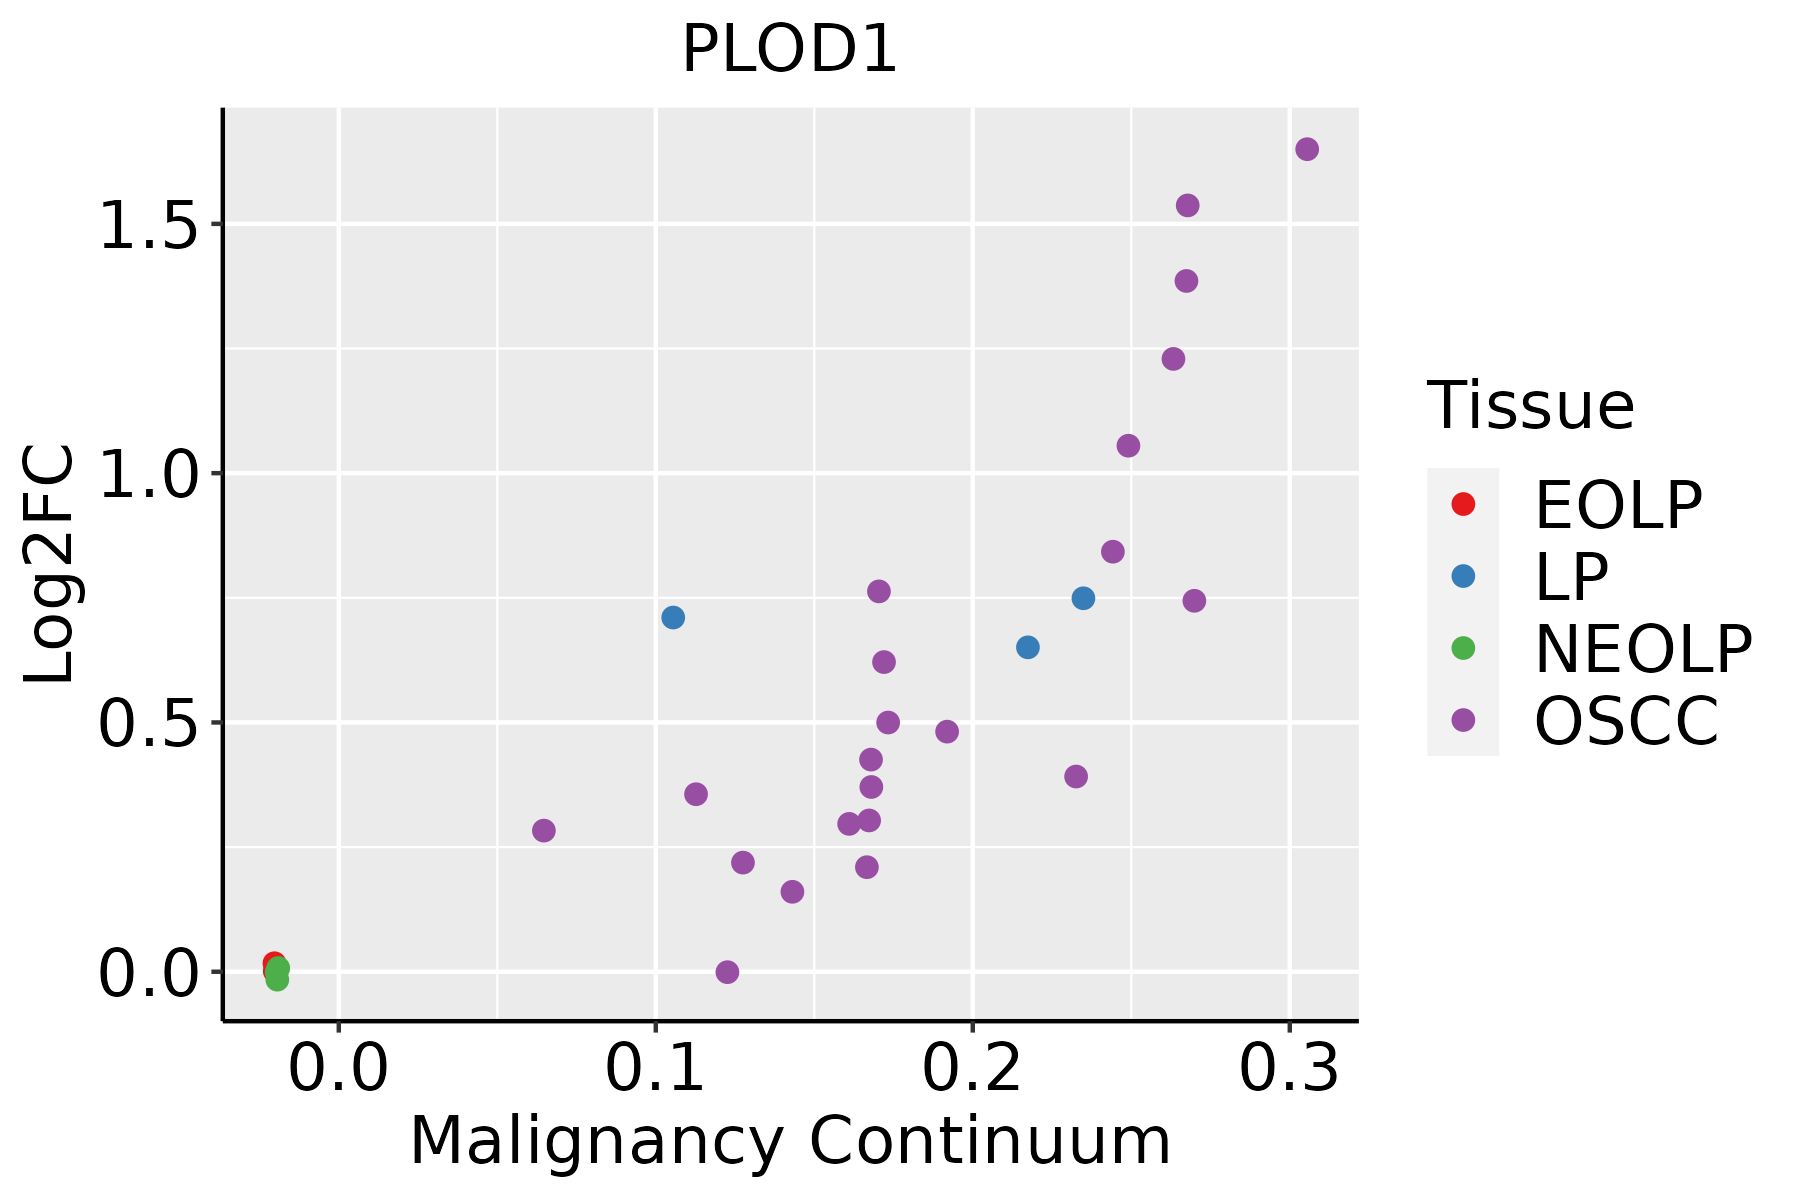 | EOLP: Erosive Oral lichen planus |
| LP: leukoplakia | ||
| NEOLP: Non-erosive oral lichen planus | ||
| OSCC: Oral squamous cell carcinoma | ||
| Skin | 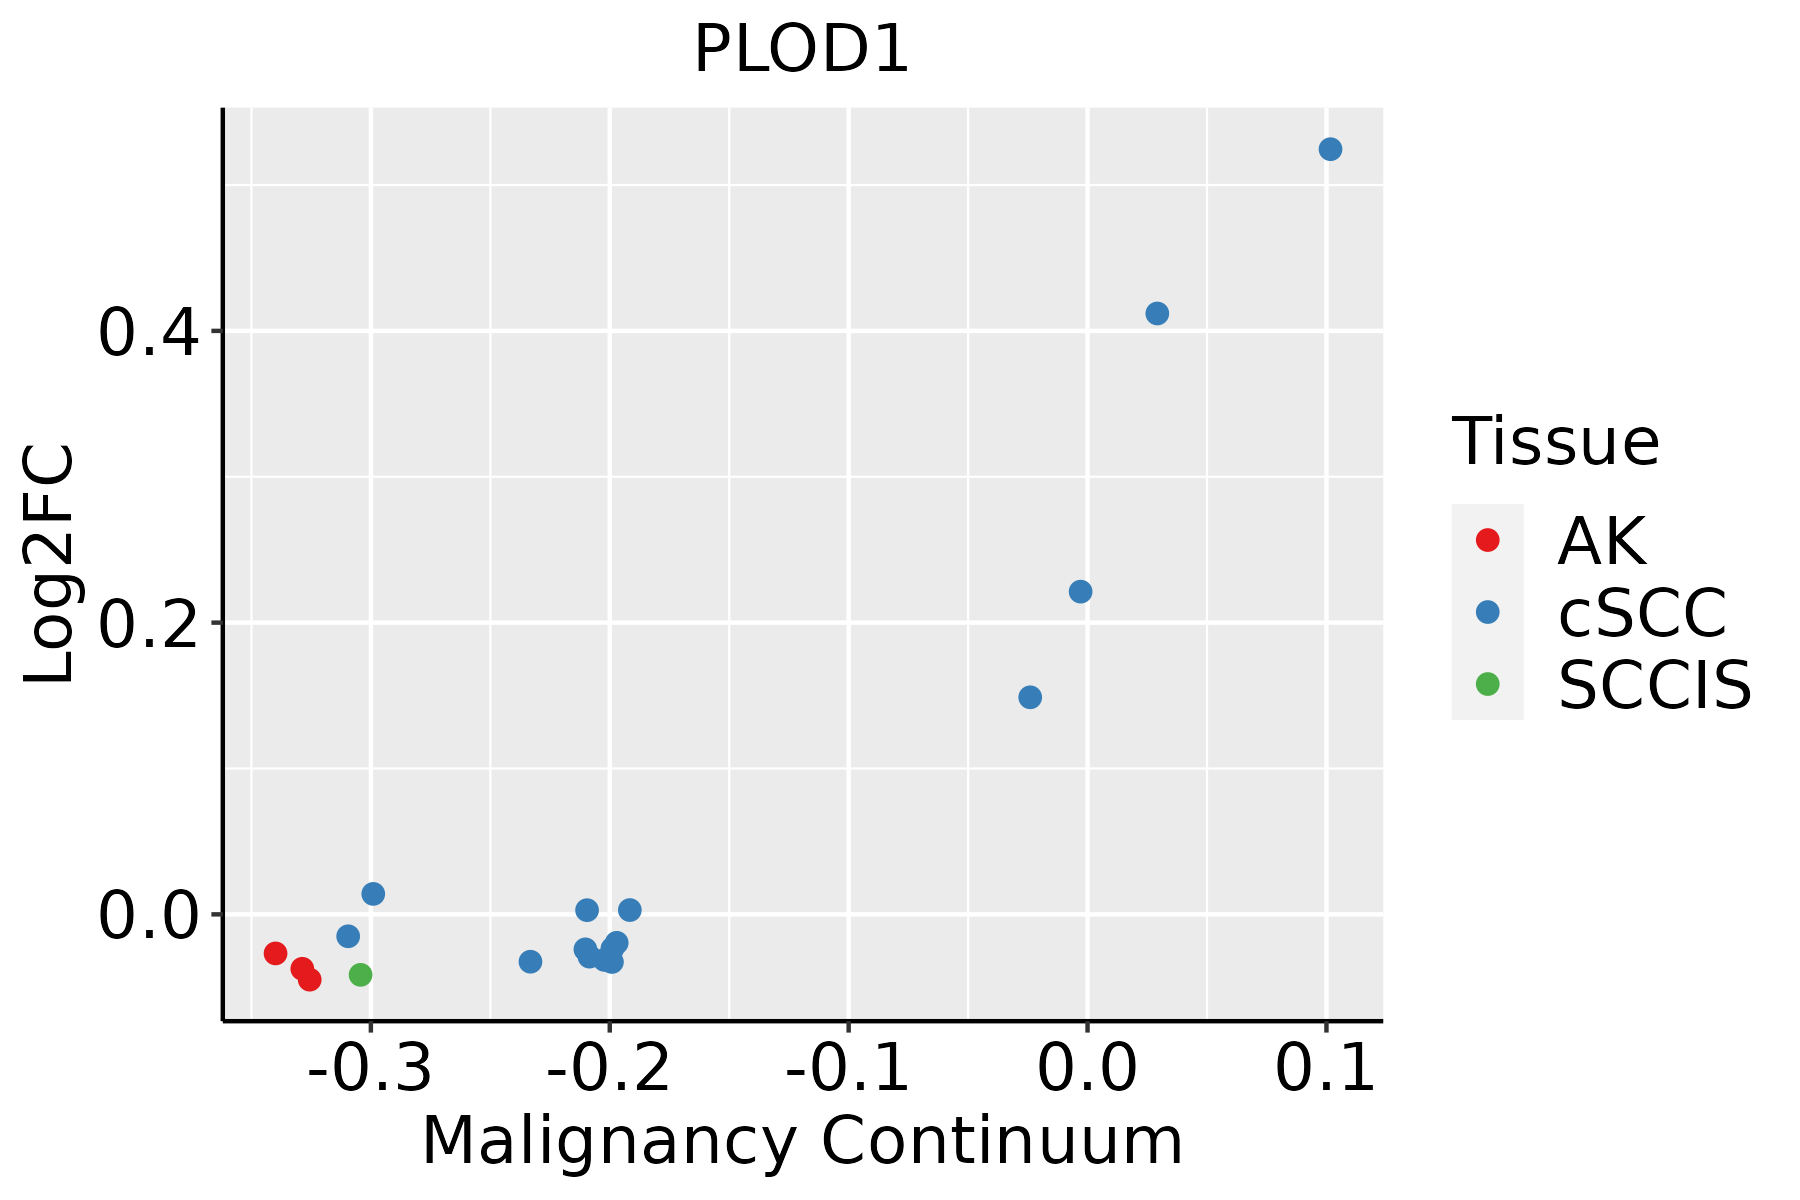 | AK: Actinic keratosis |
| cSCC: Cutaneous squamous cell carcinoma | ||
| SCCIS:squamous cell carcinoma in situ | ||
| Thyroid | 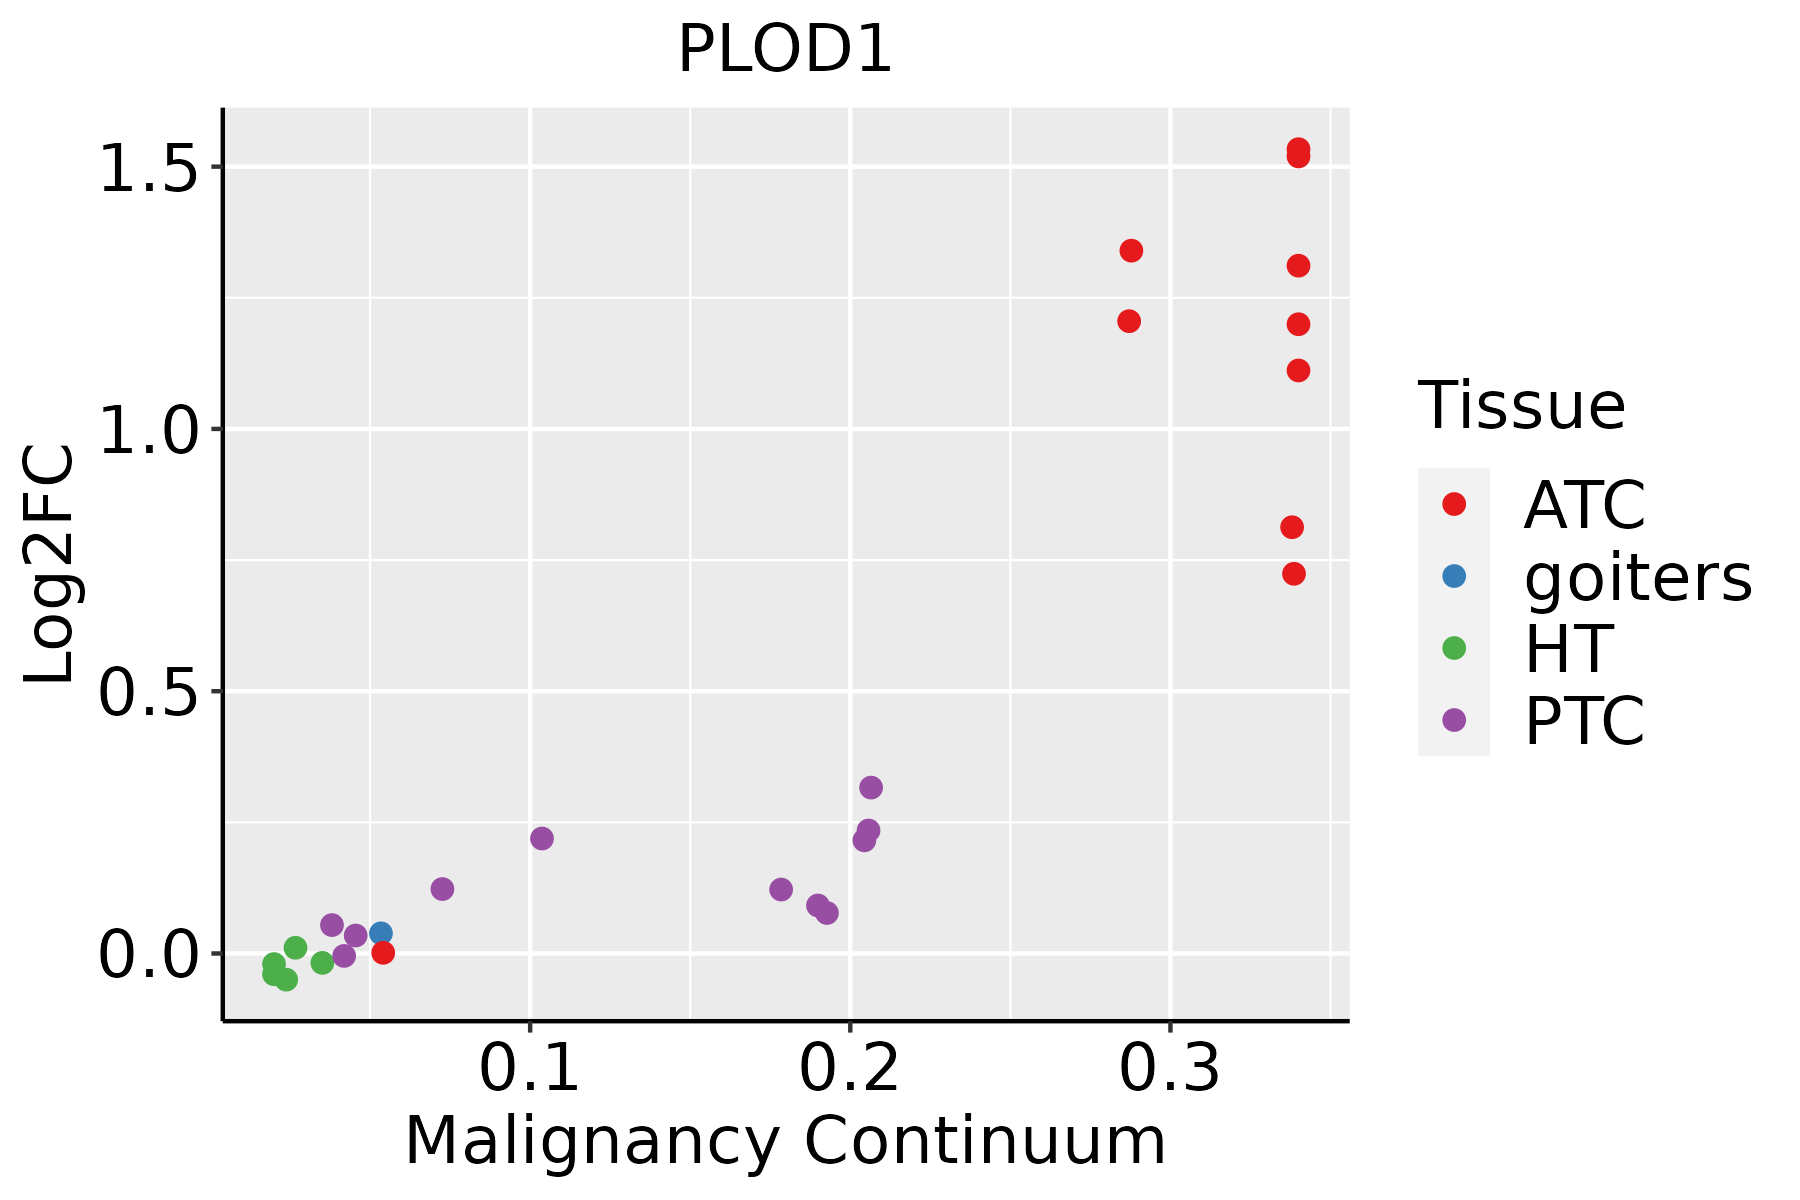 | ATC: Anaplastic thyroid cancer |
| HT: Hashimoto's thyroiditis | ||
| PTC: Papillary thyroid cancer |
| ∗log2FC in expression of this searched gene in stem-like cells from each diseased tissue sample relative to stem-like cells in normal samples in each tissue plotted against the malignancy continuum. Samples are colored based on if they are from different disease stage. |
Top |
Malignant transformation related pathway analysis |
| Find out the enriched GO biological processes and KEGG pathways involved in transition from healthy to precancer to cancer |
| Tissue | Disease Stage | Enriched GO biological Processes |
| Colorectum | AD |  |
| Colorectum | SER |  |
| Colorectum | MSS |  |
| Colorectum | MSI-H |  |
| Colorectum | FAP |  |
| ∗Top 15 enriched GO BP terms are showed in the bar plot of each disease state in each tissue. Each row represents a significant GO biological process which is colored according to the -log10(p.adjust). |
| Page: 1 2 3 4 5 6 7 8 9 |
| GO ID | Tissue | Disease Stage | Description | Gene Ratio | Bg Ratio | pvalue | p.adjust | Count |
| GO:00182057 | Esophagus | HGIN | peptidyl-lysine modification | 88/2587 | 376/18723 | 2.99e-07 | 1.39e-05 | 88 |
| GO:007048220 | Esophagus | HGIN | response to oxygen levels | 76/2587 | 347/18723 | 2.36e-05 | 6.25e-04 | 76 |
| GO:003629320 | Esophagus | HGIN | response to decreased oxygen levels | 70/2587 | 322/18723 | 6.23e-05 | 1.44e-03 | 70 |
| GO:000166620 | Esophagus | HGIN | response to hypoxia | 67/2587 | 307/18723 | 7.82e-05 | 1.75e-03 | 67 |
| GO:001820514 | Esophagus | ESCC | peptidyl-lysine modification | 259/8552 | 376/18723 | 3.90e-20 | 5.26e-18 | 259 |
| GO:0070482111 | Esophagus | ESCC | response to oxygen levels | 218/8552 | 347/18723 | 6.91e-11 | 2.17e-09 | 218 |
| GO:0036293111 | Esophagus | ESCC | response to decreased oxygen levels | 201/8552 | 322/18723 | 8.37e-10 | 2.04e-08 | 201 |
| GO:0001666111 | Esophagus | ESCC | response to hypoxia | 192/8552 | 307/18723 | 1.59e-09 | 3.69e-08 | 192 |
| GO:000854410 | Esophagus | ESCC | epidermis development | 193/8552 | 324/18723 | 2.87e-07 | 4.19e-06 | 193 |
| GO:00181263 | Esophagus | ESCC | protein hydroxylation | 23/8552 | 27/18723 | 2.60e-05 | 2.19e-04 | 23 |
| GO:00182051 | Liver | Cirrhotic | peptidyl-lysine modification | 134/4634 | 376/18723 | 1.29e-06 | 2.59e-05 | 134 |
| GO:00704827 | Liver | Cirrhotic | response to oxygen levels | 125/4634 | 347/18723 | 1.55e-06 | 3.02e-05 | 125 |
| GO:00362937 | Liver | Cirrhotic | response to decreased oxygen levels | 113/4634 | 322/18723 | 1.87e-05 | 2.52e-04 | 113 |
| GO:00016667 | Liver | Cirrhotic | response to hypoxia | 108/4634 | 307/18723 | 2.51e-05 | 3.26e-04 | 108 |
| GO:00182052 | Liver | HCC | peptidyl-lysine modification | 230/7958 | 376/18723 | 1.51e-13 | 8.32e-12 | 230 |
| GO:000166612 | Liver | HCC | response to hypoxia | 172/7958 | 307/18723 | 1.06e-06 | 1.59e-05 | 172 |
| GO:003629312 | Liver | HCC | response to decreased oxygen levels | 179/7958 | 322/18723 | 1.29e-06 | 1.87e-05 | 179 |
| GO:007048212 | Liver | HCC | response to oxygen levels | 191/7958 | 347/18723 | 1.42e-06 | 2.03e-05 | 191 |
| GO:0018126 | Liver | HCC | protein hydroxylation | 18/7958 | 27/18723 | 9.75e-03 | 3.66e-02 | 18 |
| GO:00182056 | Oral cavity | OSCC | peptidyl-lysine modification | 216/7305 | 376/18723 | 2.32e-13 | 1.16e-11 | 216 |
| Page: 1 2 3 |
| Pathway ID | Tissue | Disease Stage | Description | Gene Ratio | Bg Ratio | pvalue | p.adjust | qvalue | Count |
| hsa0031010 | Esophagus | ESCC | Lysine degradation | 41/4205 | 63/8465 | 9.63e-03 | 2.27e-02 | 1.16e-02 | 41 |
| hsa0031013 | Esophagus | ESCC | Lysine degradation | 41/4205 | 63/8465 | 9.63e-03 | 2.27e-02 | 1.16e-02 | 41 |
| hsa0031041 | Liver | HCC | Lysine degradation | 47/4020 | 63/8465 | 1.02e-05 | 7.58e-05 | 4.22e-05 | 47 |
| hsa0031051 | Liver | HCC | Lysine degradation | 47/4020 | 63/8465 | 1.02e-05 | 7.58e-05 | 4.22e-05 | 47 |
| Page: 1 |
Top |
Cell-cell communication analysis |
| Identification of potential cell-cell interactions between two cell types and their ligand-receptor pairs for different disease states |
| Ligand | Receptor | LRpair | Pathway | Tissue | Disease Stage |
| Page: 1 |
Top |
Single-cell gene regulatory network inference analysis |
| Find out the significant the regulons (TFs) and the target genes of each regulon across cell types for different disease states |
| TF | Cell Type | Tissue | Disease Stage | Target Gene | RSS | Regulon Activity |
| ∗The dot plots of a searched regulon are shown for all cell subpopulations in each disease state of each tissue based on the regulon specific score inferred using pySCENIC and by calculating the average expression. |
| Page: 1 |
Top |
Somatic mutation of malignant transformation related genes |
| Annotation of somatic variants for genes involved in malignant transformation |
| Hugo Symbol | Variant Class | Variant Classification | dbSNP RS | HGVSc | HGVSp | HGVSp Short | SWISSPROT | BIOTYPE | SIFT | PolyPhen | Tumor Sample Barcode | Tissue | Histology | Sex | Age | Stage | Therapy Types | Drugs | Outcome |
| PLOD1 | SNV | Missense_Mutation | rs377406897 | c.2114N>T | p.Thr705Met | p.T705M | Q02809 | protein_coding | deleterious(0) | probably_damaging(0.999) | TCGA-AN-A0AK-01 | Breast | breast invasive carcinoma | Female | >=65 | I/II | Unknown | Unknown | SD |
| PLOD1 | SNV | Missense_Mutation | rs760314787 | c.1871N>T | p.Thr624Met | p.T624M | Q02809 | protein_coding | deleterious(0) | possibly_damaging(0.53) | TCGA-EW-A1IZ-01 | Breast | breast invasive carcinoma | Female | <65 | III/IV | Chemotherapy | taxotere | SD |
| PLOD1 | SNV | Missense_Mutation | c.1825N>C | p.Glu609Gln | p.E609Q | Q02809 | protein_coding | deleterious(0.02) | probably_damaging(0.995) | TCGA-EW-A1J5-01 | Breast | breast invasive carcinoma | Female | <65 | I/II | Chemotherapy | adriamycin | SD | |
| PLOD1 | insertion | Frame_Shift_Ins | novel | c.133_134insGAGCCTCAAGCATGGTGTTGGGAGAATCT | p.Lys45ArgfsTer26 | p.K45Rfs*26 | Q02809 | protein_coding | TCGA-A2-A0EX-01 | Breast | breast invasive carcinoma | Female | <65 | I/II | Hormone Therapy | tamoxiphen | SD | ||
| PLOD1 | insertion | In_Frame_Ins | novel | c.1276_1277insCCTTCCCCATCCCCAACCCCAGGAGCA | p.Gly426delinsAlaPheProIleProAsnProArgSerSer | p.G426delinsAFPIPNPRSS | Q02809 | protein_coding | TCGA-A8-A079-01 | Breast | breast invasive carcinoma | Female | >=65 | III/IV | Chemotherapy | 5-fluorouracil | SD | ||
| PLOD1 | SNV | Missense_Mutation | rs199990859 | c.613C>T | p.Arg205Cys | p.R205C | Q02809 | protein_coding | deleterious(0) | possibly_damaging(0.694) | TCGA-2W-A8YY-01 | Cervix | cervical & endocervical cancer | Female | <65 | I/II | Chemotherapy | cisplatin | CR |
| PLOD1 | SNV | Missense_Mutation | c.187N>A | p.Asp63Asn | p.D63N | Q02809 | protein_coding | deleterious(0.03) | benign(0.034) | TCGA-FU-A3NI-01 | Cervix | cervical & endocervical cancer | Female | <65 | I/II | Unknown | Unknown | SD | |
| PLOD1 | SNV | Missense_Mutation | novel | c.1992N>G | p.Ile664Met | p.I664M | Q02809 | protein_coding | deleterious(0.04) | benign(0.319) | TCGA-HM-A4S6-01 | Cervix | cervical & endocervical cancer | Female | <65 | III/IV | Chemotherapy | cisplatin | CR |
| PLOD1 | SNV | Missense_Mutation | rs199567720 | c.1325N>A | p.Arg442His | p.R442H | Q02809 | protein_coding | deleterious(0) | probably_damaging(0.997) | TCGA-5M-AAT6-01 | Colorectum | colon adenocarcinoma | Female | <65 | III/IV | Unknown | Unknown | PD |
| PLOD1 | SNV | Missense_Mutation | c.676N>A | p.Val226Met | p.V226M | Q02809 | protein_coding | deleterious(0.01) | probably_damaging(0.968) | TCGA-AA-3672-01 | Colorectum | colon adenocarcinoma | Female | >=65 | III/IV | Unknown | Unknown | SD |
| Page: 1 2 3 4 5 6 7 |
Top |
Related drugs of malignant transformation related genes |
| Identification of chemicals and drugs interact with genes involved in malignant transfromation |
| (DGIdb 4.0) |
| Entrez ID | Symbol | Category | Interaction Types | Drug Claim Name | Drug Name | PMIDs |
| 5351 | PLOD1 | ENZYME, DRUGGABLE GENOME | Ascorbate |
| Page: 1 |

Copyright 2023-Present -The University of Texas Health Science Center at Houston |