| Tissue | Expression Dynamics | Abbreviation |
| Esophagus | 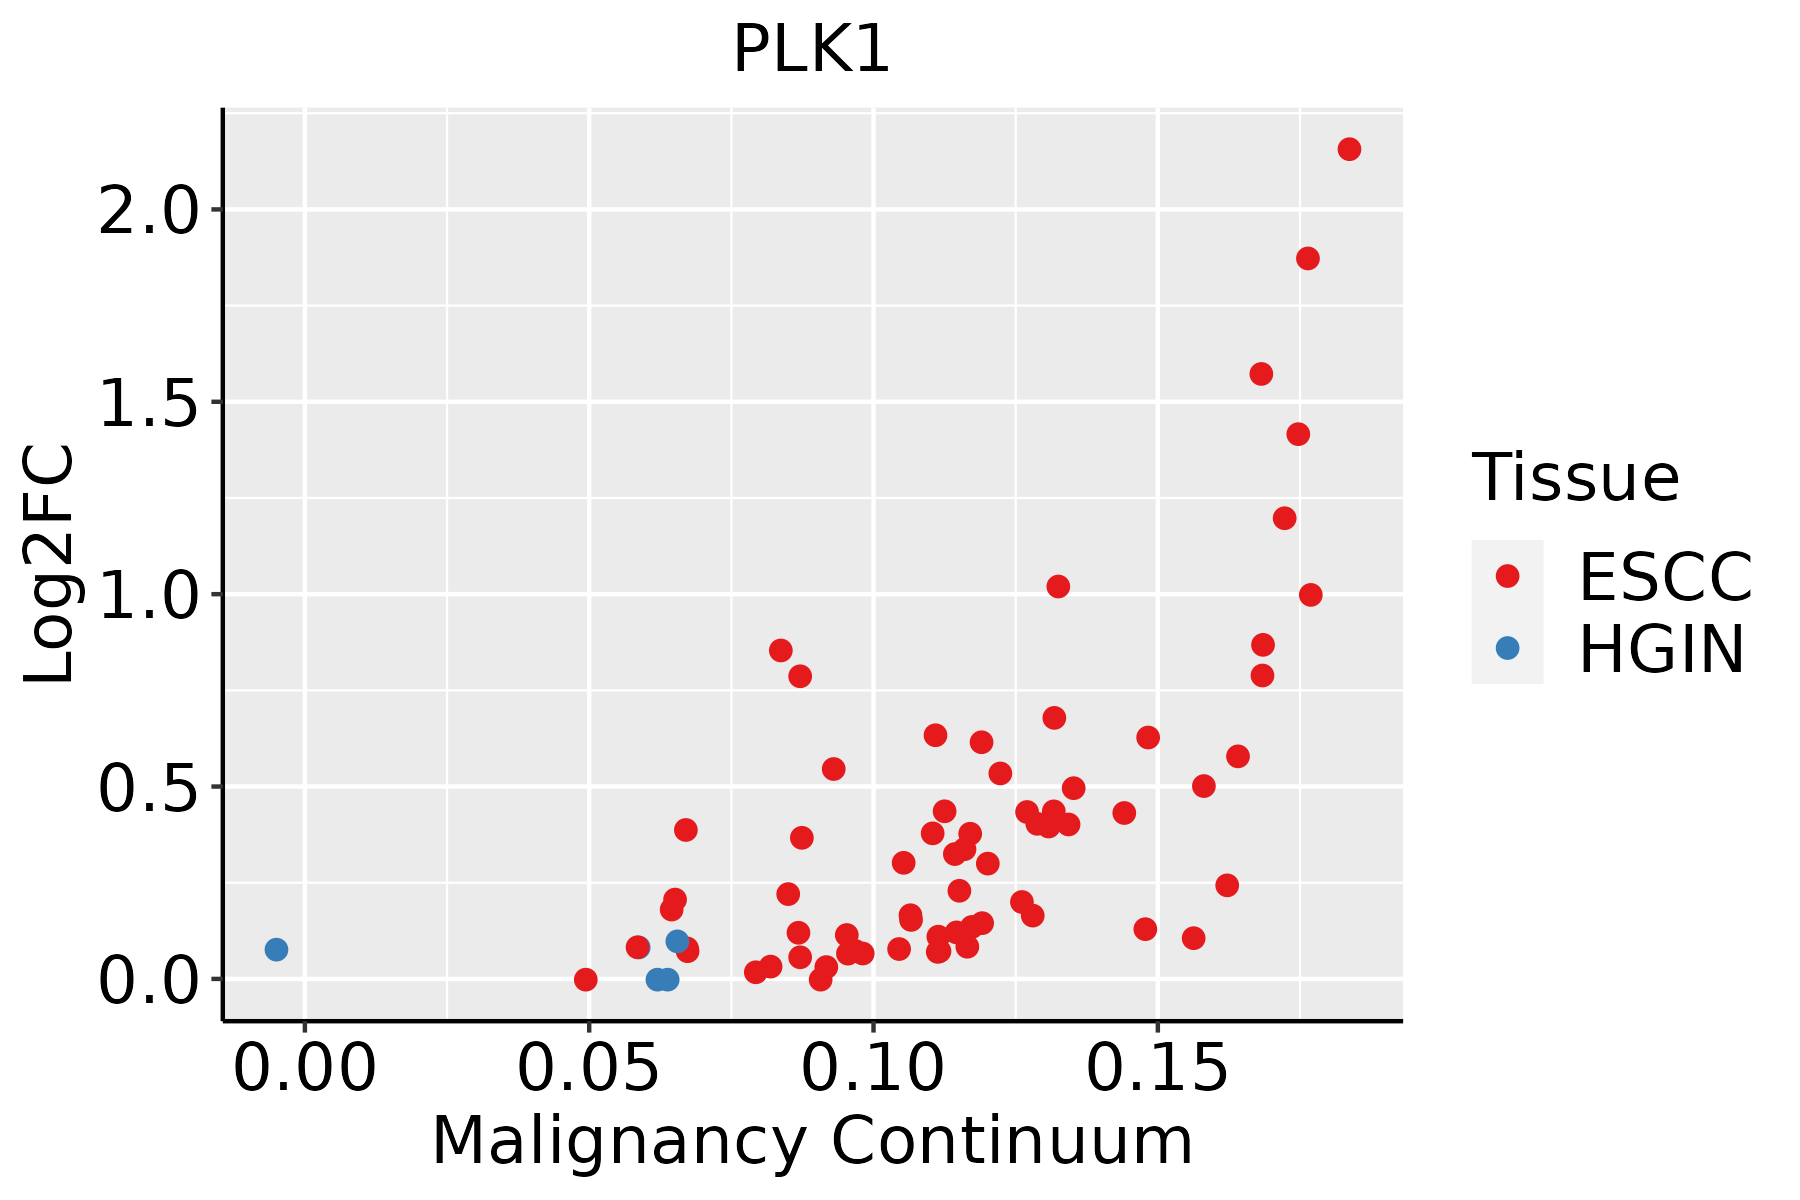 | ESCC: Esophageal squamous cell carcinoma |
| HGIN: High-grade intraepithelial neoplasias |
| LGIN: Low-grade intraepithelial neoplasias |
| Liver |  | HCC: Hepatocellular carcinoma |
| NAFLD: Non-alcoholic fatty liver disease |
| Oral Cavity | 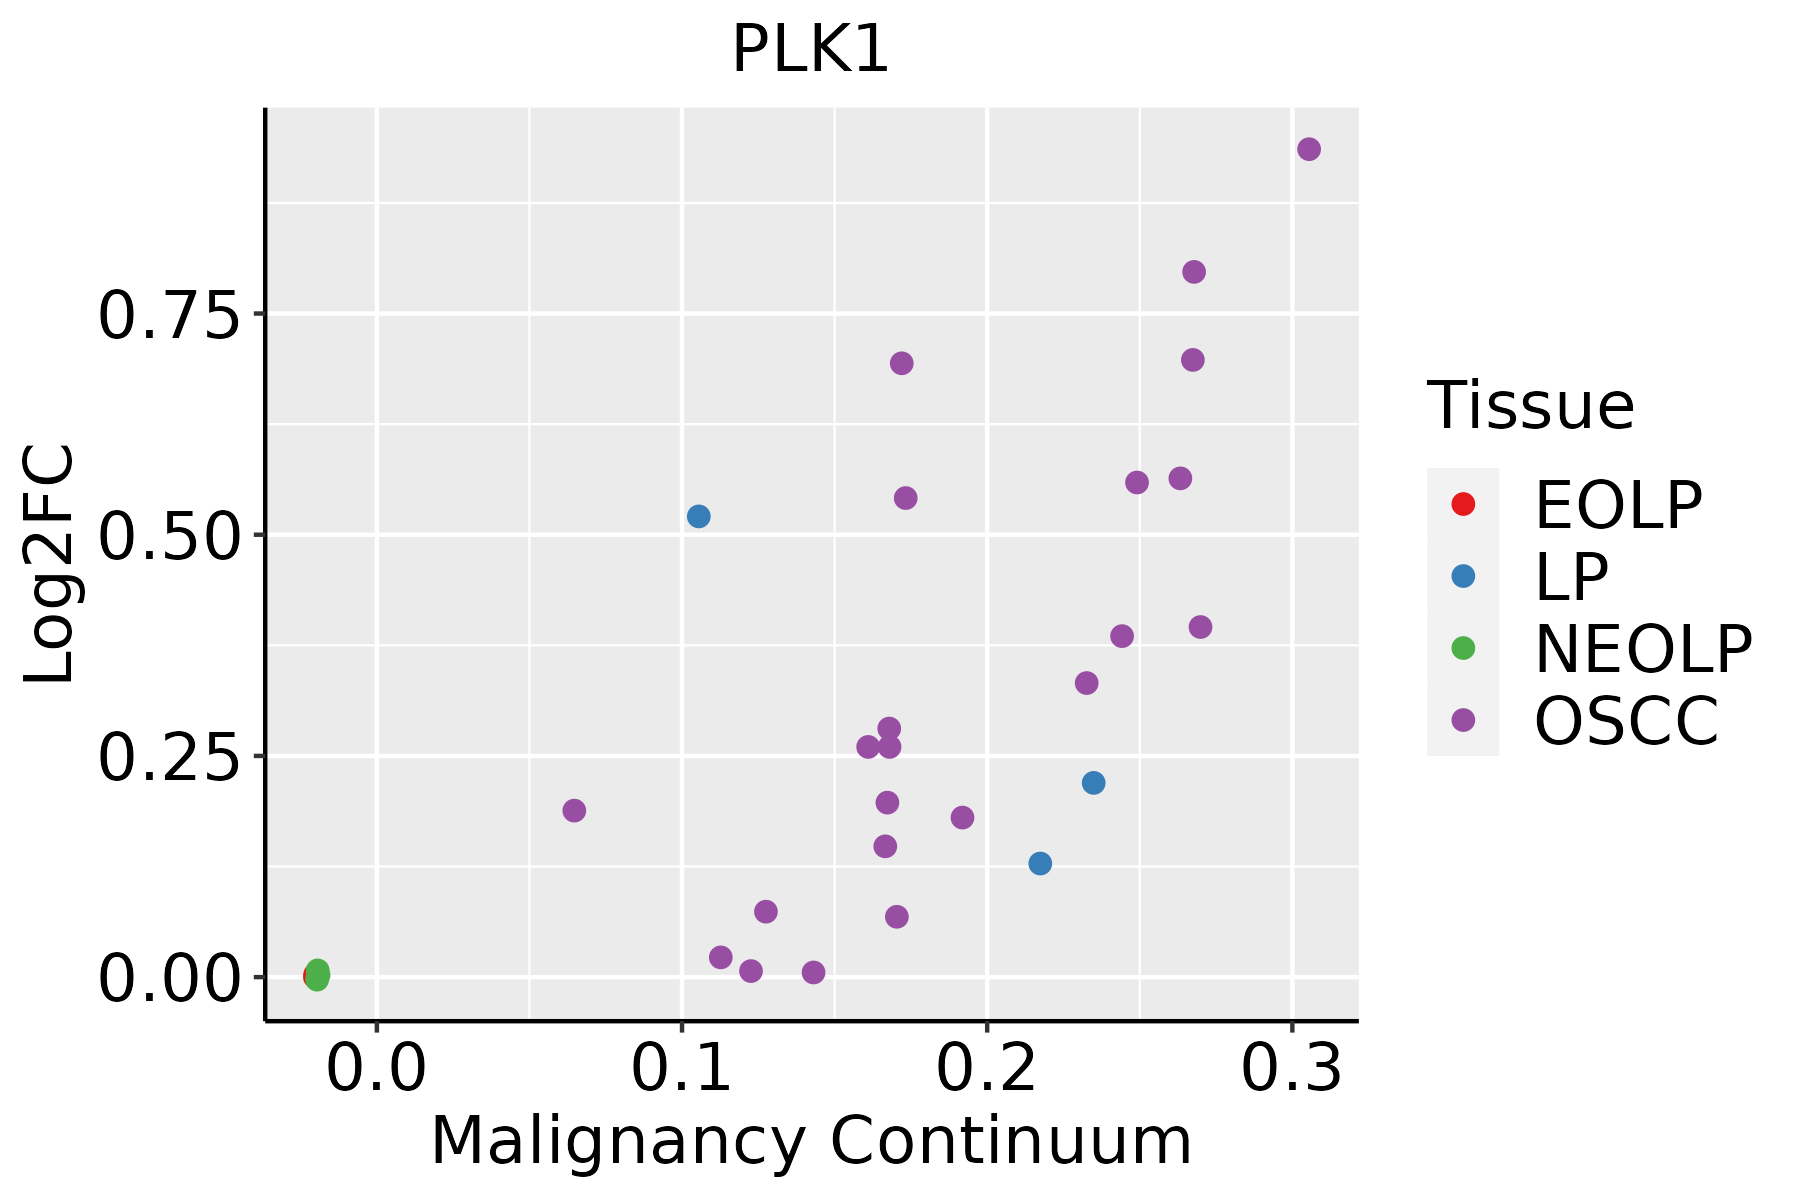 | EOLP: Erosive Oral lichen planus |
| LP: leukoplakia |
| NEOLP: Non-erosive oral lichen planus |
| OSCC: Oral squamous cell carcinoma |
| Skin | 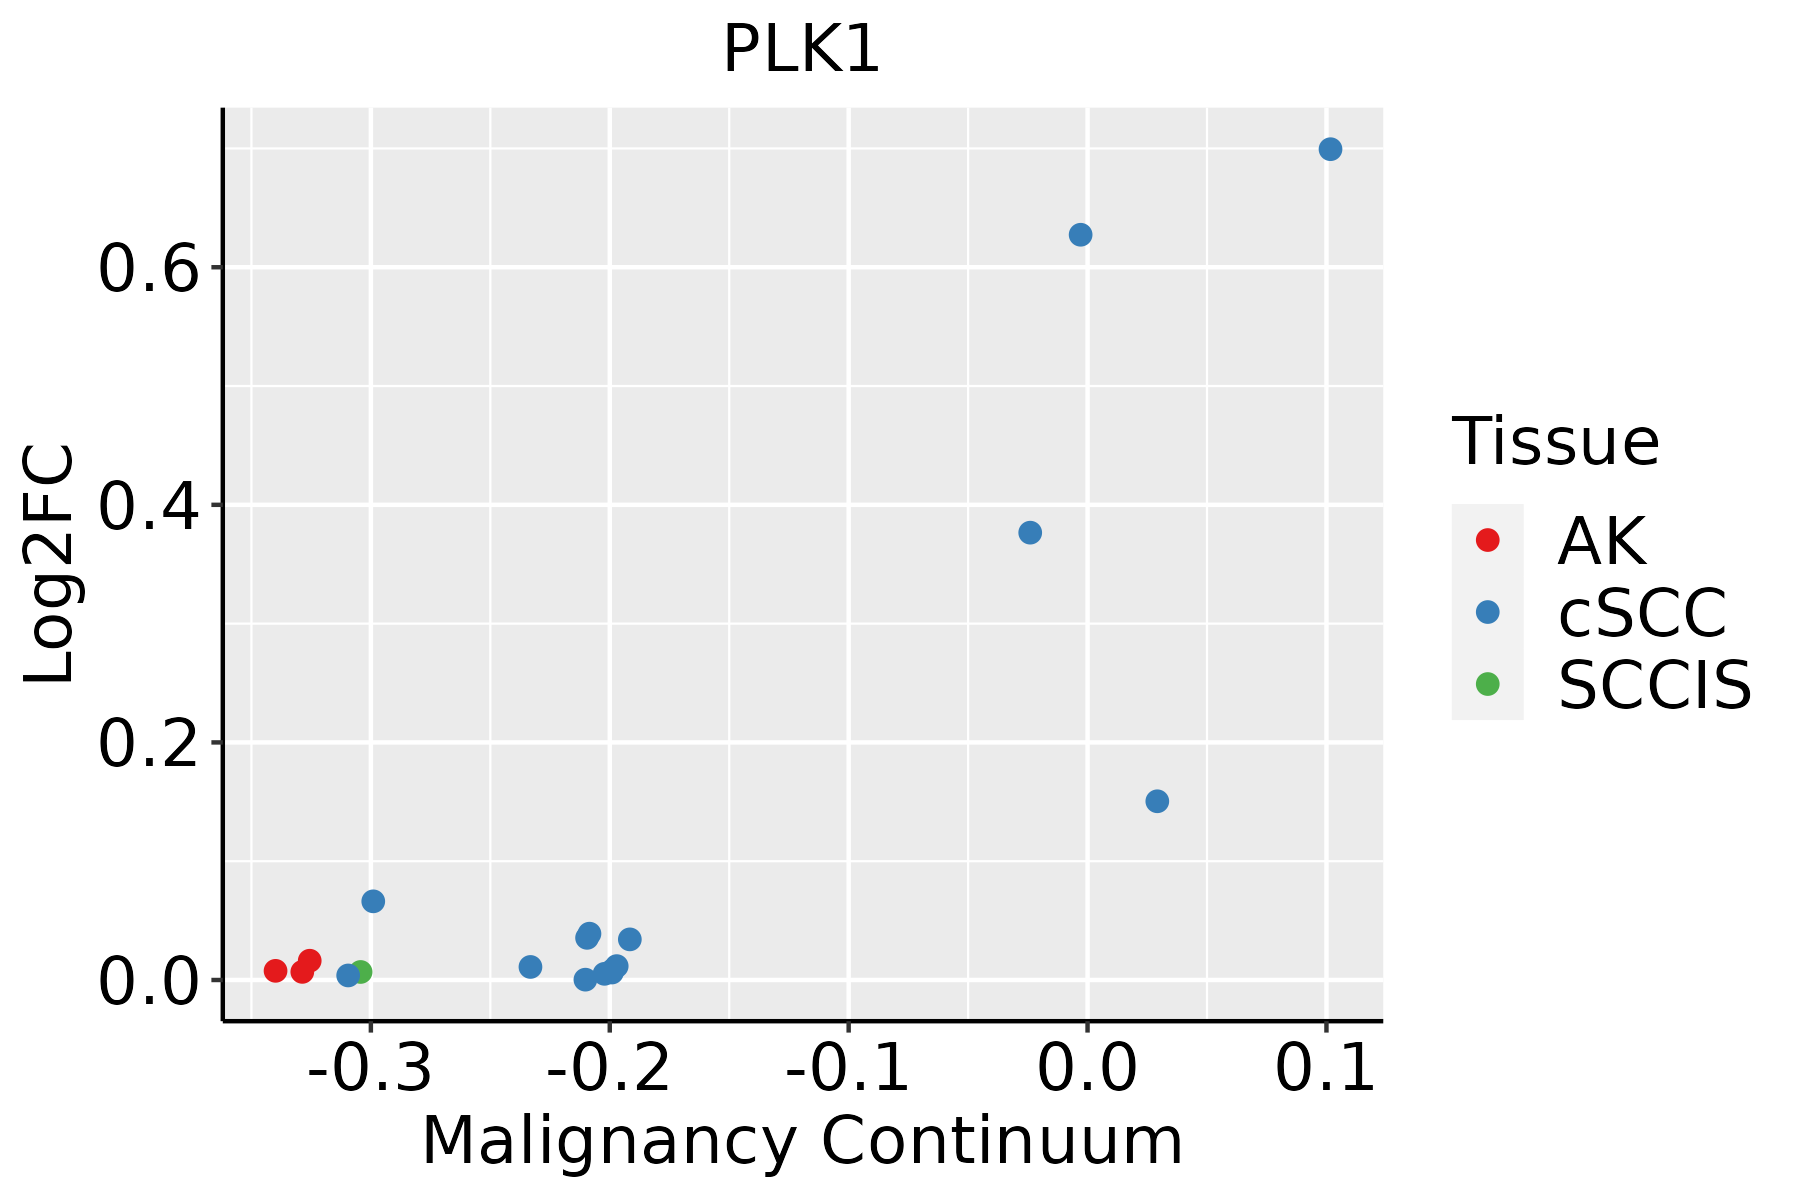 | AK: Actinic keratosis |
| cSCC: Cutaneous squamous cell carcinoma |
| SCCIS:squamous cell carcinoma in situ |
| Thyroid | 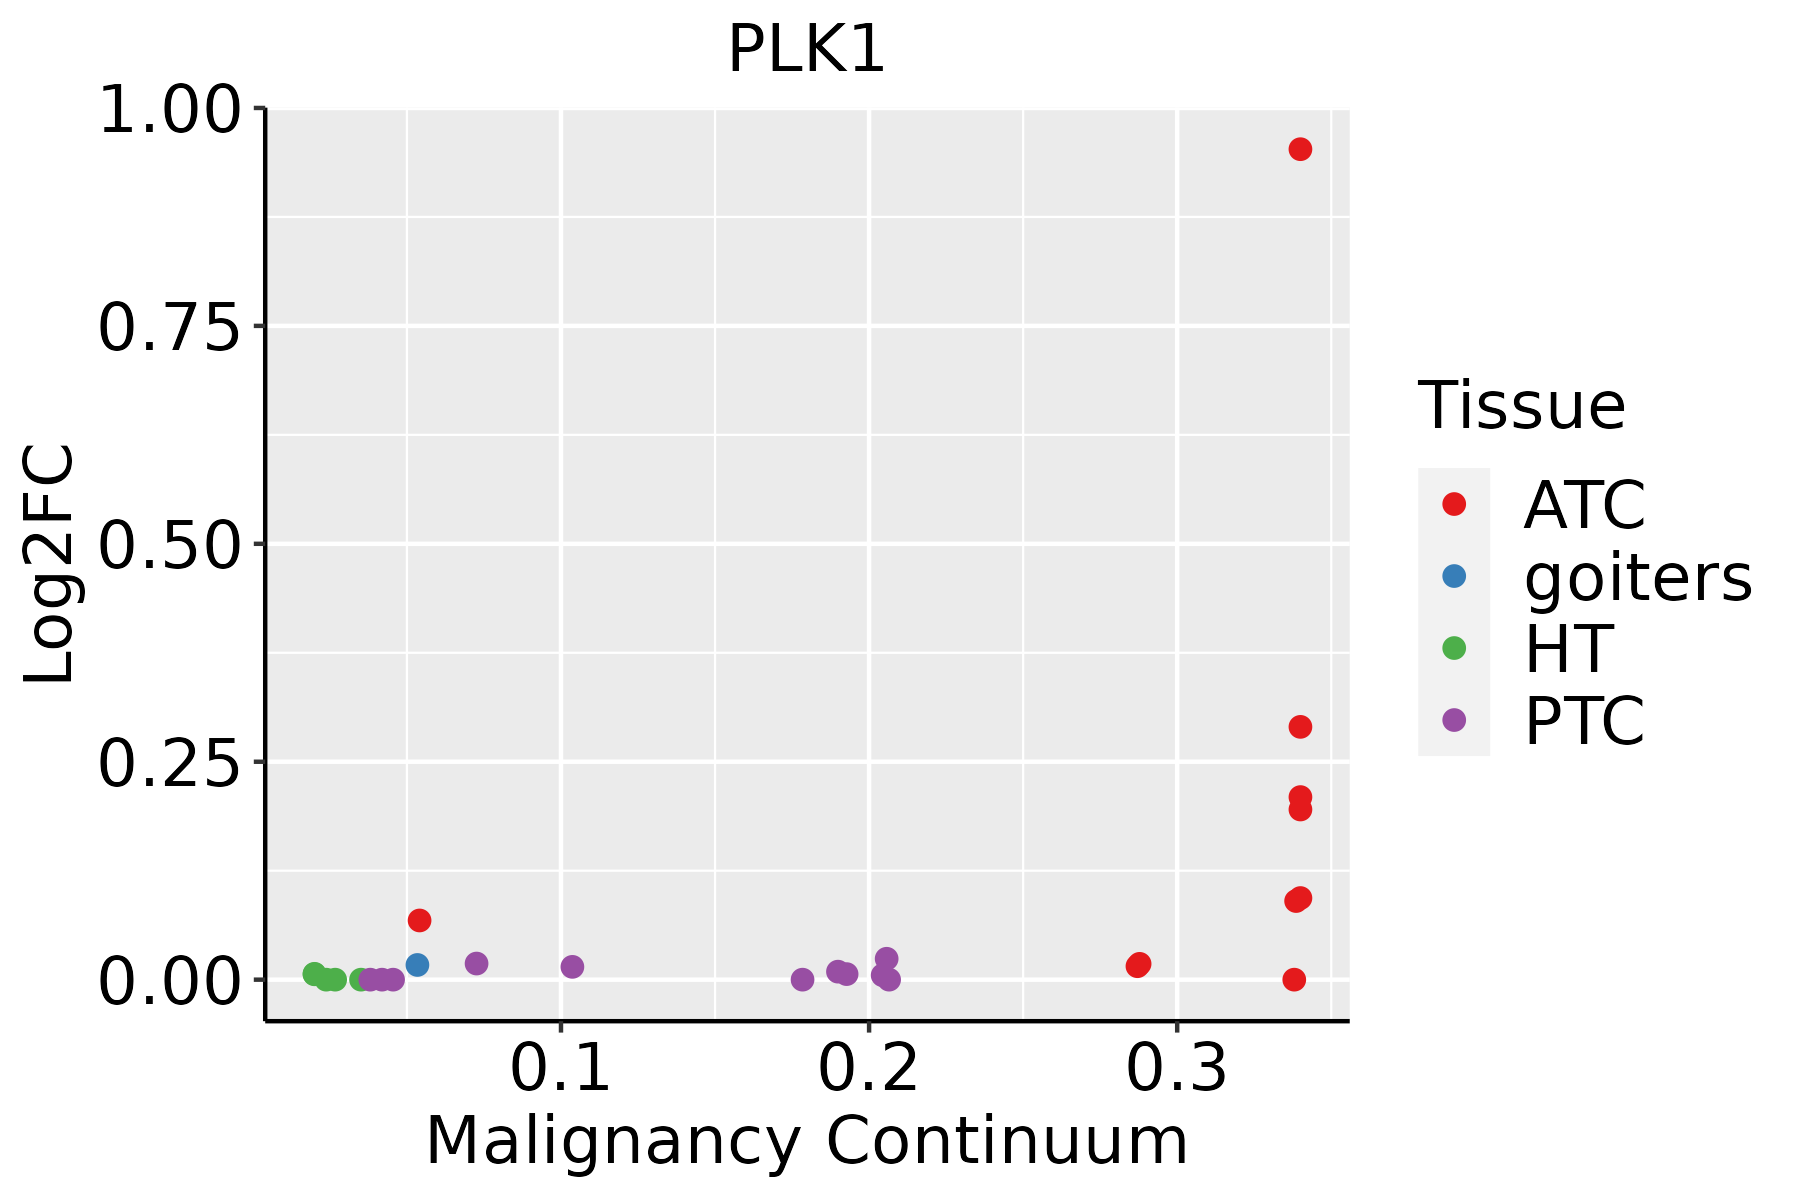 | ATC: Anaplastic thyroid cancer |
| HT: Hashimoto's thyroiditis |
| PTC: Papillary thyroid cancer |
| GO ID | Tissue | Disease Stage | Description | Gene Ratio | Bg Ratio | pvalue | p.adjust | Count |
| GO:0010498111 | Esophagus | ESCC | proteasomal protein catabolic process | 369/8552 | 490/18723 | 1.13e-41 | 1.80e-38 | 369 |
| GO:0043161111 | Esophagus | ESCC | proteasome-mediated ubiquitin-dependent protein catabolic process | 312/8552 | 412/18723 | 3.53e-36 | 4.48e-33 | 312 |
| GO:014001414 | Esophagus | ESCC | mitotic nuclear division | 218/8552 | 287/18723 | 6.17e-26 | 1.78e-23 | 218 |
| GO:0042176111 | Esophagus | ESCC | regulation of protein catabolic process | 280/8552 | 391/18723 | 8.65e-26 | 2.39e-23 | 280 |
| GO:0031647111 | Esophagus | ESCC | regulation of protein stability | 223/8552 | 298/18723 | 5.76e-25 | 1.52e-22 | 223 |
| GO:0022411111 | Esophagus | ESCC | cellular component disassembly | 305/8552 | 443/18723 | 1.94e-23 | 4.57e-21 | 305 |
| GO:0009896111 | Esophagus | ESCC | positive regulation of catabolic process | 332/8552 | 492/18723 | 4.36e-23 | 9.22e-21 | 332 |
| GO:005165617 | Esophagus | ESCC | establishment of organelle localization | 273/8552 | 390/18723 | 9.13e-23 | 1.81e-20 | 273 |
| GO:000007011 | Esophagus | ESCC | mitotic sister chromatid segregation | 138/8552 | 168/18723 | 1.37e-22 | 2.63e-20 | 138 |
| GO:0031331111 | Esophagus | ESCC | positive regulation of cellular catabolic process | 292/8552 | 427/18723 | 8.67e-22 | 1.53e-19 | 292 |
| GO:003450418 | Esophagus | ESCC | protein localization to nucleus | 211/8552 | 290/18723 | 4.06e-21 | 6.60e-19 | 211 |
| GO:00008194 | Esophagus | ESCC | sister chromatid segregation | 157/8552 | 202/18723 | 8.41e-21 | 1.33e-18 | 157 |
| GO:1903320111 | Esophagus | ESCC | regulation of protein modification by small protein conjugation or removal | 181/8552 | 242/18723 | 1.80e-20 | 2.60e-18 | 181 |
| GO:1903362111 | Esophagus | ESCC | regulation of cellular protein catabolic process | 188/8552 | 255/18723 | 5.12e-20 | 6.62e-18 | 188 |
| GO:0051098111 | Esophagus | ESCC | regulation of binding | 251/8552 | 363/18723 | 6.73e-20 | 8.46e-18 | 251 |
| GO:0045862111 | Esophagus | ESCC | positive regulation of proteolysis | 256/8552 | 372/18723 | 7.88e-20 | 9.43e-18 | 256 |
| GO:1903829111 | Esophagus | ESCC | positive regulation of cellular protein localization | 199/8552 | 276/18723 | 2.99e-19 | 3.45e-17 | 199 |
| GO:003304416 | Esophagus | ESCC | regulation of chromosome organization | 145/8552 | 187/18723 | 3.80e-19 | 4.31e-17 | 145 |
| GO:000705911 | Esophagus | ESCC | chromosome segregation | 238/8552 | 346/18723 | 1.72e-18 | 1.82e-16 | 238 |
| GO:004477216 | Esophagus | ESCC | mitotic cell cycle phase transition | 281/8552 | 424/18723 | 4.63e-18 | 4.45e-16 | 281 |
| Hugo Symbol | Variant Class | Variant Classification | dbSNP RS | HGVSc | HGVSp | HGVSp Short | SWISSPROT | BIOTYPE | SIFT | PolyPhen | Tumor Sample Barcode | Tissue | Histology | Sex | Age | Stage | Therapy Types | Drugs | Outcome |
| PLK1 | SNV | Missense_Mutation | | c.732G>C | p.Leu244Phe | p.L244F | P53350 | protein_coding | deleterious(0) | probably_damaging(0.998) | TCGA-A8-A094-01 | Breast | breast invasive carcinoma | Female | >=65 | I/II | Unknown | Unknown | SD |
| PLK1 | SNV | Missense_Mutation | | c.658C>G | p.Pro220Ala | p.P220A | P53350 | protein_coding | deleterious(0.01) | probably_damaging(1) | TCGA-A8-A09G-01 | Breast | breast invasive carcinoma | Female | >=65 | III/IV | Unknown | Unknown | SD |
| PLK1 | SNV | Missense_Mutation | novel | c.1729G>C | p.Ala577Pro | p.A577P | P53350 | protein_coding | tolerated(0.19) | probably_damaging(0.937) | TCGA-AR-A1AP-01 | Breast | breast invasive carcinoma | Female | >=65 | I/II | Hormone Therapy | anastrozole | SD |
| PLK1 | insertion | Frame_Shift_Ins | novel | c.751_752insCATACGTCTTTGCAGTGGGGTTTTTTCAAATGAAAAC | p.Phe251SerfsTer14 | p.F251Sfs*14 | P53350 | protein_coding | | | TCGA-A2-A0CU-01 | Breast | breast invasive carcinoma | Female | >=65 | I/II | Hormone Therapy | tamoxiphen | SD |
| PLK1 | insertion | Nonsense_Mutation | novel | c.1150_1151insCAGTGGCGCGCAGGCTTTTGTAACGT | p.Val384AlafsTer8 | p.V384Afs*8 | P53350 | protein_coding | | | TCGA-A8-A0A6-01 | Breast | breast invasive carcinoma | Female | <65 | III/IV | Chemotherapy | epirubicin | CR |
| PLK1 | insertion | In_Frame_Ins | novel | c.694_695insACAGCATTTTCTTAGGGCAGCCCTTTGCTGGGC | p.Val232delinsAspSerIlePheLeuGlyGlnProPheAlaGlyLeu | p.V232delinsDSIFLGQPFAGL | P53350 | protein_coding | | | TCGA-AN-A03Y-01 | Breast | breast invasive carcinoma | Female | >=65 | I/II | Unknown | Unknown | SD |
| PLK1 | deletion | Frame_Shift_Del | novel | c.403delC | p.Arg135GlyfsTer14 | p.R135Gfs*14 | P53350 | protein_coding | | | TCGA-EW-A2FV-01 | Breast | breast invasive carcinoma | Female | <65 | III/IV | Chemotherapy | docetaxel | SD |
| PLK1 | SNV | Missense_Mutation | rs749527952 | c.977N>T | p.Ser326Leu | p.S326L | P53350 | protein_coding | tolerated(0.07) | benign(0.117) | TCGA-EA-A50E-01 | Cervix | cervical & endocervical cancer | Female | <65 | I/II | Unknown | Unknown | PD |
| PLK1 | SNV | Missense_Mutation | | c.1736G>A | p.Arg579Gln | p.R579Q | P53350 | protein_coding | deleterious(0.01) | probably_damaging(0.994) | TCGA-5M-AAT6-01 | Colorectum | colon adenocarcinoma | Female | <65 | III/IV | Unknown | Unknown | PD |
| PLK1 | SNV | Missense_Mutation | | c.596C>T | p.Thr199Ile | p.T199I | P53350 | protein_coding | deleterious(0) | probably_damaging(0.998) | TCGA-A6-6780-01 | Colorectum | colon adenocarcinoma | Male | >=65 | I/II | Unknown | Unknown | SD |
| Entrez ID | Symbol | Category | Interaction Types | Drug Claim Name | Drug Name | PMIDs |
| 5347 | PLK1 | TRANSCRIPTION FACTOR, KINASE, TUMOR SUPPRESSOR, SERINE THREONINE KINASE, ENZYME, DRUGGABLE GENOME | | DNDI1417055 | CHEMBL1486366 | |
| 5347 | PLK1 | TRANSCRIPTION FACTOR, KINASE, TUMOR SUPPRESSOR, SERINE THREONINE KINASE, ENZYME, DRUGGABLE GENOME | | NSC-7387 | CHEMBL119878 | |
| 5347 | PLK1 | TRANSCRIPTION FACTOR, KINASE, TUMOR SUPPRESSOR, SERINE THREONINE KINASE, ENZYME, DRUGGABLE GENOME | | DNDI1417601 | CHEMBL1503729 | |
| 5347 | PLK1 | TRANSCRIPTION FACTOR, KINASE, TUMOR SUPPRESSOR, SERINE THREONINE KINASE, ENZYME, DRUGGABLE GENOME | | PLK-1 INHIBITOR | | |
| 5347 | PLK1 | TRANSCRIPTION FACTOR, KINASE, TUMOR SUPPRESSOR, SERINE THREONINE KINASE, ENZYME, DRUGGABLE GENOME | | LANSOPRAZOLE | LANSOPRAZOLE | |
| 5347 | PLK1 | TRANSCRIPTION FACTOR, KINASE, TUMOR SUPPRESSOR, SERINE THREONINE KINASE, ENZYME, DRUGGABLE GENOME | | 2-ANILINOPYRIDINE | CHEMBL555260 | |
| 5347 | PLK1 | TRANSCRIPTION FACTOR, KINASE, TUMOR SUPPRESSOR, SERINE THREONINE KINASE, ENZYME, DRUGGABLE GENOME | | SOTRASTAURIN | SOTRASTAURIN | |
| 5347 | PLK1 | TRANSCRIPTION FACTOR, KINASE, TUMOR SUPPRESSOR, SERINE THREONINE KINASE, ENZYME, DRUGGABLE GENOME | | DNDI1417400 | CHEMBL1362503 | |
| 5347 | PLK1 | TRANSCRIPTION FACTOR, KINASE, TUMOR SUPPRESSOR, SERINE THREONINE KINASE, ENZYME, DRUGGABLE GENOME | | PRODINE HYDROCHLORIDE | ALPHAPRODINE HYDROCHLORIDE | |
| 5347 | PLK1 | TRANSCRIPTION FACTOR, KINASE, TUMOR SUPPRESSOR, SERINE THREONINE KINASE, ENZYME, DRUGGABLE GENOME | | GW843682X | GW843682X | |


