
|
|||||
|
 | |
| |
| |
| |
| |
| |
|
Gene: PLIN3 |
Gene summary for PLIN3 |
| Gene information | Species | Human | Gene symbol | PLIN3 | Gene ID | 10226 |
| Gene name | perilipin 3 | |
| Gene Alias | M6PRBP1 | |
| Cytomap | 19p13.3 | |
| Gene Type | protein-coding | GO ID | GO:0006810 | UniProtAcc | A0A140VJN8 |
Top |
Malignant transformation analysis |
| Identification of the aberrant gene expression in precancerous and cancerous lesions by comparing the gene expression of stem-like cells in diseased tissues with normal stem cells |
| Entrez ID | Symbol | Replicates | Species | Organ | Tissue | Adj P-value | Log2FC | Malignancy |
| 10226 | PLIN3 | LZE4T | Human | Esophagus | ESCC | 2.51e-08 | 2.54e-02 | 0.0811 |
| 10226 | PLIN3 | LZE7T | Human | Esophagus | ESCC | 2.45e-02 | -2.31e-01 | 0.0667 |
| 10226 | PLIN3 | LZE8T | Human | Esophagus | ESCC | 1.48e-14 | 9.27e-02 | 0.067 |
| 10226 | PLIN3 | LZE20T | Human | Esophagus | ESCC | 7.63e-03 | 6.76e-02 | 0.0662 |
| 10226 | PLIN3 | LZE24T | Human | Esophagus | ESCC | 1.99e-05 | 4.14e-01 | 0.0596 |
| 10226 | PLIN3 | P1T-E | Human | Esophagus | ESCC | 9.44e-09 | 1.39e+00 | 0.0875 |
| 10226 | PLIN3 | P2T-E | Human | Esophagus | ESCC | 1.17e-14 | -7.21e-02 | 0.1177 |
| 10226 | PLIN3 | P4T-E | Human | Esophagus | ESCC | 3.99e-18 | 3.64e-01 | 0.1323 |
| 10226 | PLIN3 | P5T-E | Human | Esophagus | ESCC | 4.75e-03 | 2.99e-02 | 0.1327 |
| 10226 | PLIN3 | P8T-E | Human | Esophagus | ESCC | 2.67e-16 | 4.76e-01 | 0.0889 |
| 10226 | PLIN3 | P9T-E | Human | Esophagus | ESCC | 4.31e-05 | 2.89e-01 | 0.1131 |
| 10226 | PLIN3 | P10T-E | Human | Esophagus | ESCC | 8.26e-13 | 1.64e-01 | 0.116 |
| 10226 | PLIN3 | P11T-E | Human | Esophagus | ESCC | 8.44e-09 | 8.20e-01 | 0.1426 |
| 10226 | PLIN3 | P12T-E | Human | Esophagus | ESCC | 5.86e-19 | 5.84e-01 | 0.1122 |
| 10226 | PLIN3 | P15T-E | Human | Esophagus | ESCC | 2.95e-13 | 3.04e-01 | 0.1149 |
| 10226 | PLIN3 | P16T-E | Human | Esophagus | ESCC | 3.62e-22 | -1.67e-02 | 0.1153 |
| 10226 | PLIN3 | P17T-E | Human | Esophagus | ESCC | 6.79e-07 | 8.05e-01 | 0.1278 |
| 10226 | PLIN3 | P19T-E | Human | Esophagus | ESCC | 6.14e-06 | 1.30e+00 | 0.1662 |
| 10226 | PLIN3 | P20T-E | Human | Esophagus | ESCC | 1.89e-06 | 3.97e-01 | 0.1124 |
| 10226 | PLIN3 | P21T-E | Human | Esophagus | ESCC | 2.78e-20 | 6.72e-01 | 0.1617 |
| Page: 1 2 3 4 5 6 7 8 |
| Tissue | Expression Dynamics | Abbreviation |
| Esophagus |  | ESCC: Esophageal squamous cell carcinoma |
| HGIN: High-grade intraepithelial neoplasias | ||
| LGIN: Low-grade intraepithelial neoplasias | ||
| GC |  | CAG: Chronic atrophic gastritis |
| CAG with IM: Chronic atrophic gastritis with intestinal metaplasia | ||
| CSG: Chronic superficial gastritis | ||
| GC: Gastric cancer | ||
| SIM: Severe intestinal metaplasia | ||
| WIM: Wild intestinal metaplasia | ||
| Liver |  | HCC: Hepatocellular carcinoma |
| NAFLD: Non-alcoholic fatty liver disease | ||
| Oral Cavity | 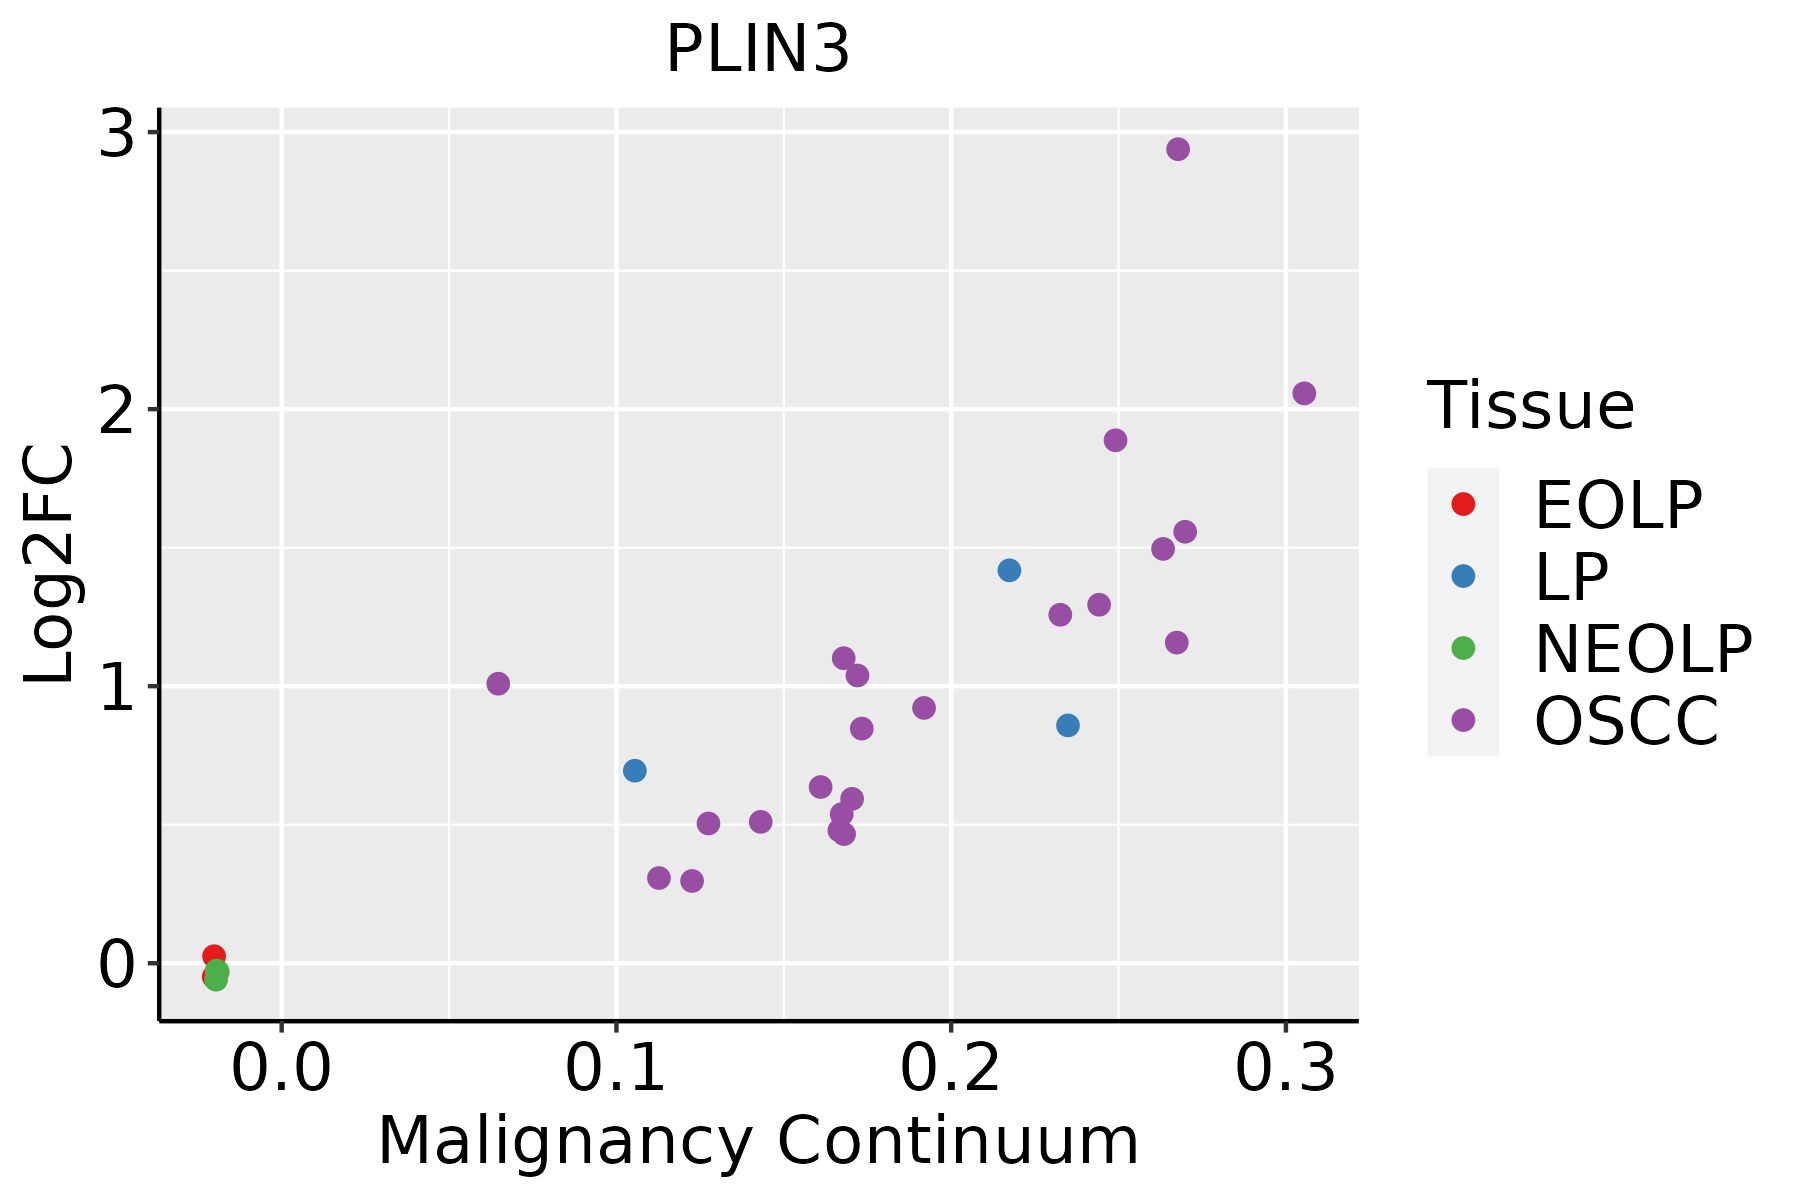 | EOLP: Erosive Oral lichen planus |
| LP: leukoplakia | ||
| NEOLP: Non-erosive oral lichen planus | ||
| OSCC: Oral squamous cell carcinoma | ||
| Prostate | 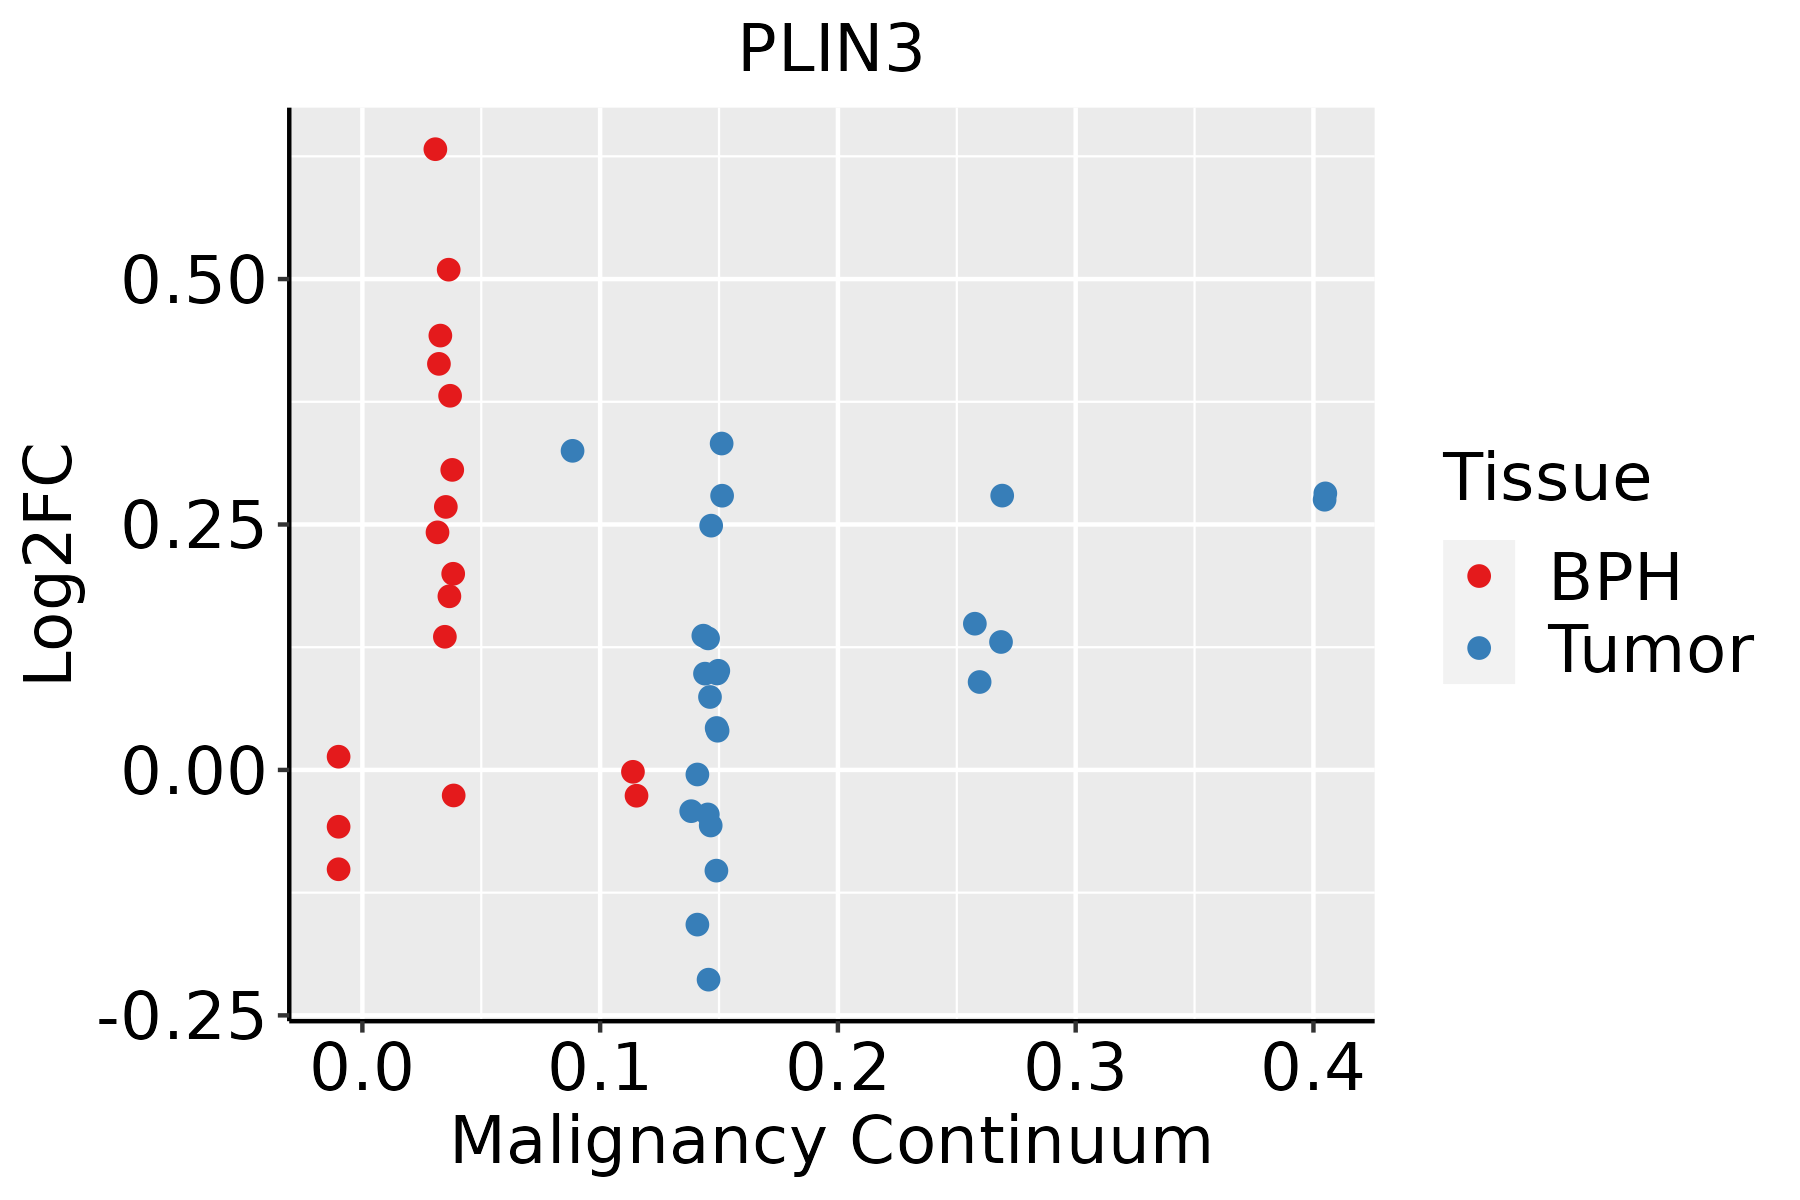 | BPH: Benign Prostatic Hyperplasia |
| Skin | 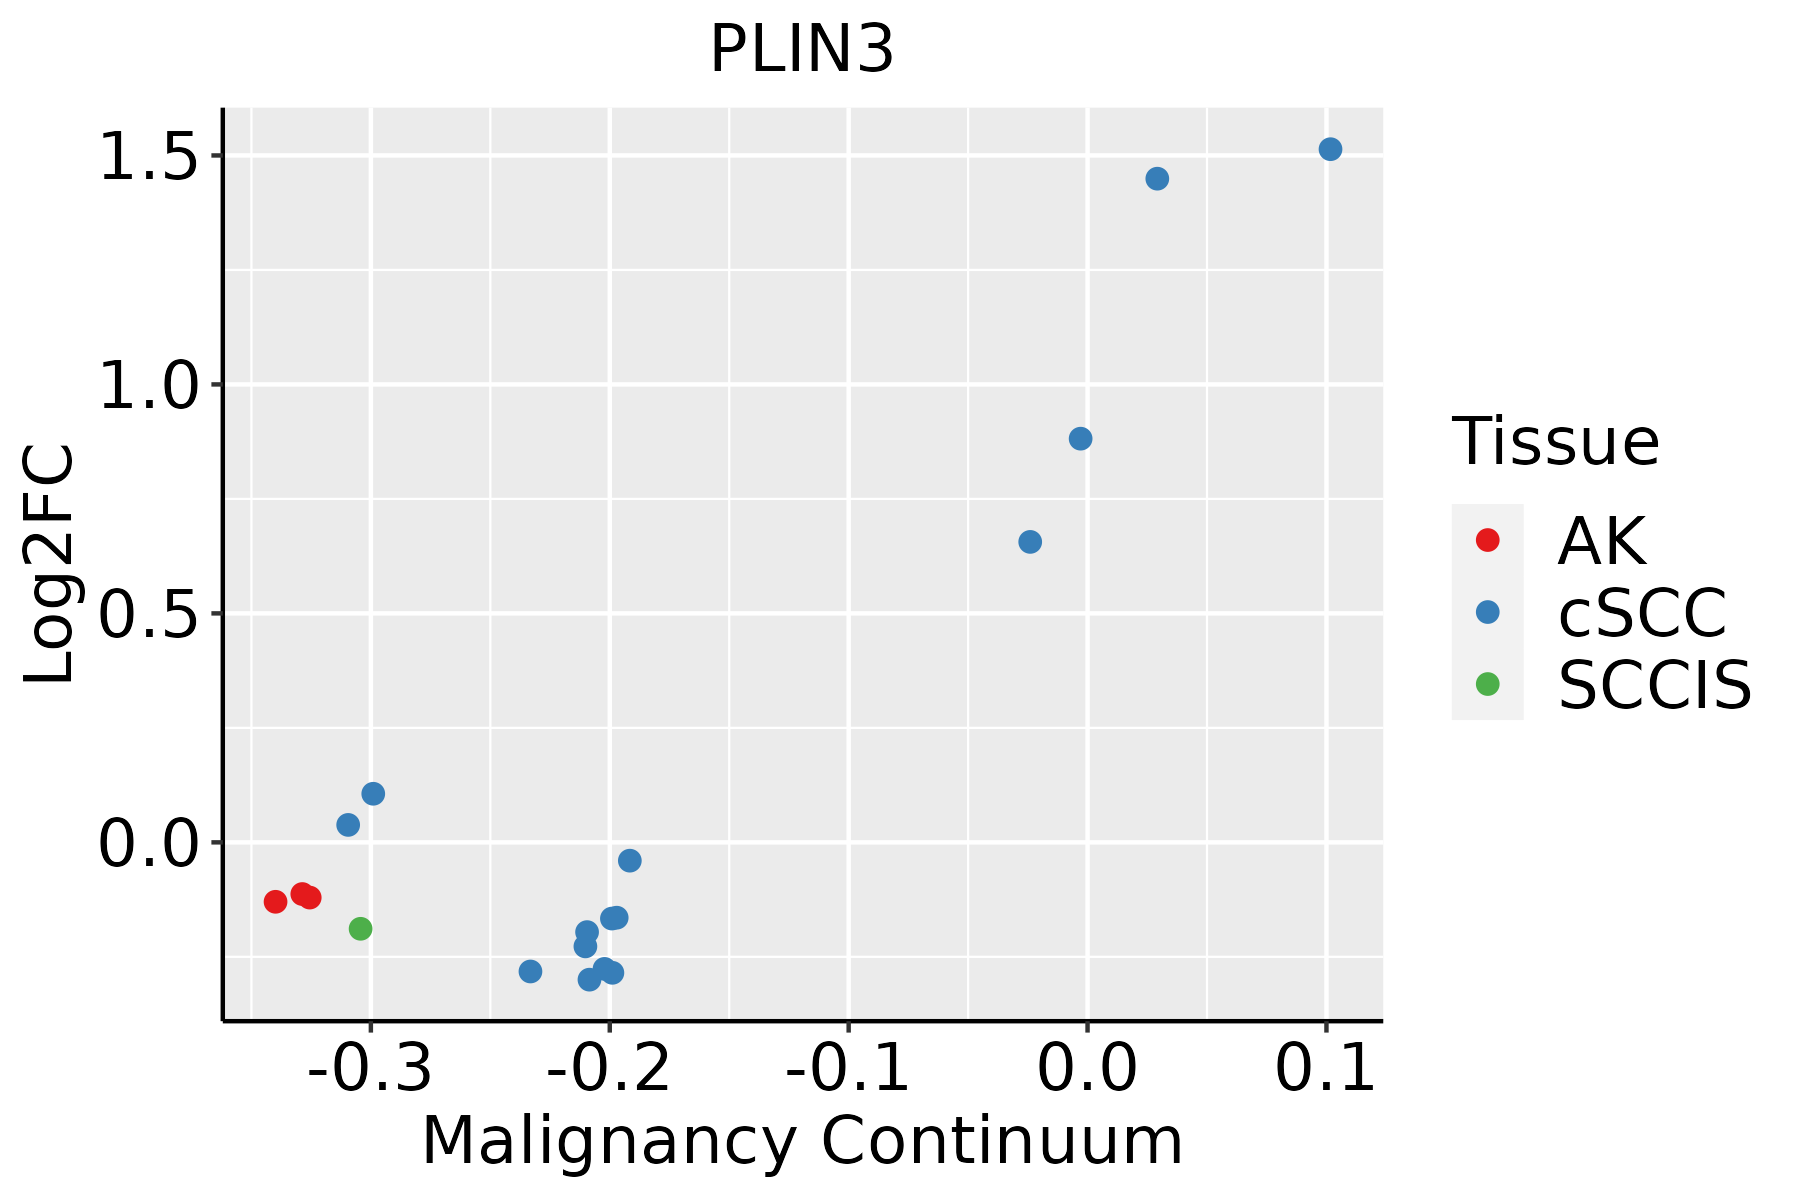 | AK: Actinic keratosis |
| cSCC: Cutaneous squamous cell carcinoma | ||
| SCCIS:squamous cell carcinoma in situ | ||
| Thyroid | 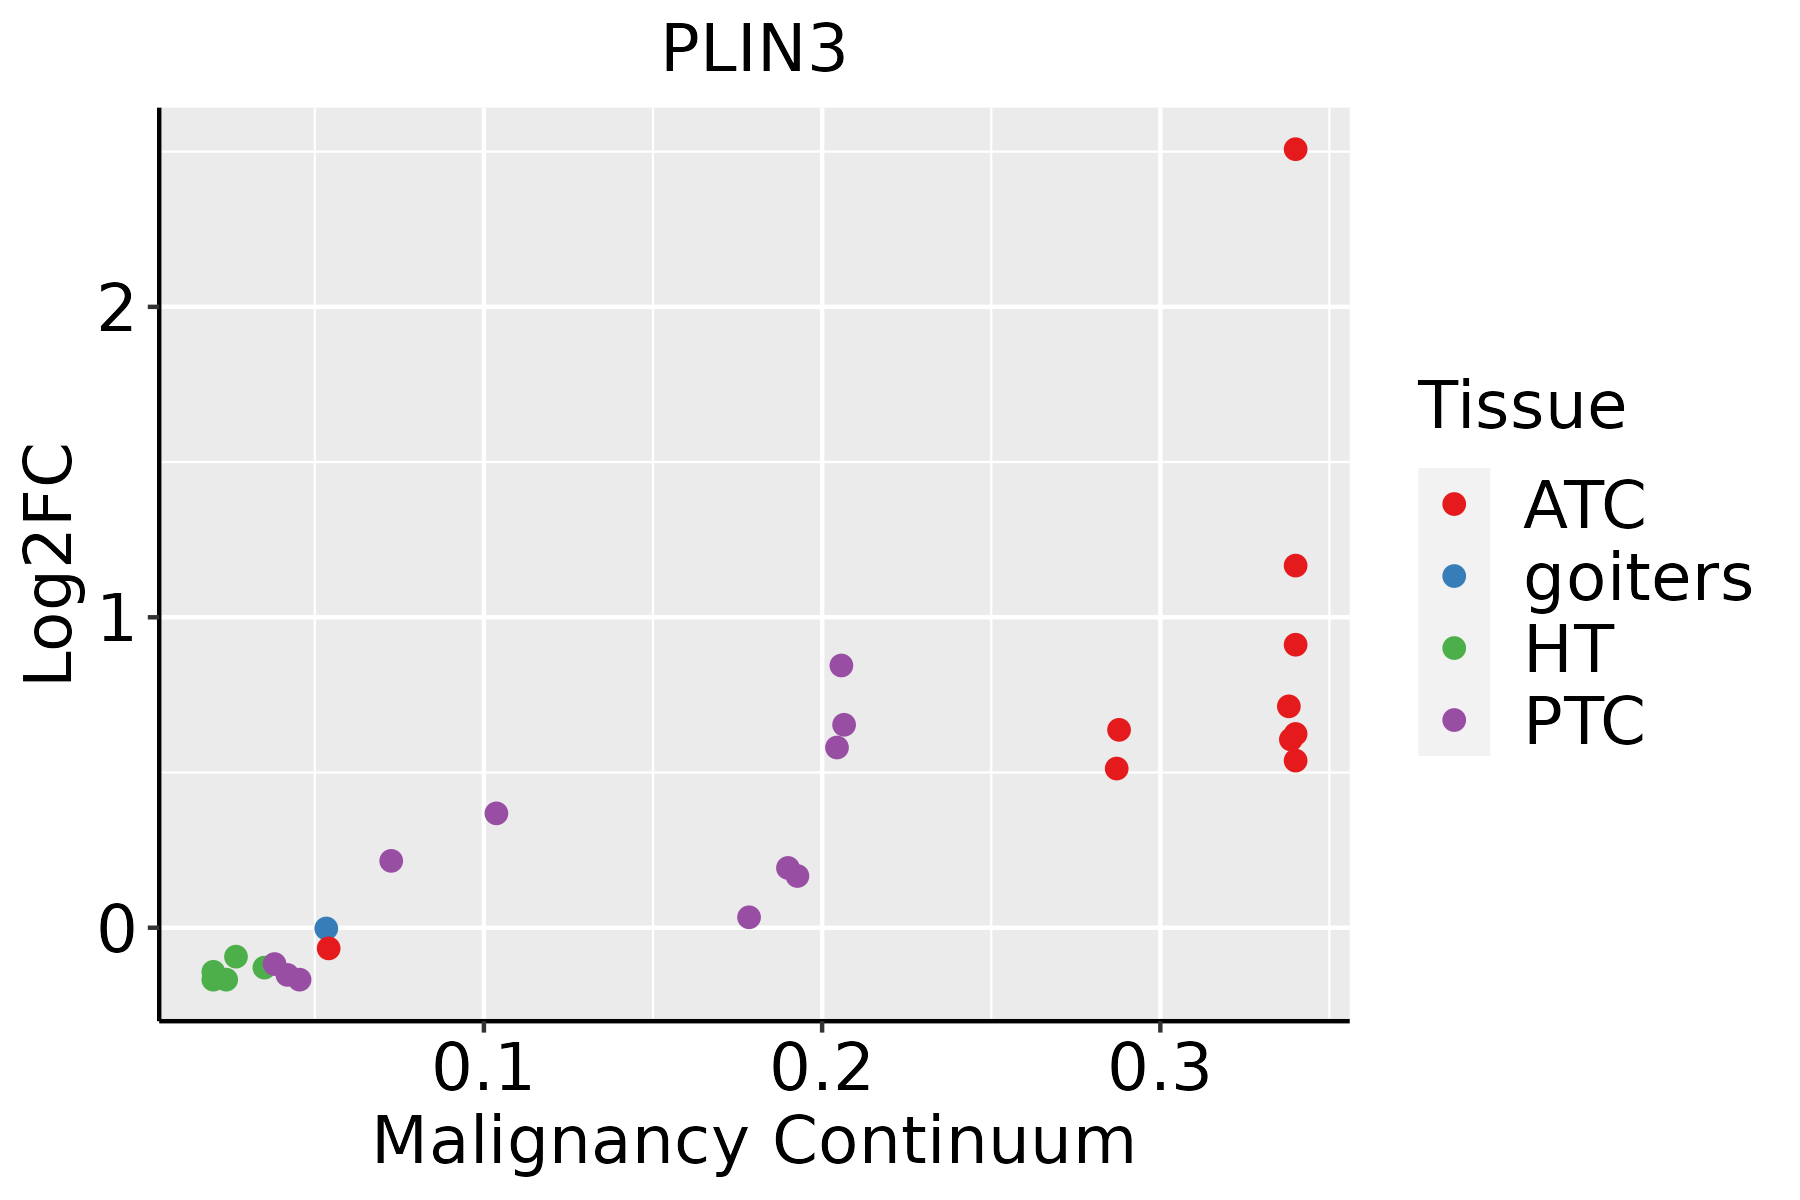 | ATC: Anaplastic thyroid cancer |
| HT: Hashimoto's thyroiditis | ||
| PTC: Papillary thyroid cancer |
| ∗log2FC in expression of this searched gene in stem-like cells from each diseased tissue sample relative to stem-like cells in normal samples in each tissue plotted against the malignancy continuum. Samples are colored based on if they are from different disease stage. |
Top |
Malignant transformation related pathway analysis |
| Find out the enriched GO biological processes and KEGG pathways involved in transition from healthy to precancer to cancer |
| Tissue | Disease Stage | Enriched GO biological Processes |
| Colorectum | AD |  |
| Colorectum | SER |  |
| Colorectum | MSS |  |
| Colorectum | MSI-H |  |
| Colorectum | FAP |  |
| ∗Top 15 enriched GO BP terms are showed in the bar plot of each disease state in each tissue. Each row represents a significant GO biological process which is colored according to the -log10(p.adjust). |
| Page: 1 2 3 4 5 6 7 8 9 |
| GO ID | Tissue | Disease Stage | Description | Gene Ratio | Bg Ratio | pvalue | p.adjust | Count |
| GO:0051235110 | Esophagus | ESCC | maintenance of location | 200/8552 | 327/18723 | 1.01e-08 | 2.02e-07 | 200 |
| GO:00199155 | Esophagus | ESCC | lipid storage | 58/8552 | 87/18723 | 6.15e-05 | 4.72e-04 | 58 |
| GO:00108836 | Esophagus | ESCC | regulation of lipid storage | 36/8552 | 57/18723 | 5.87e-03 | 2.17e-02 | 36 |
| GO:005123511 | Liver | Cirrhotic | maintenance of location | 117/4634 | 327/18723 | 4.78e-06 | 7.86e-05 | 117 |
| GO:001087611 | Liver | Cirrhotic | lipid localization | 147/4634 | 448/18723 | 6.24e-05 | 7.12e-04 | 147 |
| GO:00108831 | Liver | Cirrhotic | regulation of lipid storage | 26/4634 | 57/18723 | 4.79e-04 | 3.85e-03 | 26 |
| GO:00199151 | Liver | Cirrhotic | lipid storage | 35/4634 | 87/18723 | 1.03e-03 | 7.20e-03 | 35 |
| GO:19059521 | Liver | Cirrhotic | regulation of lipid localization | 62/4634 | 181/18723 | 2.53e-03 | 1.51e-02 | 62 |
| GO:19059541 | Liver | Cirrhotic | positive regulation of lipid localization | 39/4634 | 110/18723 | 7.76e-03 | 3.65e-02 | 39 |
| GO:005123521 | Liver | HCC | maintenance of location | 185/7958 | 327/18723 | 1.70e-07 | 3.12e-06 | 185 |
| GO:001087621 | Liver | HCC | lipid localization | 228/7958 | 448/18723 | 1.80e-04 | 1.41e-03 | 228 |
| GO:00199152 | Liver | HCC | lipid storage | 53/7958 | 87/18723 | 4.01e-04 | 2.71e-03 | 53 |
| GO:00108832 | Liver | HCC | regulation of lipid storage | 35/7958 | 57/18723 | 3.08e-03 | 1.43e-02 | 35 |
| GO:005123518 | Oral cavity | OSCC | maintenance of location | 182/7305 | 327/18723 | 6.16e-10 | 1.58e-08 | 182 |
| GO:00199154 | Oral cavity | OSCC | lipid storage | 48/7305 | 87/18723 | 1.60e-03 | 7.62e-03 | 48 |
| GO:00108835 | Oral cavity | OSCC | regulation of lipid storage | 32/7305 | 57/18723 | 6.45e-03 | 2.40e-02 | 32 |
| GO:005123519 | Oral cavity | LP | maintenance of location | 111/4623 | 327/18723 | 9.62e-05 | 1.20e-03 | 111 |
| GO:005123516 | Prostate | BPH | maintenance of location | 80/3107 | 327/18723 | 1.55e-04 | 1.36e-03 | 80 |
| GO:005123517 | Prostate | Tumor | maintenance of location | 78/3246 | 327/18723 | 1.56e-03 | 9.55e-03 | 78 |
| GO:005123527 | Skin | cSCC | maintenance of location | 106/4864 | 327/18723 | 5.17e-03 | 2.61e-02 | 106 |
| Page: 1 2 |
| Pathway ID | Tissue | Disease Stage | Description | Gene Ratio | Bg Ratio | pvalue | p.adjust | qvalue | Count |
| Page: 1 |
Top |
Cell-cell communication analysis |
| Identification of potential cell-cell interactions between two cell types and their ligand-receptor pairs for different disease states |
| Ligand | Receptor | LRpair | Pathway | Tissue | Disease Stage |
| Page: 1 |
Top |
Single-cell gene regulatory network inference analysis |
| Find out the significant the regulons (TFs) and the target genes of each regulon across cell types for different disease states |
| TF | Cell Type | Tissue | Disease Stage | Target Gene | RSS | Regulon Activity |
| ∗The dot plots of a searched regulon are shown for all cell subpopulations in each disease state of each tissue based on the regulon specific score inferred using pySCENIC and by calculating the average expression. |
| Page: 1 |
Top |
Somatic mutation of malignant transformation related genes |
| Annotation of somatic variants for genes involved in malignant transformation |
| Hugo Symbol | Variant Class | Variant Classification | dbSNP RS | HGVSc | HGVSp | HGVSp Short | SWISSPROT | BIOTYPE | SIFT | PolyPhen | Tumor Sample Barcode | Tissue | Histology | Sex | Age | Stage | Therapy Types | Drugs | Outcome |
| PLIN3 | SNV | Missense_Mutation | c.580N>C | p.Gly194Arg | p.G194R | O60664 | protein_coding | deleterious(0.02) | probably_damaging(0.956) | TCGA-E2-A1LA-01 | Breast | breast invasive carcinoma | Female | <65 | I/II | Hormone Therapy | arimidex | SD | |
| PLIN3 | deletion | Frame_Shift_Del | novel | c.454delN | p.Asp152ThrfsTer17 | p.D152Tfs*17 | O60664 | protein_coding | TCGA-EW-A2FV-01 | Breast | breast invasive carcinoma | Female | <65 | III/IV | Chemotherapy | docetaxel | SD | ||
| PLIN3 | SNV | Missense_Mutation | rs577339133 | c.856N>A | p.Val286Ile | p.V286I | O60664 | protein_coding | deleterious(0.04) | benign(0.013) | TCGA-FU-A3WB-01 | Cervix | cervical & endocervical cancer | Female | <65 | I/II | Chemotherapy | cisplatin | CR |
| PLIN3 | SNV | Missense_Mutation | c.484N>A | p.Val162Met | p.V162M | O60664 | protein_coding | tolerated(0.17) | benign(0.269) | TCGA-AA-A01R-01 | Colorectum | colon adenocarcinoma | Male | <65 | III/IV | Chemotherapy | 5-fluorouracil | PD | |
| PLIN3 | SNV | Missense_Mutation | rs574992524 | c.932N>A | p.Gly311Asp | p.G311D | O60664 | protein_coding | tolerated(0.36) | benign(0.055) | TCGA-AU-6004-01 | Colorectum | colon adenocarcinoma | Female | >=65 | I/II | Unknown | Unknown | SD |
| PLIN3 | SNV | Missense_Mutation | rs749599909 | c.1244N>T | p.Thr415Met | p.T415M | O60664 | protein_coding | tolerated(0.21) | benign(0.009) | TCGA-AZ-6598-01 | Colorectum | colon adenocarcinoma | Female | >=65 | I/II | Unknown | Unknown | SD |
| PLIN3 | SNV | Missense_Mutation | novel | c.345N>T | p.Glu115Asp | p.E115D | O60664 | protein_coding | tolerated(0.65) | benign(0.01) | TCGA-CA-6718-01 | Colorectum | colon adenocarcinoma | Male | <65 | I/II | Unknown | Unknown | PD |
| PLIN3 | SNV | Missense_Mutation | rs768566079 | c.1297N>G | p.Lys433Glu | p.K433E | O60664 | protein_coding | tolerated(0.13) | benign(0.003) | TCGA-CM-5861-01 | Colorectum | colon adenocarcinoma | Female | <65 | I/II | Unknown | Unknown | PD |
| PLIN3 | SNV | Missense_Mutation | rs142986276 | c.671N>T | p.Ala224Val | p.A224V | O60664 | protein_coding | tolerated(0.18) | benign(0.08) | TCGA-WS-AB45-01 | Colorectum | colon adenocarcinoma | Female | <65 | I/II | Unknown | Unknown | SD |
| PLIN3 | SNV | Missense_Mutation | c.150N>T | p.Lys50Asn | p.K50N | O60664 | protein_coding | deleterious(0) | possibly_damaging(0.841) | TCGA-WS-AB45-01 | Colorectum | colon adenocarcinoma | Female | <65 | I/II | Unknown | Unknown | SD |
| Page: 1 2 3 4 5 |
Top |
Related drugs of malignant transformation related genes |
| Identification of chemicals and drugs interact with genes involved in malignant transfromation |
| (DGIdb 4.0) |
| Entrez ID | Symbol | Category | Interaction Types | Drug Claim Name | Drug Name | PMIDs |
| 10226 | PLIN3 | NA | IDURSULFASE | IDURSULFASE | ||
| 10226 | PLIN3 | NA | IDURSULFASE | IDURSULFASE | ||
| 10226 | PLIN3 | NA | GALSULFASE | GALSULFASE |
| Page: 1 |

Copyright 2023-Present -The University of Texas Health Science Center at Houston |