
|
|||||
|
 | |
| |
| |
| |
| |
| |
|
Gene: PLIN2 |
Gene summary for PLIN2 |
| Gene information | Species | Human | Gene symbol | PLIN2 | Gene ID | 123 |
| Gene name | perilipin 2 | |
| Gene Alias | ADFP | |
| Cytomap | 9p22.1 | |
| Gene Type | protein-coding | GO ID | GO:0006810 | UniProtAcc | Q6FHZ7 |
Top |
Malignant transformation analysis |
| Identification of the aberrant gene expression in precancerous and cancerous lesions by comparing the gene expression of stem-like cells in diseased tissues with normal stem cells |
| Entrez ID | Symbol | Replicates | Species | Organ | Tissue | Adj P-value | Log2FC | Malignancy |
| 123 | PLIN2 | GSM4909282 | Human | Breast | IDC | 2.46e-04 | 3.73e-01 | -0.0288 |
| 123 | PLIN2 | GSM4909285 | Human | Breast | IDC | 1.18e-04 | 2.03e-01 | 0.21 |
| 123 | PLIN2 | GSM4909290 | Human | Breast | IDC | 8.59e-04 | 3.03e-01 | 0.2096 |
| 123 | PLIN2 | GSM4909294 | Human | Breast | IDC | 1.80e-03 | -1.86e-01 | 0.2022 |
| 123 | PLIN2 | GSM4909296 | Human | Breast | IDC | 2.31e-08 | -2.30e-01 | 0.1524 |
| 123 | PLIN2 | GSM4909297 | Human | Breast | IDC | 5.59e-07 | -1.73e-01 | 0.1517 |
| 123 | PLIN2 | GSM4909298 | Human | Breast | IDC | 1.25e-03 | -1.92e-01 | 0.1551 |
| 123 | PLIN2 | GSM4909299 | Human | Breast | IDC | 1.59e-05 | -2.11e-01 | 0.035 |
| 123 | PLIN2 | GSM4909301 | Human | Breast | IDC | 2.66e-05 | -2.02e-01 | 0.1577 |
| 123 | PLIN2 | GSM4909302 | Human | Breast | IDC | 4.90e-03 | -2.13e-01 | 0.1545 |
| 123 | PLIN2 | GSM4909304 | Human | Breast | IDC | 6.17e-07 | -2.31e-01 | 0.1636 |
| 123 | PLIN2 | GSM4909307 | Human | Breast | IDC | 1.38e-08 | -2.35e-01 | 0.1569 |
| 123 | PLIN2 | GSM4909309 | Human | Breast | IDC | 3.71e-04 | -2.34e-01 | 0.0483 |
| 123 | PLIN2 | GSM4909311 | Human | Breast | IDC | 4.83e-10 | -2.10e-01 | 0.1534 |
| 123 | PLIN2 | GSM4909312 | Human | Breast | IDC | 1.73e-02 | -1.54e-01 | 0.1552 |
| 123 | PLIN2 | GSM4909315 | Human | Breast | IDC | 2.16e-03 | -2.07e-01 | 0.21 |
| 123 | PLIN2 | GSM4909319 | Human | Breast | IDC | 2.75e-14 | -2.43e-01 | 0.1563 |
| 123 | PLIN2 | GSM4909321 | Human | Breast | IDC | 6.41e-09 | -2.17e-01 | 0.1559 |
| 123 | PLIN2 | ctrl6 | Human | Breast | Precancer | 4.72e-14 | 7.23e-01 | -0.0061 |
| 123 | PLIN2 | brca10 | Human | Breast | Precancer | 5.75e-26 | 8.93e-01 | -0.0029 |
| Page: 1 2 3 4 5 6 7 8 9 10 |
| Tissue | Expression Dynamics | Abbreviation |
| Breast | 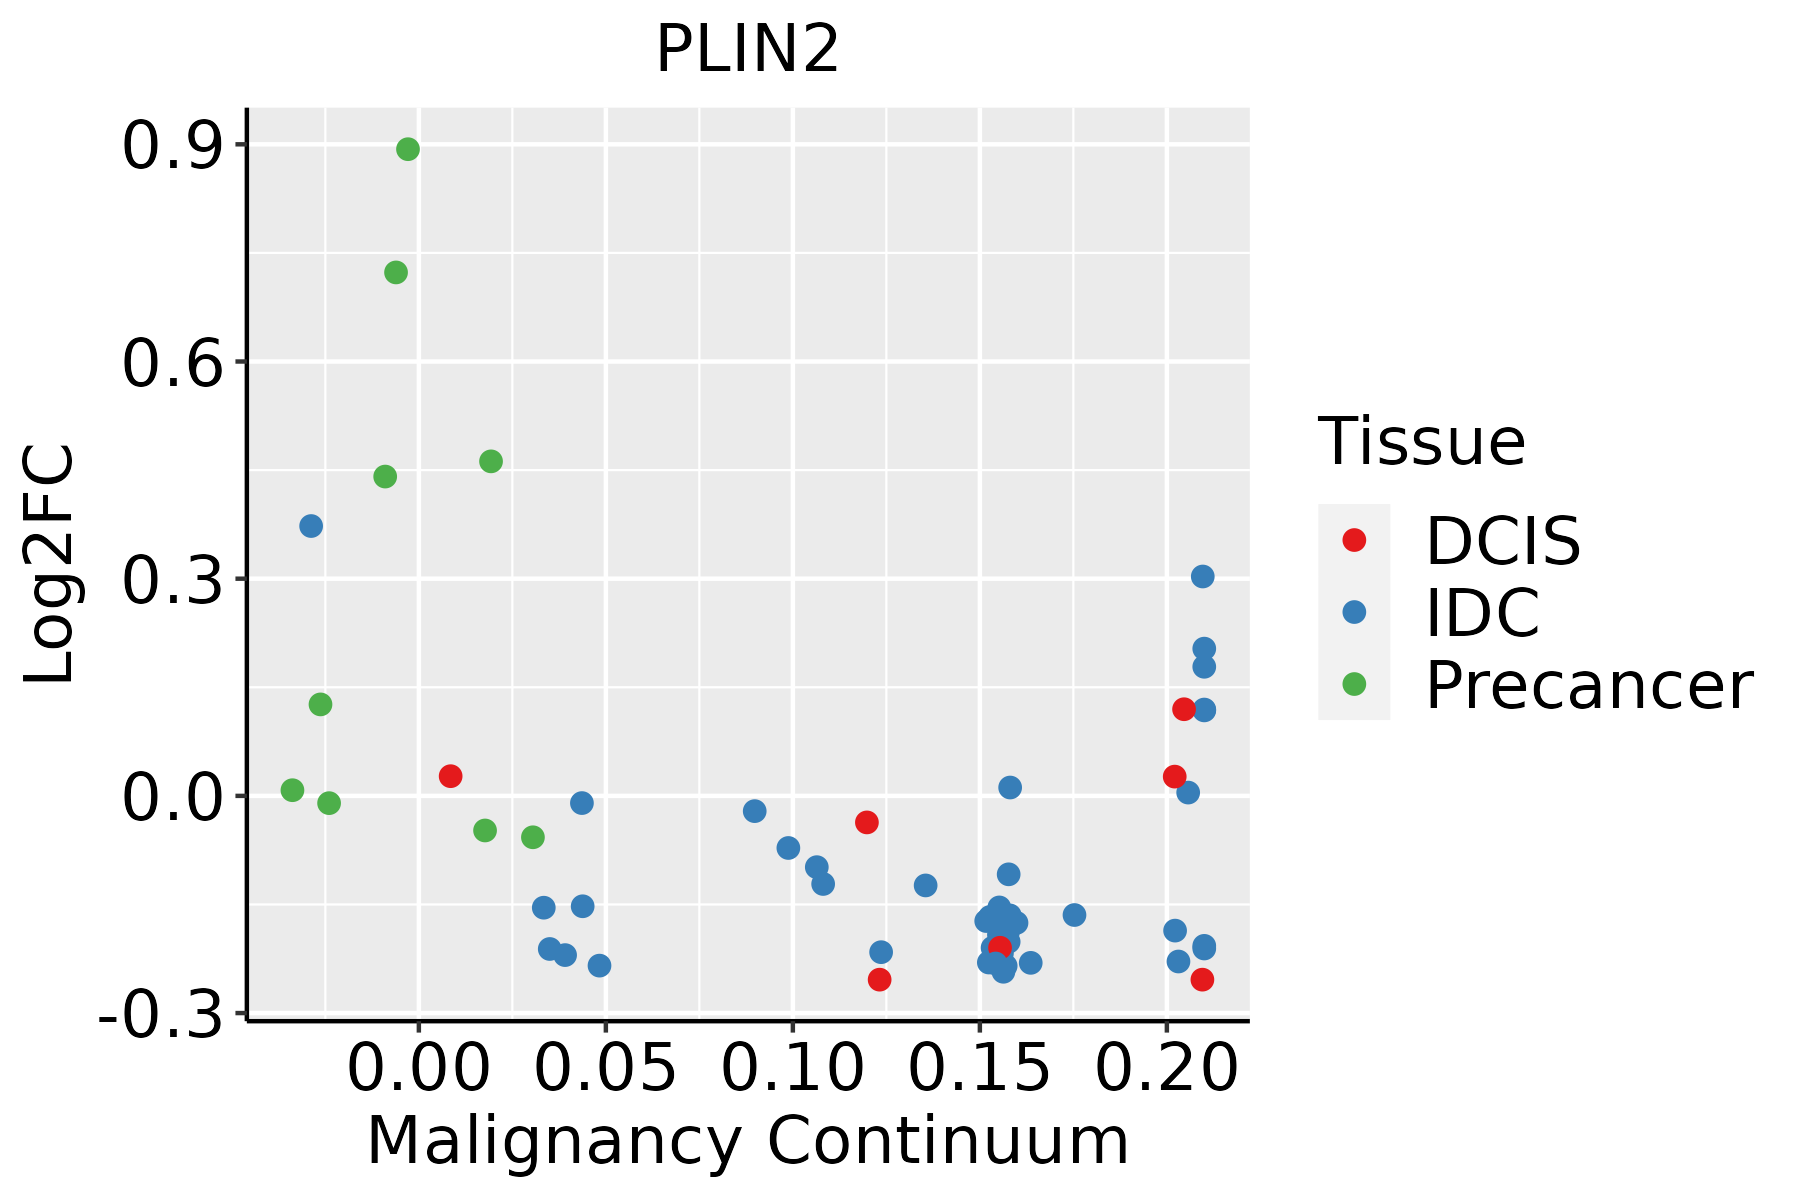 | IDC: Invasive ductal carcinoma |
| DCIS: Ductal carcinoma in situ | ||
| Precancer(BRCA1-mut): Precancerous lesion from BRCA1 mutation carriers | ||
| Cervix | 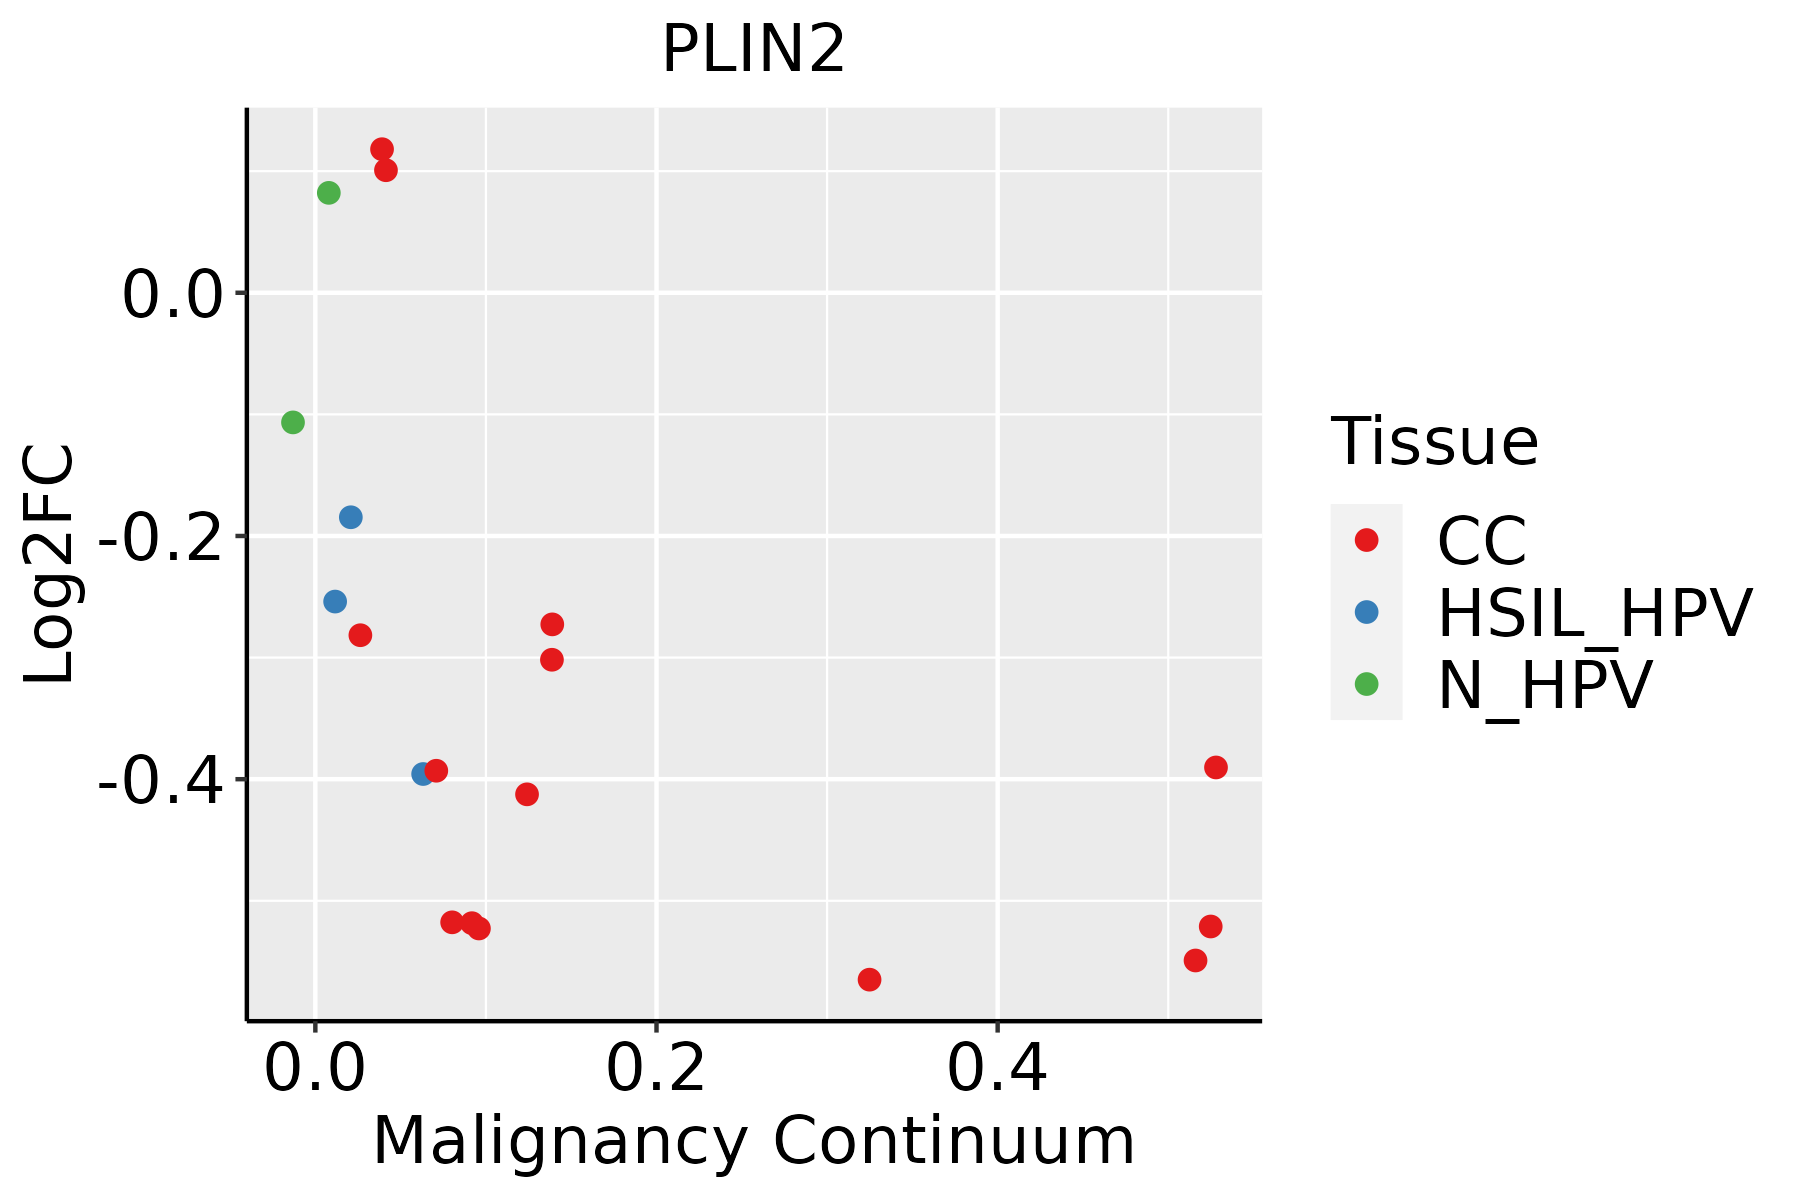 | CC: Cervix cancer |
| HSIL_HPV: HPV-infected high-grade squamous intraepithelial lesions | ||
| N_HPV: HPV-infected normal cervix | ||
| Colorectum (GSE201348) |  | FAP: Familial adenomatous polyposis |
| CRC: Colorectal cancer | ||
| Colorectum (HTA11) |  | AD: Adenomas |
| SER: Sessile serrated lesions | ||
| MSI-H: Microsatellite-high colorectal cancer | ||
| MSS: Microsatellite stable colorectal cancer | ||
| Esophagus |  | ESCC: Esophageal squamous cell carcinoma |
| HGIN: High-grade intraepithelial neoplasias | ||
| LGIN: Low-grade intraepithelial neoplasias | ||
| GC | 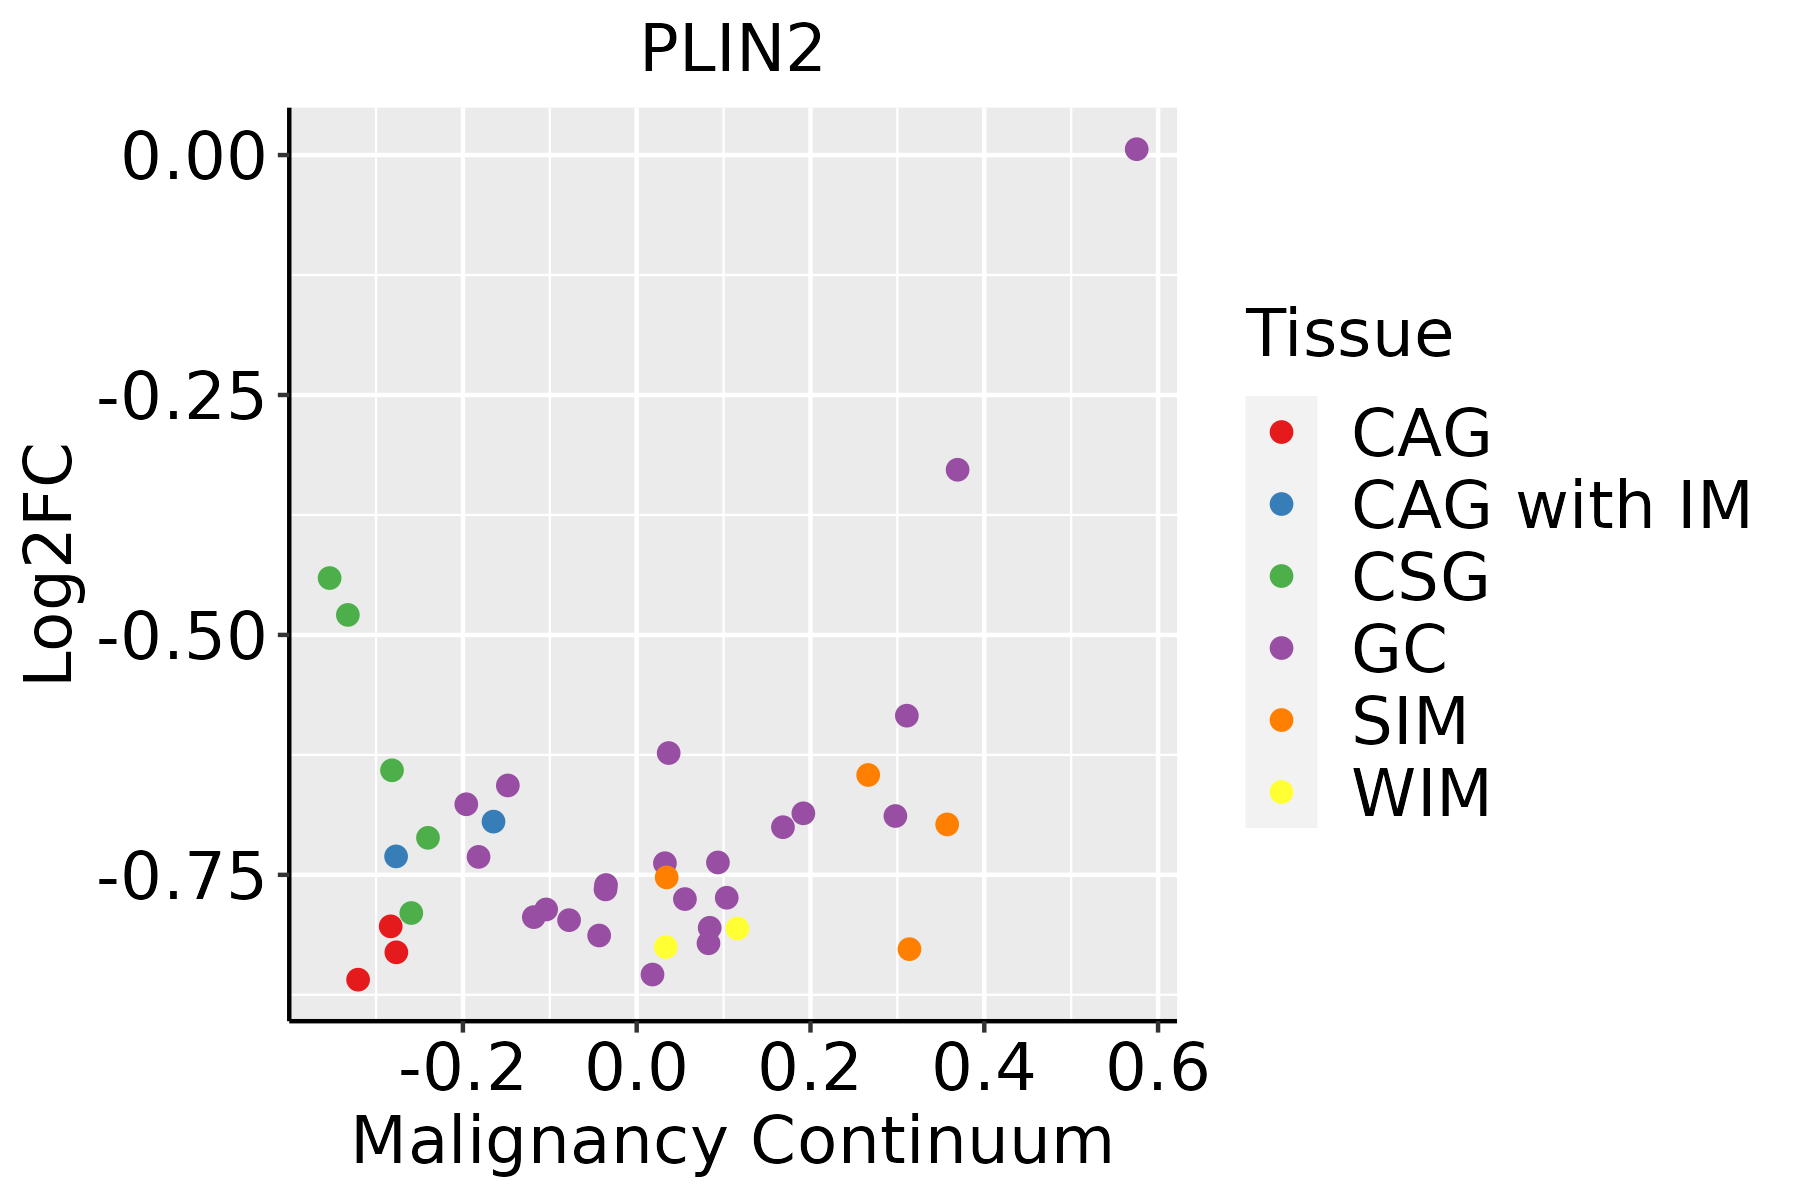 | CAG: Chronic atrophic gastritis |
| CAG with IM: Chronic atrophic gastritis with intestinal metaplasia | ||
| CSG: Chronic superficial gastritis | ||
| GC: Gastric cancer | ||
| SIM: Severe intestinal metaplasia | ||
| WIM: Wild intestinal metaplasia | ||
| Liver | 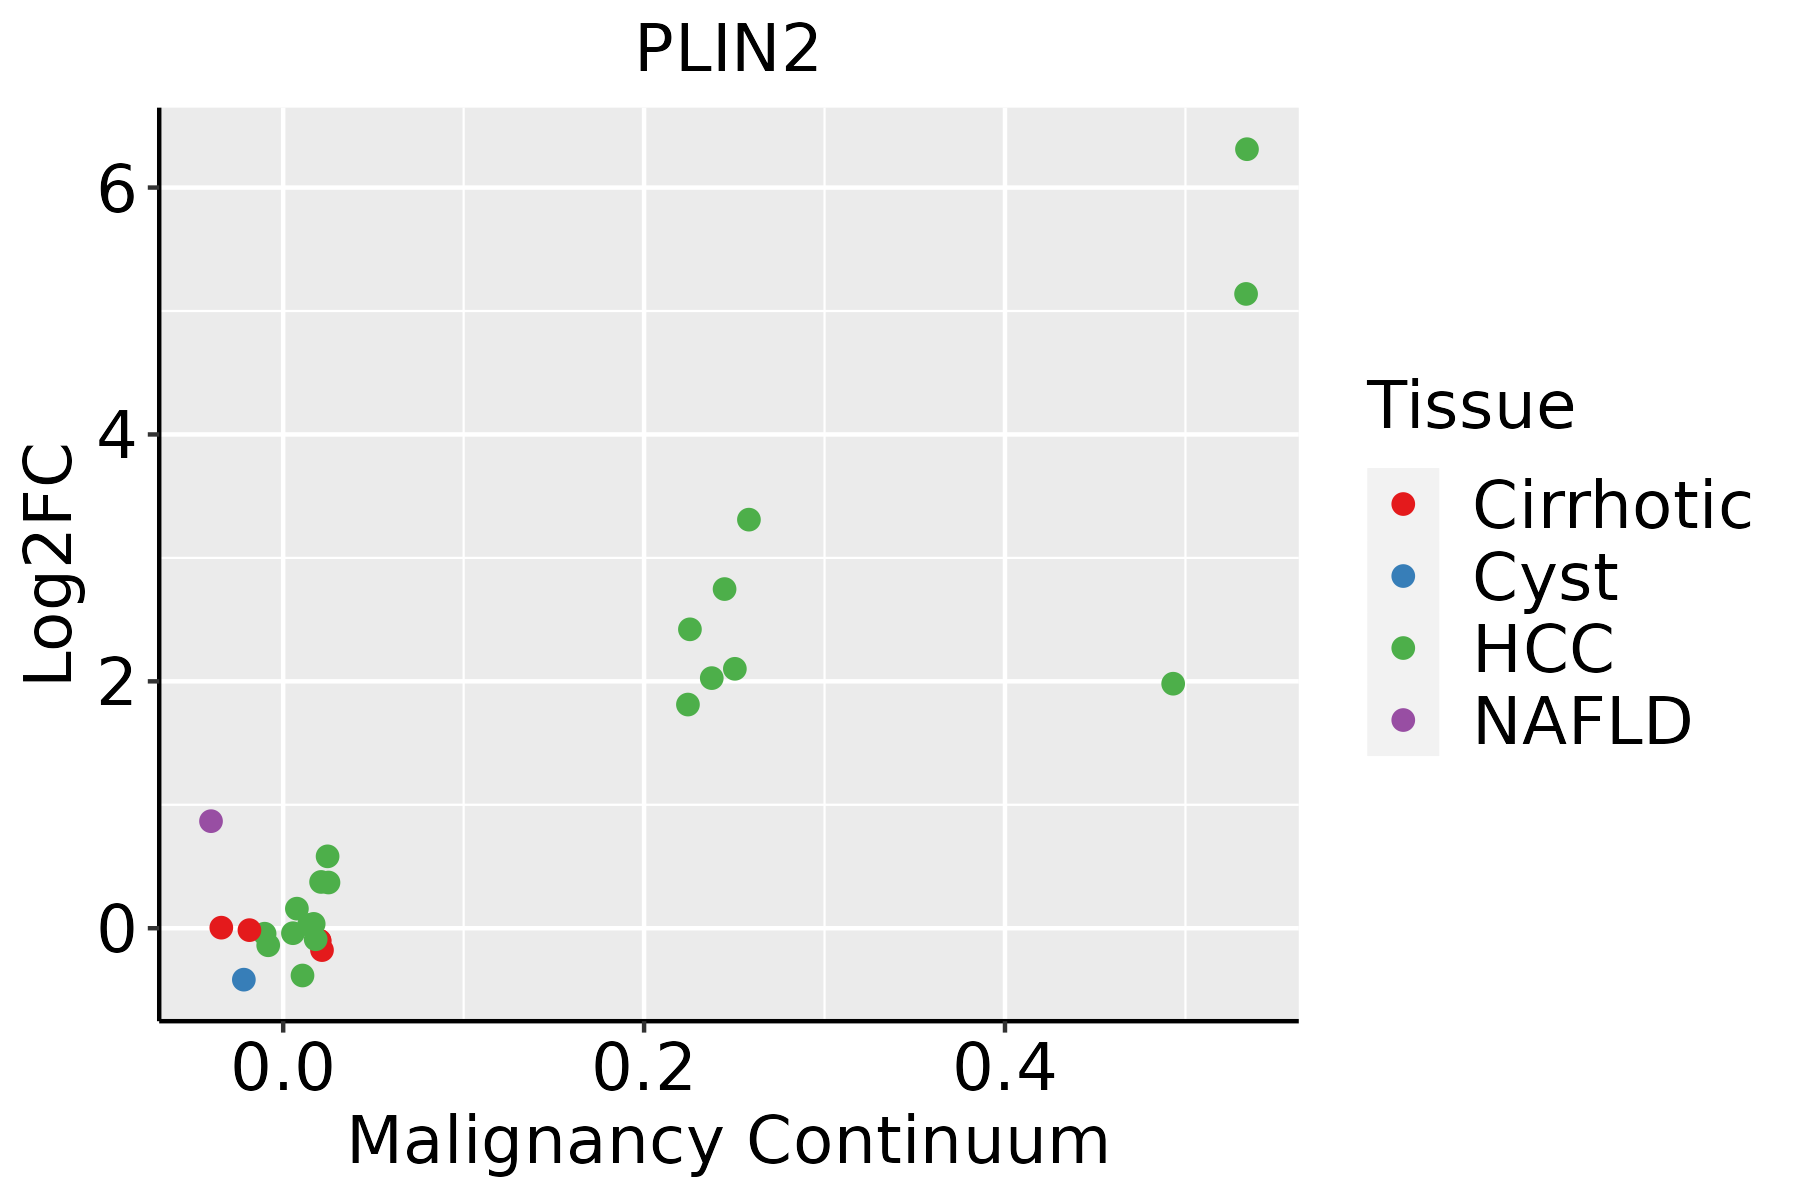 | HCC: Hepatocellular carcinoma |
| NAFLD: Non-alcoholic fatty liver disease | ||
| Oral Cavity | 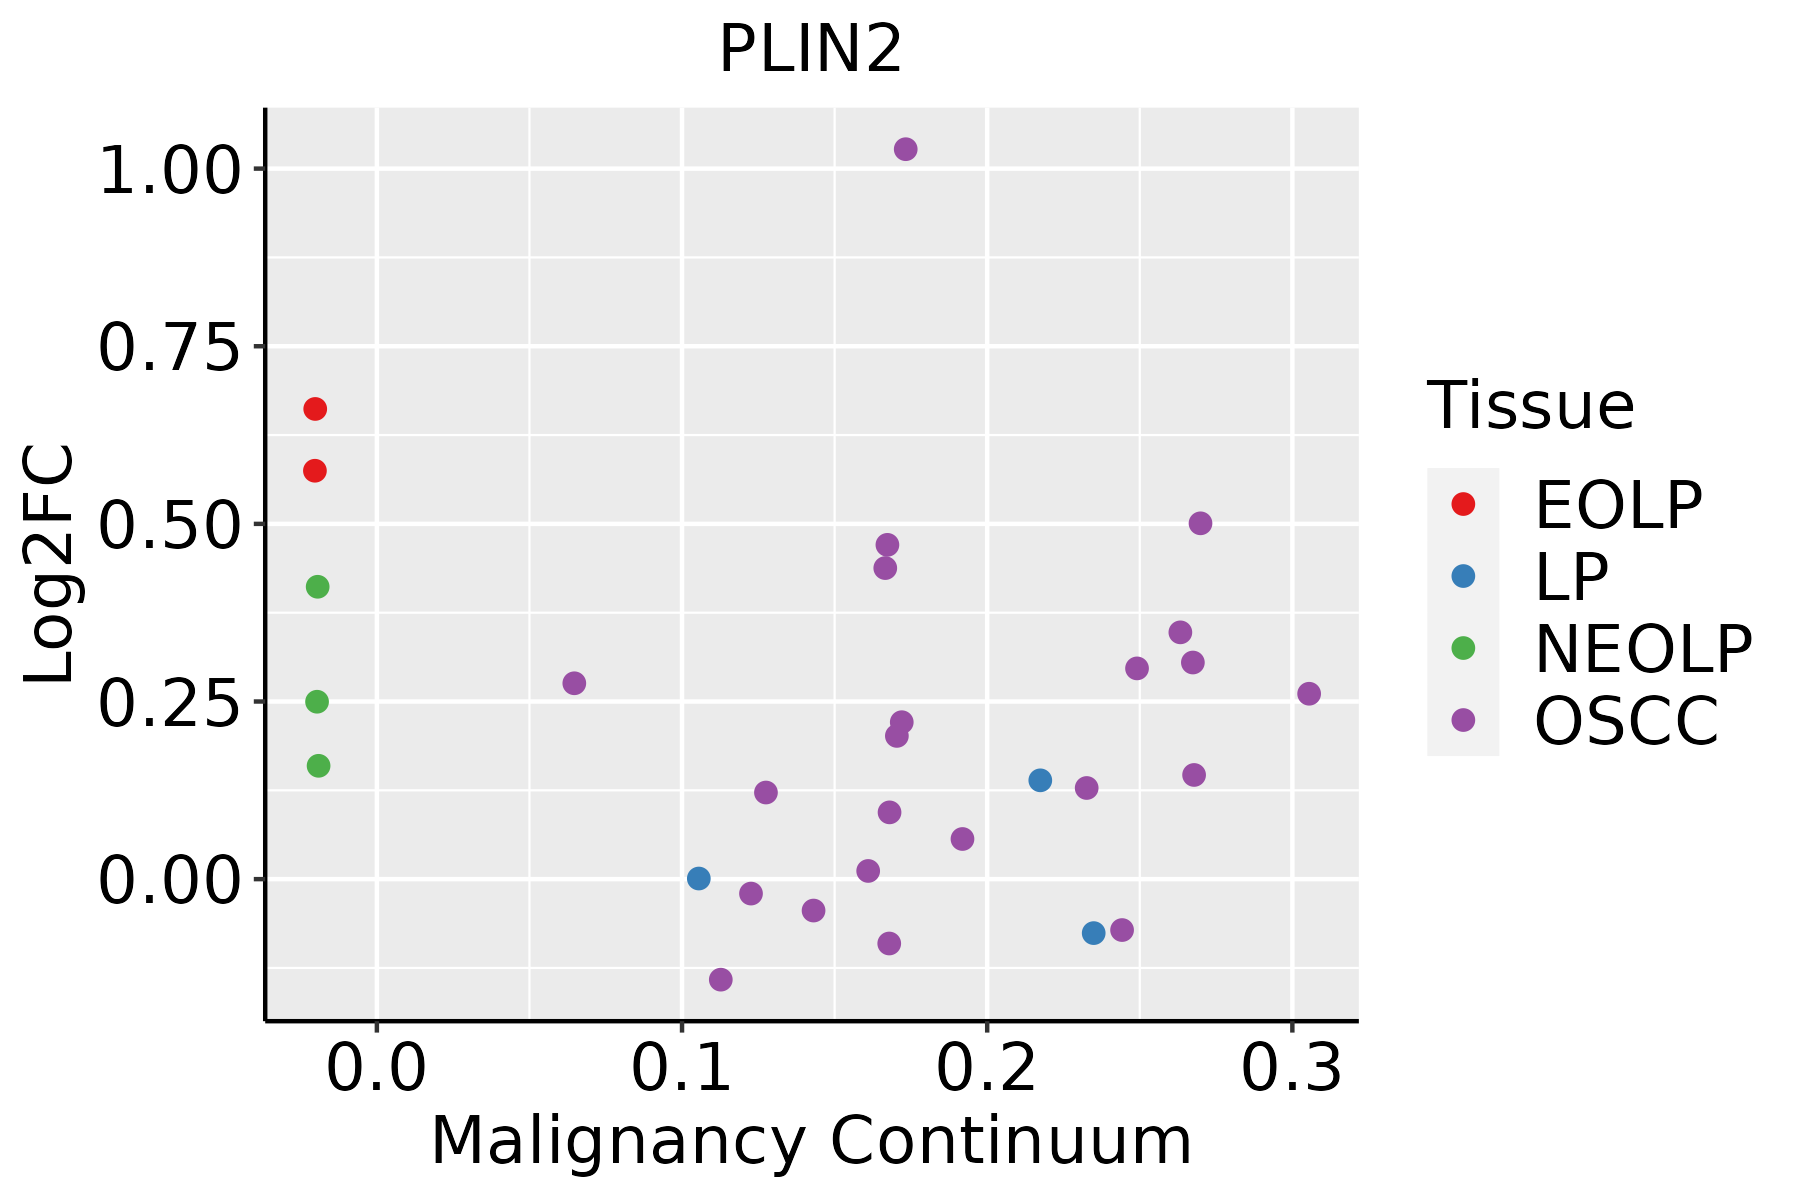 | EOLP: Erosive Oral lichen planus |
| LP: leukoplakia | ||
| NEOLP: Non-erosive oral lichen planus | ||
| OSCC: Oral squamous cell carcinoma | ||
| Prostate | 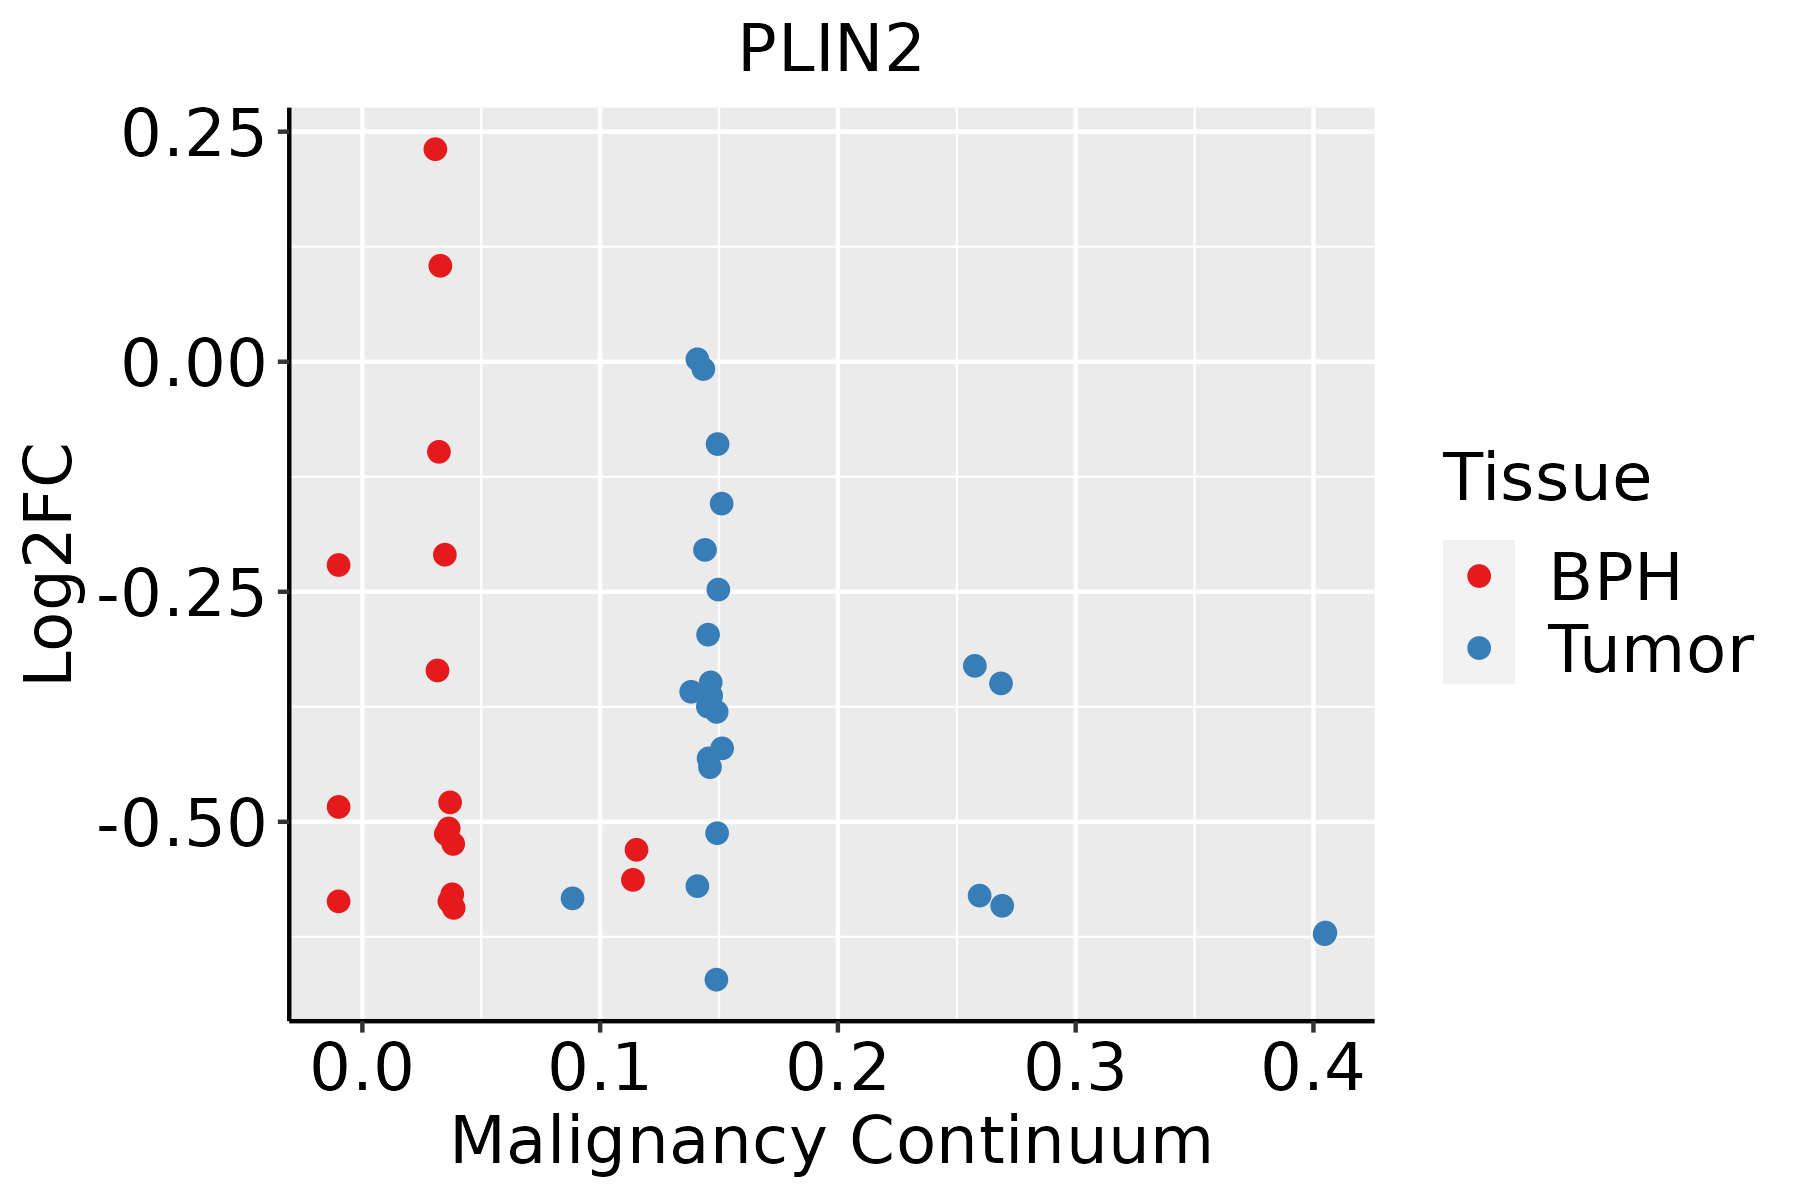 | BPH: Benign Prostatic Hyperplasia |
| Thyroid | 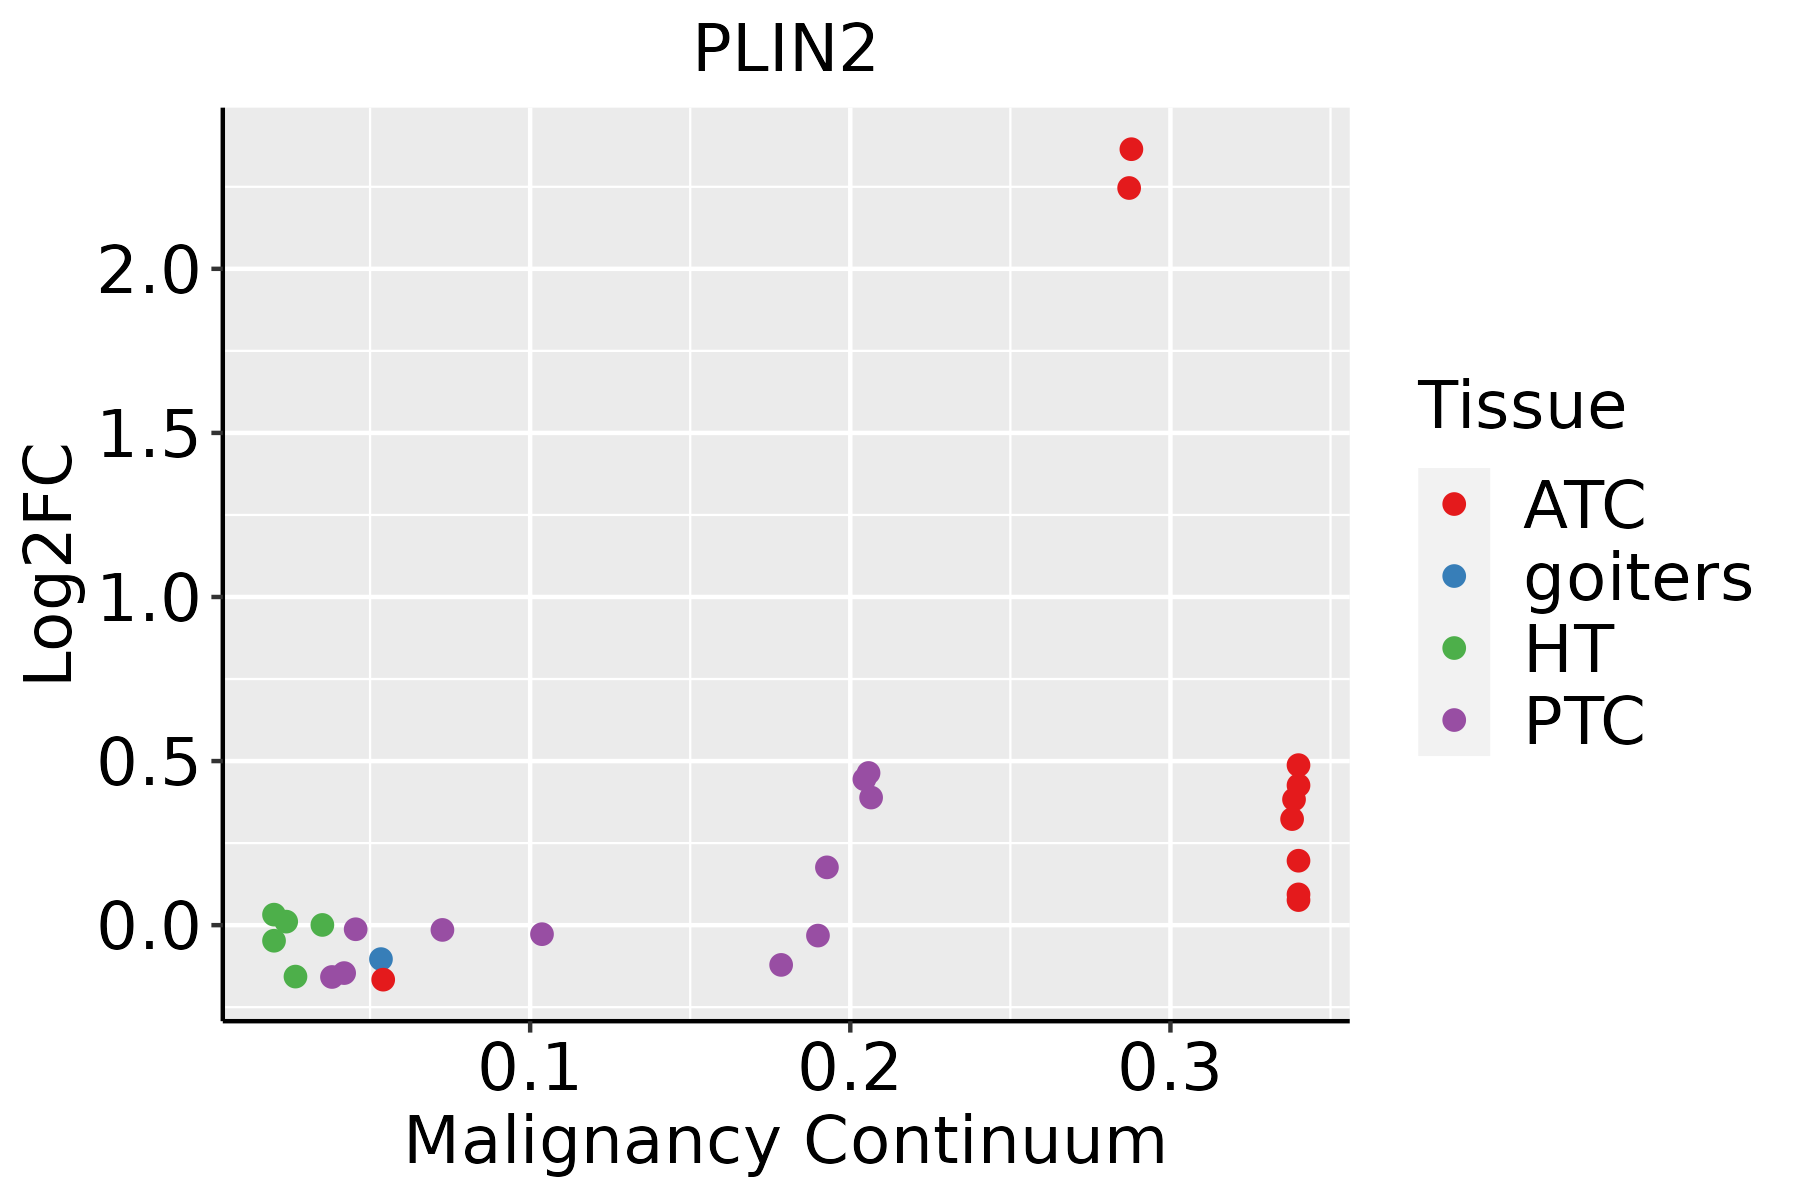 | ATC: Anaplastic thyroid cancer |
| HT: Hashimoto's thyroiditis | ||
| PTC: Papillary thyroid cancer |
| ∗log2FC in expression of this searched gene in stem-like cells from each diseased tissue sample relative to stem-like cells in normal samples in each tissue plotted against the malignancy continuum. Samples are colored based on if they are from different disease stage. |
Top |
Malignant transformation related pathway analysis |
| Find out the enriched GO biological processes and KEGG pathways involved in transition from healthy to precancer to cancer |
| Tissue | Disease Stage | Enriched GO biological Processes |
| Colorectum | AD |  |
| Colorectum | SER |  |
| Colorectum | MSS |  |
| Colorectum | MSI-H |  |
| Colorectum | FAP |  |
| ∗Top 15 enriched GO BP terms are showed in the bar plot of each disease state in each tissue. Each row represents a significant GO biological process which is colored according to the -log10(p.adjust). |
| Page: 1 2 3 4 5 6 7 8 9 |
| GO ID | Tissue | Disease Stage | Description | Gene Ratio | Bg Ratio | pvalue | p.adjust | Count |
| GO:00512358 | Breast | Precancer | maintenance of location | 40/1080 | 327/18723 | 5.85e-06 | 1.71e-04 | 40 |
| GO:00094108 | Breast | Precancer | response to xenobiotic stimulus | 45/1080 | 462/18723 | 4.17e-04 | 5.56e-03 | 45 |
| GO:005123513 | Breast | IDC | maintenance of location | 48/1434 | 327/18723 | 9.90e-06 | 2.77e-04 | 48 |
| GO:000941013 | Breast | IDC | response to xenobiotic stimulus | 62/1434 | 462/18723 | 1.05e-05 | 2.88e-04 | 62 |
| GO:005123523 | Breast | DCIS | maintenance of location | 47/1390 | 327/18723 | 9.55e-06 | 2.56e-04 | 47 |
| GO:000941023 | Breast | DCIS | response to xenobiotic stimulus | 59/1390 | 462/18723 | 3.00e-05 | 6.61e-04 | 59 |
| GO:00512359 | Cervix | CC | maintenance of location | 78/2311 | 327/18723 | 5.18e-09 | 4.92e-07 | 78 |
| GO:00094109 | Cervix | CC | response to xenobiotic stimulus | 78/2311 | 462/18723 | 2.39e-03 | 1.70e-02 | 78 |
| GO:00108834 | Cervix | CC | regulation of lipid storage | 15/2311 | 57/18723 | 3.13e-03 | 2.05e-02 | 15 |
| GO:005123514 | Cervix | HSIL_HPV | maintenance of location | 26/737 | 327/18723 | 5.67e-04 | 8.04e-03 | 26 |
| GO:0009410 | Colorectum | AD | response to xenobiotic stimulus | 128/3918 | 462/18723 | 2.69e-04 | 3.31e-03 | 128 |
| GO:0010876 | Colorectum | AD | lipid localization | 120/3918 | 448/18723 | 1.59e-03 | 1.33e-02 | 120 |
| GO:0006869 | Colorectum | AD | lipid transport | 108/3918 | 398/18723 | 1.67e-03 | 1.39e-02 | 108 |
| GO:00094101 | Colorectum | MSS | response to xenobiotic stimulus | 110/3467 | 462/18723 | 2.36e-03 | 1.92e-02 | 110 |
| GO:00108761 | Colorectum | MSS | lipid localization | 104/3467 | 448/18723 | 6.76e-03 | 4.38e-02 | 104 |
| GO:0051235110 | Esophagus | ESCC | maintenance of location | 200/8552 | 327/18723 | 1.01e-08 | 2.02e-07 | 200 |
| GO:000941020 | Esophagus | ESCC | response to xenobiotic stimulus | 253/8552 | 462/18723 | 4.55e-05 | 3.58e-04 | 253 |
| GO:00199155 | Esophagus | ESCC | lipid storage | 58/8552 | 87/18723 | 6.15e-05 | 4.72e-04 | 58 |
| GO:00108836 | Esophagus | ESCC | regulation of lipid storage | 36/8552 | 57/18723 | 5.87e-03 | 2.17e-02 | 36 |
| GO:000941012 | Liver | Cirrhotic | response to xenobiotic stimulus | 165/4634 | 462/18723 | 6.82e-08 | 2.09e-06 | 165 |
| Page: 1 2 3 4 |
| Pathway ID | Tissue | Disease Stage | Description | Gene Ratio | Bg Ratio | pvalue | p.adjust | qvalue | Count |
| hsa0332021 | Liver | Cirrhotic | PPAR signaling pathway | 32/2530 | 75/8465 | 1.24e-02 | 3.92e-02 | 2.42e-02 | 32 |
| hsa0332031 | Liver | Cirrhotic | PPAR signaling pathway | 32/2530 | 75/8465 | 1.24e-02 | 3.92e-02 | 2.42e-02 | 32 |
| hsa033204 | Liver | HCC | PPAR signaling pathway | 48/4020 | 75/8465 | 2.83e-03 | 9.37e-03 | 5.21e-03 | 48 |
| hsa033205 | Liver | HCC | PPAR signaling pathway | 48/4020 | 75/8465 | 2.83e-03 | 9.37e-03 | 5.21e-03 | 48 |
| hsa03320 | Stomach | GC | PPAR signaling pathway | 18/708 | 75/8465 | 3.26e-05 | 4.01e-04 | 2.82e-04 | 18 |
| hsa033201 | Stomach | GC | PPAR signaling pathway | 18/708 | 75/8465 | 3.26e-05 | 4.01e-04 | 2.82e-04 | 18 |
| hsa033202 | Stomach | SIM | PPAR signaling pathway | 15/465 | 75/8465 | 1.08e-05 | 1.42e-04 | 1.14e-04 | 15 |
| hsa033203 | Stomach | SIM | PPAR signaling pathway | 15/465 | 75/8465 | 1.08e-05 | 1.42e-04 | 1.14e-04 | 15 |
| Page: 1 |
Top |
Cell-cell communication analysis |
| Identification of potential cell-cell interactions between two cell types and their ligand-receptor pairs for different disease states |
| Ligand | Receptor | LRpair | Pathway | Tissue | Disease Stage |
| Page: 1 |
Top |
Single-cell gene regulatory network inference analysis |
| Find out the significant the regulons (TFs) and the target genes of each regulon across cell types for different disease states |
| TF | Cell Type | Tissue | Disease Stage | Target Gene | RSS | Regulon Activity |
| ∗The dot plots of a searched regulon are shown for all cell subpopulations in each disease state of each tissue based on the regulon specific score inferred using pySCENIC and by calculating the average expression. |
| Page: 1 |
Top |
Somatic mutation of malignant transformation related genes |
| Annotation of somatic variants for genes involved in malignant transformation |
| Hugo Symbol | Variant Class | Variant Classification | dbSNP RS | HGVSc | HGVSp | HGVSp Short | SWISSPROT | BIOTYPE | SIFT | PolyPhen | Tumor Sample Barcode | Tissue | Histology | Sex | Age | Stage | Therapy Types | Drugs | Outcome |
| PLIN2 | SNV | Missense_Mutation | rs143794161 | c.331N>A | p.Ala111Thr | p.A111T | Q99541 | protein_coding | tolerated(0.41) | benign(0.173) | TCGA-A8-A06P-01 | Breast | breast invasive carcinoma | Female | <65 | III/IV | Unspecific | SD | |
| PLIN2 | SNV | Missense_Mutation | c.262N>C | p.Asp88His | p.D88H | Q99541 | protein_coding | deleterious(0) | probably_damaging(0.983) | TCGA-B6-A0X1-01 | Breast | breast invasive carcinoma | Female | <65 | I/II | Unknown | Unknown | PD | |
| PLIN2 | SNV | Missense_Mutation | c.1272G>C | p.Lys424Asn | p.K424N | Q99541 | protein_coding | tolerated(0.15) | benign(0) | TCGA-E2-A1LG-01 | Breast | breast invasive carcinoma | Female | <65 | I/II | Chemotherapy | doxorubicin | SD | |
| PLIN2 | SNV | Missense_Mutation | novel | c.1178N>C | p.Val393Ala | p.V393A | Q99541 | protein_coding | tolerated(0.59) | possibly_damaging(0.827) | TCGA-2W-A8YY-01 | Cervix | cervical & endocervical cancer | Female | <65 | I/II | Chemotherapy | cisplatin | CR |
| PLIN2 | SNV | Missense_Mutation | novel | c.271G>C | p.Glu91Gln | p.E91Q | Q99541 | protein_coding | deleterious(0.03) | probably_damaging(1) | TCGA-MA-AA3Z-01 | Cervix | cervical & endocervical cancer | Female | <65 | I/II | Unknown | Unknown | SD |
| PLIN2 | SNV | Missense_Mutation | novel | c.254A>G | p.Lys85Arg | p.K85R | Q99541 | protein_coding | tolerated(0.41) | benign(0.038) | TCGA-A6-2672-01 | Colorectum | colon adenocarcinoma | Female | >=65 | III/IV | Unknown | Unknown | SD |
| PLIN2 | SNV | Missense_Mutation | c.1013A>C | p.Asn338Thr | p.N338T | Q99541 | protein_coding | deleterious(0.03) | possibly_damaging(0.624) | TCGA-AA-A00N-01 | Colorectum | colon adenocarcinoma | Male | >=65 | I/II | Unknown | Unknown | PD | |
| PLIN2 | SNV | Missense_Mutation | rs373365753 | c.795N>T | p.Lys265Asn | p.K265N | Q99541 | protein_coding | deleterious(0.02) | benign(0.202) | TCGA-AG-A002-01 | Colorectum | rectum adenocarcinoma | Male | <65 | I/II | Unknown | Unknown | SD |
| PLIN2 | deletion | Frame_Shift_Del | c.1042delG | p.Val348Ter | p.V348* | Q99541 | protein_coding | TCGA-A6-2686-01 | Colorectum | colon adenocarcinoma | Female | >=65 | I/II | Unknown | Unknown | SD | |||
| PLIN2 | SNV | Missense_Mutation | rs777495240 | c.744N>T | p.Gln248His | p.Q248H | Q99541 | protein_coding | deleterious(0.01) | benign(0.022) | TCGA-A5-A0G1-01 | Endometrium | uterine corpus endometrioid carcinoma | Female | >=65 | I/II | Unknown | Unknown | SD |
| Page: 1 2 3 4 |
Top |
Related drugs of malignant transformation related genes |
| Identification of chemicals and drugs interact with genes involved in malignant transfromation |
| (DGIdb 4.0) |
| Entrez ID | Symbol | Category | Interaction Types | Drug Claim Name | Drug Name | PMIDs |
| Page: 1 |

Copyright 2023-Present -The University of Texas Health Science Center at Houston |