
|
|||||
|
 | |
| |
| |
| |
| |
| |
|
Gene: PLGRKT |
Gene summary for PLGRKT |
| Gene information | Species | Human | Gene symbol | PLGRKT | Gene ID | 55848 |
| Gene name | plasminogen receptor with a C-terminal lysine | |
| Gene Alias | AD025 | |
| Cytomap | 9p24.1 | |
| Gene Type | protein-coding | GO ID | GO:0006508 | UniProtAcc | Q9HBL7 |
Top |
Malignant transformation analysis |
| Identification of the aberrant gene expression in precancerous and cancerous lesions by comparing the gene expression of stem-like cells in diseased tissues with normal stem cells |
| Entrez ID | Symbol | Replicates | Species | Organ | Tissue | Adj P-value | Log2FC | Malignancy |
| 55848 | PLGRKT | LZE2T | Human | Esophagus | ESCC | 9.40e-04 | 4.77e-01 | 0.082 |
| 55848 | PLGRKT | LZE4T | Human | Esophagus | ESCC | 1.24e-08 | 1.57e-01 | 0.0811 |
| 55848 | PLGRKT | LZE7T | Human | Esophagus | ESCC | 6.98e-10 | 5.75e-01 | 0.0667 |
| 55848 | PLGRKT | LZE8T | Human | Esophagus | ESCC | 9.86e-06 | 3.21e-01 | 0.067 |
| 55848 | PLGRKT | LZE24T | Human | Esophagus | ESCC | 1.71e-17 | 4.82e-01 | 0.0596 |
| 55848 | PLGRKT | LZE6T | Human | Esophagus | ESCC | 5.13e-03 | 1.81e-01 | 0.0845 |
| 55848 | PLGRKT | P1T-E | Human | Esophagus | ESCC | 1.10e-02 | 2.29e-01 | 0.0875 |
| 55848 | PLGRKT | P2T-E | Human | Esophagus | ESCC | 1.18e-26 | 6.17e-01 | 0.1177 |
| 55848 | PLGRKT | P4T-E | Human | Esophagus | ESCC | 7.88e-24 | 6.57e-01 | 0.1323 |
| 55848 | PLGRKT | P5T-E | Human | Esophagus | ESCC | 3.30e-14 | 3.48e-01 | 0.1327 |
| 55848 | PLGRKT | P8T-E | Human | Esophagus | ESCC | 3.11e-08 | 2.42e-01 | 0.0889 |
| 55848 | PLGRKT | P9T-E | Human | Esophagus | ESCC | 4.84e-31 | 8.50e-01 | 0.1131 |
| 55848 | PLGRKT | P10T-E | Human | Esophagus | ESCC | 8.39e-26 | 4.77e-01 | 0.116 |
| 55848 | PLGRKT | P11T-E | Human | Esophagus | ESCC | 6.50e-24 | 1.02e+00 | 0.1426 |
| 55848 | PLGRKT | P12T-E | Human | Esophagus | ESCC | 3.22e-15 | 3.51e-01 | 0.1122 |
| 55848 | PLGRKT | P15T-E | Human | Esophagus | ESCC | 3.28e-12 | 3.30e-01 | 0.1149 |
| 55848 | PLGRKT | P16T-E | Human | Esophagus | ESCC | 1.75e-16 | 3.93e-01 | 0.1153 |
| 55848 | PLGRKT | P17T-E | Human | Esophagus | ESCC | 6.78e-03 | 3.85e-01 | 0.1278 |
| 55848 | PLGRKT | P19T-E | Human | Esophagus | ESCC | 2.22e-11 | 9.15e-01 | 0.1662 |
| 55848 | PLGRKT | P20T-E | Human | Esophagus | ESCC | 2.52e-13 | 3.94e-01 | 0.1124 |
| Page: 1 2 3 4 5 6 |
| Tissue | Expression Dynamics | Abbreviation |
| Esophagus | 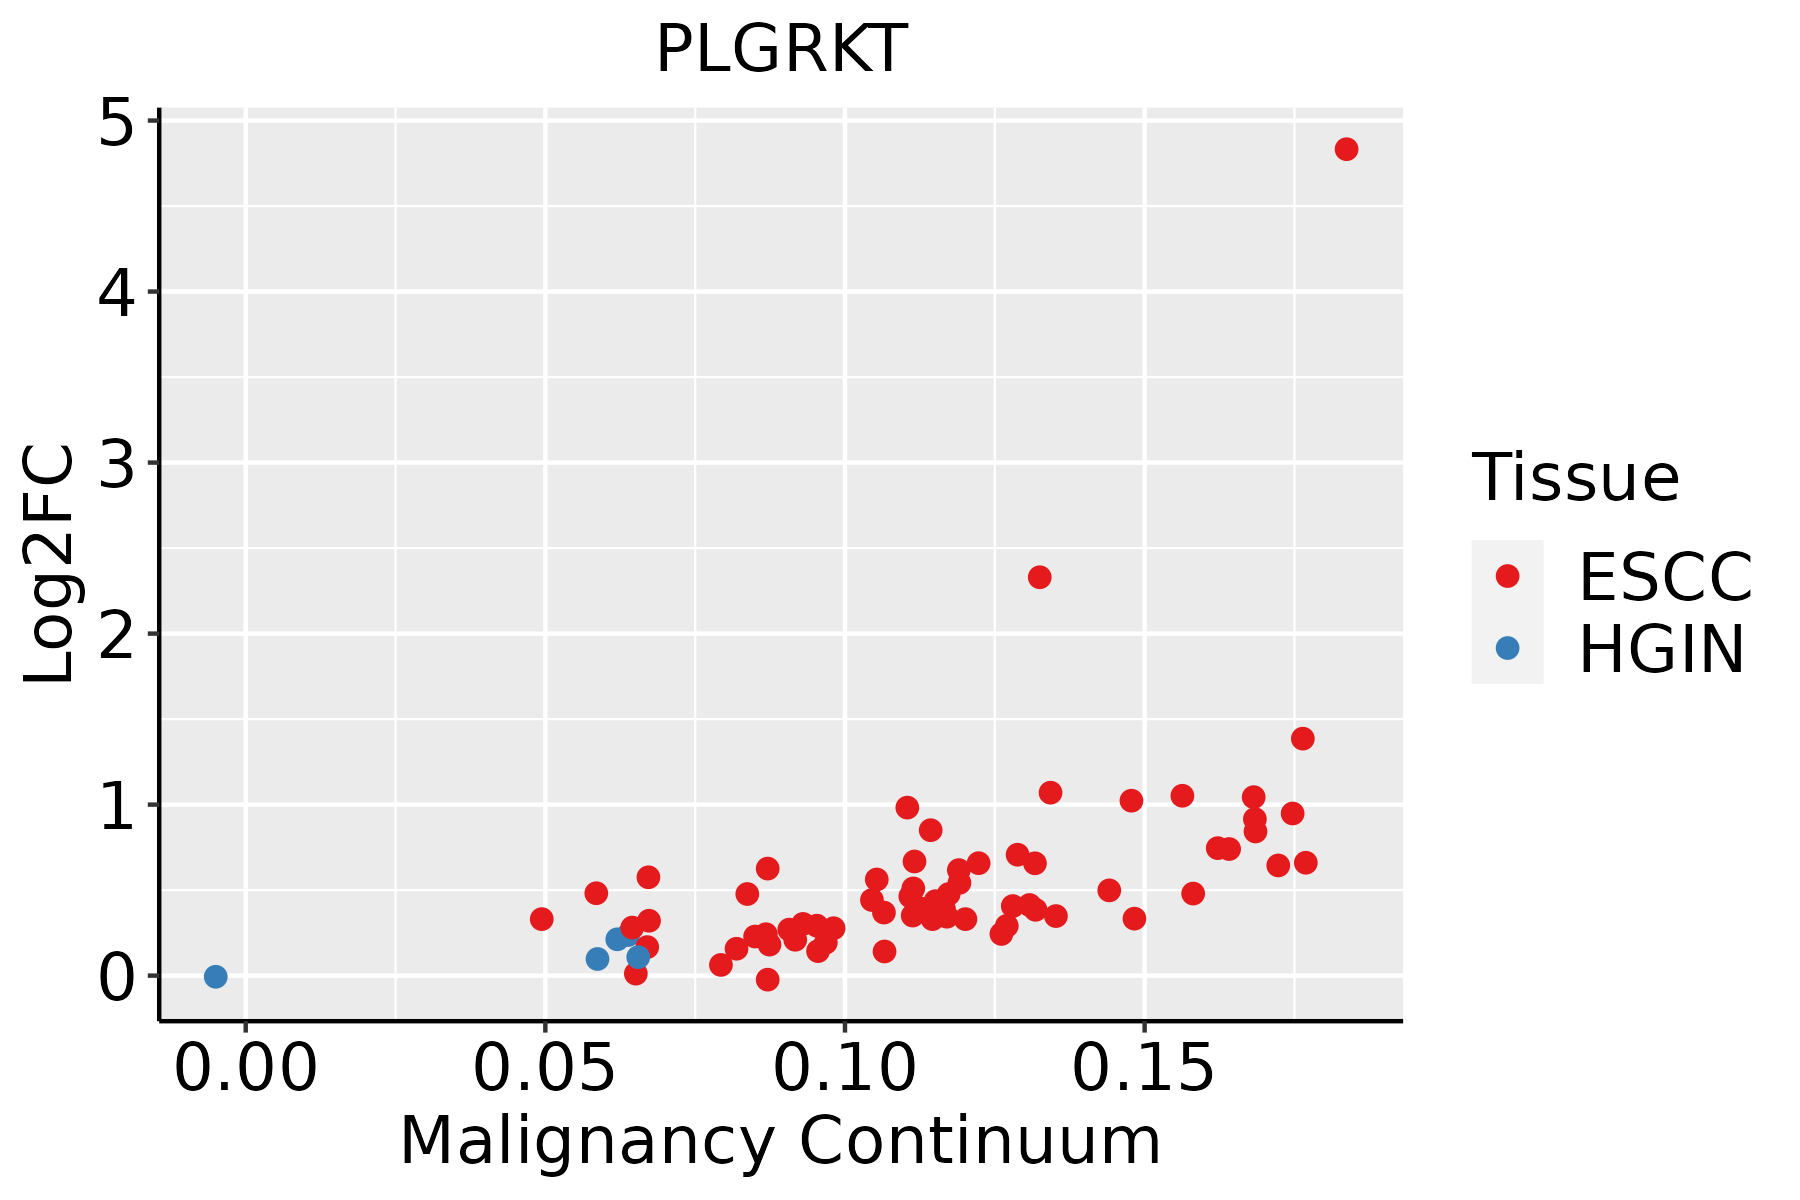 | ESCC: Esophageal squamous cell carcinoma |
| HGIN: High-grade intraepithelial neoplasias | ||
| LGIN: Low-grade intraepithelial neoplasias | ||
| Liver | 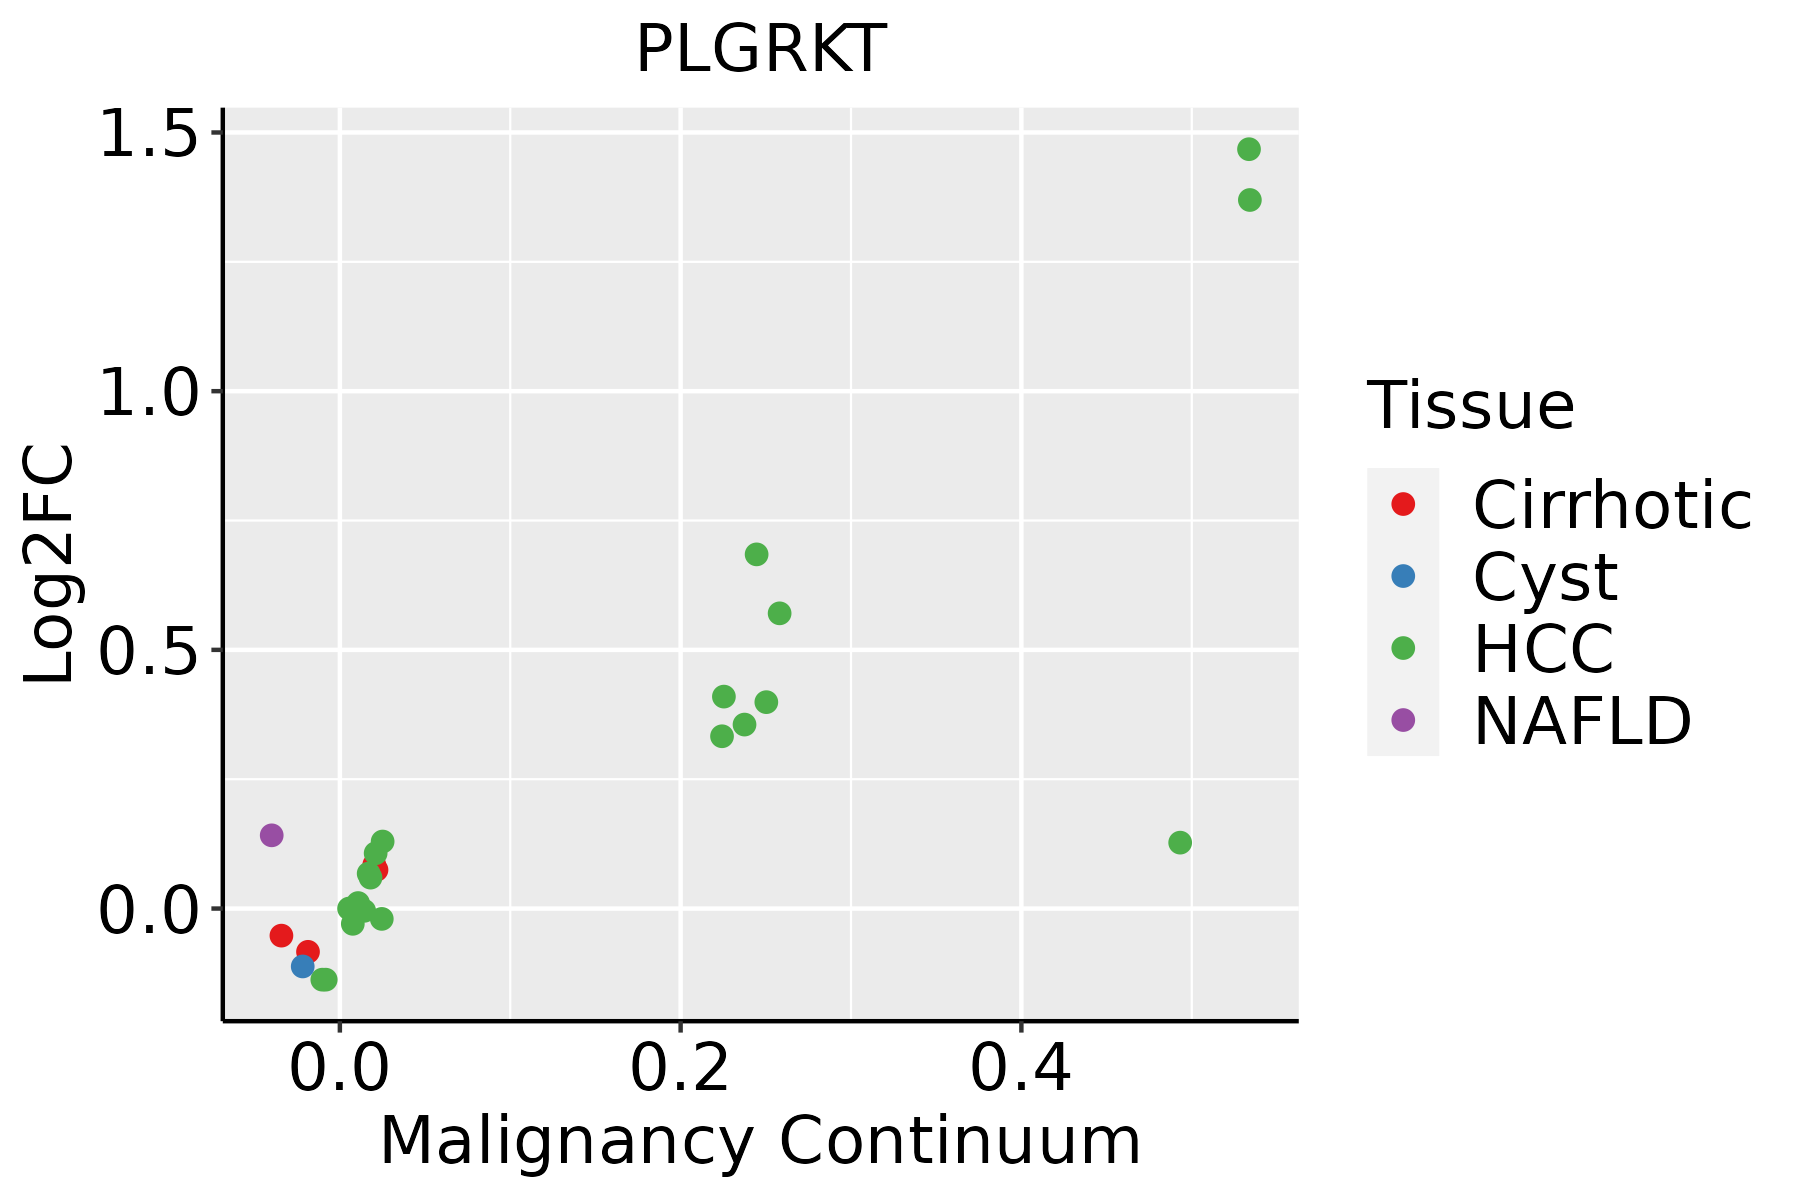 | HCC: Hepatocellular carcinoma |
| NAFLD: Non-alcoholic fatty liver disease | ||
| Oral Cavity |  | EOLP: Erosive Oral lichen planus |
| LP: leukoplakia | ||
| NEOLP: Non-erosive oral lichen planus | ||
| OSCC: Oral squamous cell carcinoma | ||
| Skin | 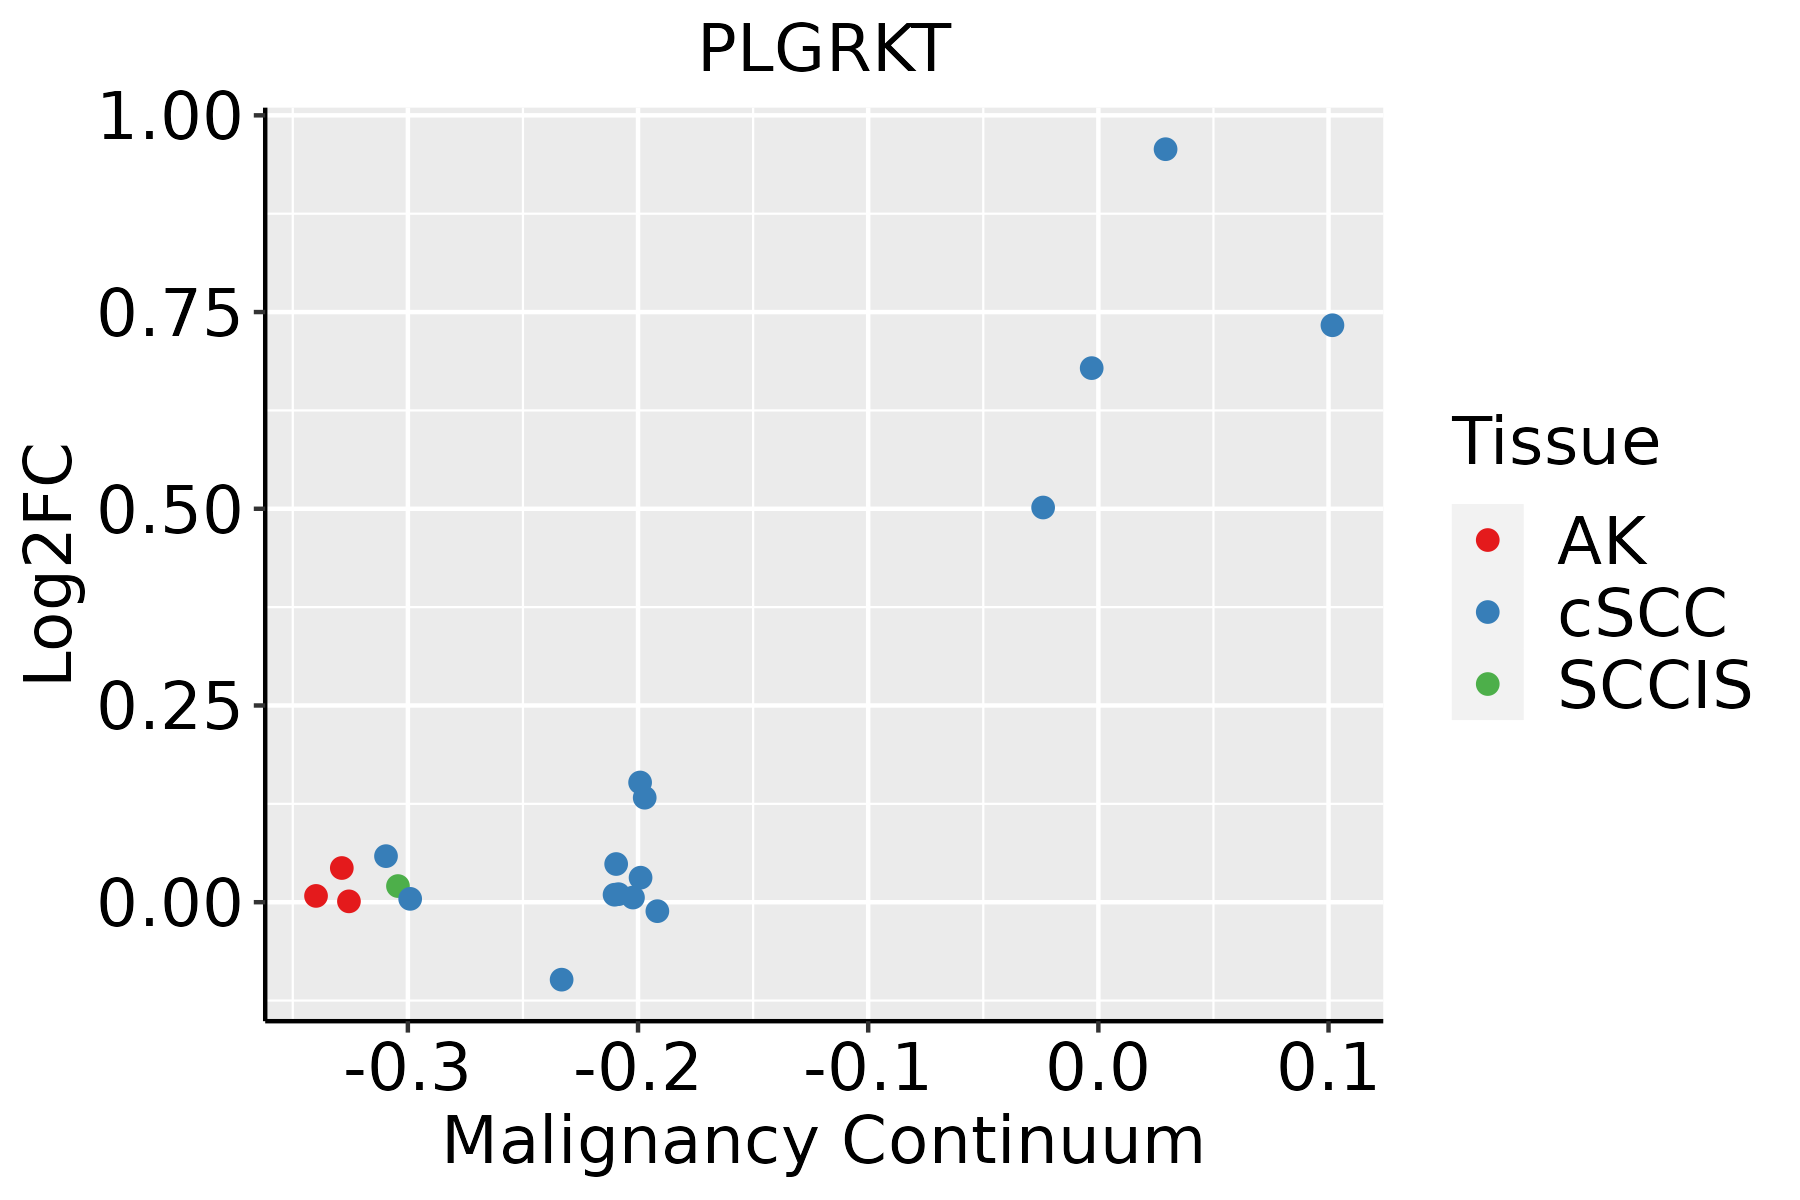 | AK: Actinic keratosis |
| cSCC: Cutaneous squamous cell carcinoma | ||
| SCCIS:squamous cell carcinoma in situ | ||
| Thyroid | 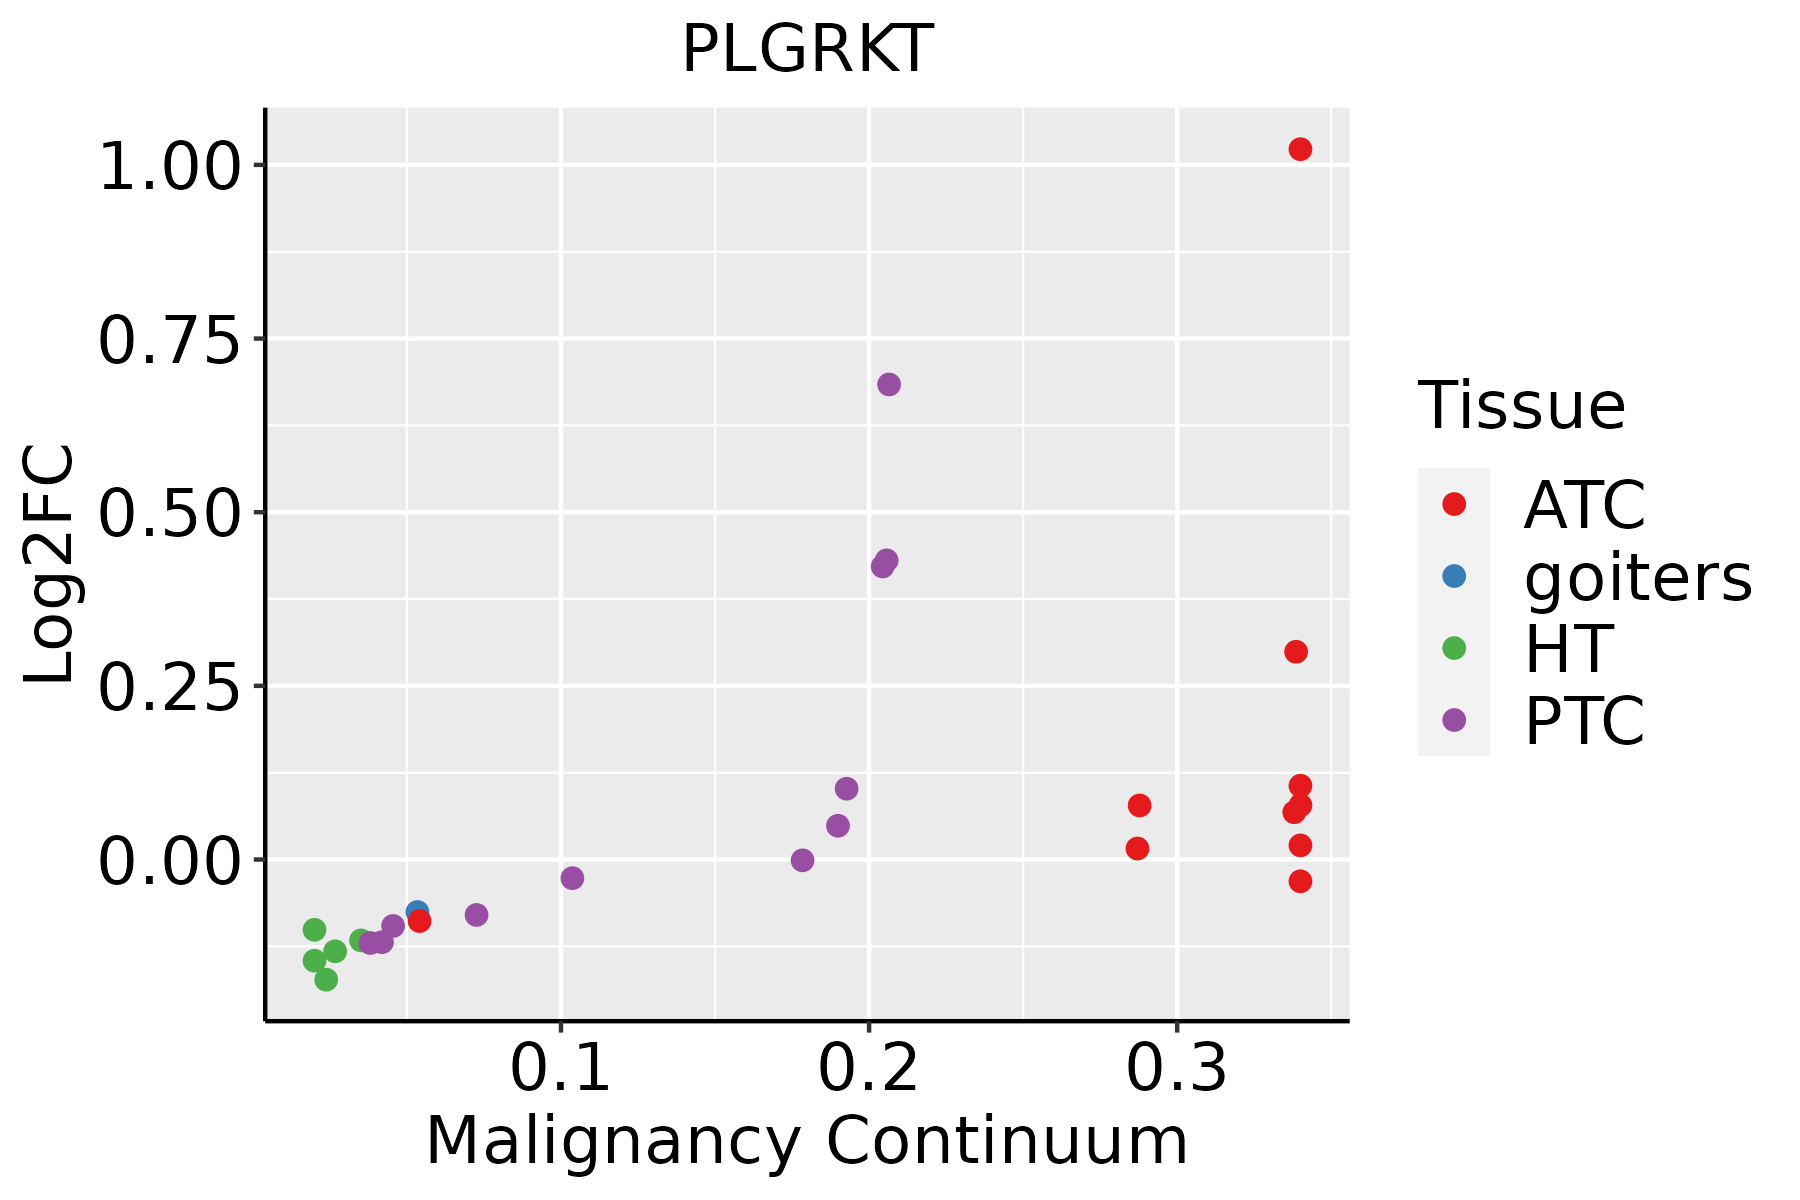 | ATC: Anaplastic thyroid cancer |
| HT: Hashimoto's thyroiditis | ||
| PTC: Papillary thyroid cancer |
| ∗log2FC in expression of this searched gene in stem-like cells from each diseased tissue sample relative to stem-like cells in normal samples in each tissue plotted against the malignancy continuum. Samples are colored based on if they are from different disease stage. |
Top |
Malignant transformation related pathway analysis |
| Find out the enriched GO biological processes and KEGG pathways involved in transition from healthy to precancer to cancer |
| Tissue | Disease Stage | Enriched GO biological Processes |
| Colorectum | AD |  |
| Colorectum | SER |  |
| Colorectum | MSS |  |
| Colorectum | MSI-H |  |
| Colorectum | FAP |  |
| ∗Top 15 enriched GO BP terms are showed in the bar plot of each disease state in each tissue. Each row represents a significant GO biological process which is colored according to the -log10(p.adjust). |
| Page: 1 2 3 4 5 6 7 8 9 |
| GO ID | Tissue | Disease Stage | Description | Gene Ratio | Bg Ratio | pvalue | p.adjust | Count |
| GO:0045862111 | Esophagus | ESCC | positive regulation of proteolysis | 256/8552 | 372/18723 | 7.88e-20 | 9.43e-18 | 256 |
| GO:005160418 | Esophagus | ESCC | protein maturation | 189/8552 | 294/18723 | 7.64e-11 | 2.39e-09 | 189 |
| GO:001648514 | Esophagus | ESCC | protein processing | 134/8552 | 225/18723 | 1.81e-05 | 1.60e-04 | 134 |
| GO:004586212 | Liver | Cirrhotic | positive regulation of proteolysis | 163/4634 | 372/18723 | 4.18e-16 | 5.14e-14 | 163 |
| GO:00516046 | Liver | Cirrhotic | protein maturation | 121/4634 | 294/18723 | 3.54e-10 | 1.68e-08 | 121 |
| GO:00316391 | Liver | Cirrhotic | plasminogen activation | 18/4634 | 24/18723 | 3.24e-07 | 7.75e-06 | 18 |
| GO:00316381 | Liver | Cirrhotic | zymogen activation | 31/4634 | 60/18723 | 6.48e-06 | 1.02e-04 | 31 |
| GO:00164853 | Liver | Cirrhotic | protein processing | 85/4634 | 225/18723 | 9.01e-06 | 1.32e-04 | 85 |
| GO:00107551 | Liver | Cirrhotic | regulation of plasminogen activation | 10/4634 | 13/18723 | 1.14e-04 | 1.14e-03 | 10 |
| GO:1903317 | Liver | Cirrhotic | regulation of protein maturation | 28/4634 | 67/18723 | 1.60e-03 | 1.04e-02 | 28 |
| GO:0070613 | Liver | Cirrhotic | regulation of protein processing | 26/4634 | 65/18723 | 4.73e-03 | 2.48e-02 | 26 |
| GO:004586222 | Liver | HCC | positive regulation of proteolysis | 232/7958 | 372/18723 | 5.66e-15 | 3.98e-13 | 232 |
| GO:005160412 | Liver | HCC | protein maturation | 171/7958 | 294/18723 | 3.80e-08 | 8.30e-07 | 171 |
| GO:00316392 | Liver | HCC | plasminogen activation | 19/7958 | 24/18723 | 2.80e-04 | 2.02e-03 | 19 |
| GO:001648511 | Liver | HCC | protein processing | 121/7958 | 225/18723 | 4.01e-04 | 2.71e-03 | 121 |
| GO:00316382 | Liver | HCC | zymogen activation | 38/7958 | 60/18723 | 9.06e-04 | 5.33e-03 | 38 |
| GO:00107552 | Liver | HCC | regulation of plasminogen activation | 11/7958 | 13/18723 | 2.38e-03 | 1.16e-02 | 11 |
| GO:19033171 | Liver | HCC | regulation of protein maturation | 39/7958 | 67/18723 | 6.84e-03 | 2.74e-02 | 39 |
| GO:00706131 | Liver | HCC | regulation of protein processing | 37/7958 | 65/18723 | 1.33e-02 | 4.77e-02 | 37 |
| GO:004586220 | Oral cavity | OSCC | positive regulation of proteolysis | 236/7305 | 372/18723 | 6.53e-22 | 1.38e-19 | 236 |
| Page: 1 2 |
| Pathway ID | Tissue | Disease Stage | Description | Gene Ratio | Bg Ratio | pvalue | p.adjust | qvalue | Count |
| Page: 1 |
Top |
Cell-cell communication analysis |
| Identification of potential cell-cell interactions between two cell types and their ligand-receptor pairs for different disease states |
| Ligand | Receptor | LRpair | Pathway | Tissue | Disease Stage |
| Page: 1 |
Top |
Single-cell gene regulatory network inference analysis |
| Find out the significant the regulons (TFs) and the target genes of each regulon across cell types for different disease states |
| TF | Cell Type | Tissue | Disease Stage | Target Gene | RSS | Regulon Activity |
| ∗The dot plots of a searched regulon are shown for all cell subpopulations in each disease state of each tissue based on the regulon specific score inferred using pySCENIC and by calculating the average expression. |
| Page: 1 |
Top |
Somatic mutation of malignant transformation related genes |
| Annotation of somatic variants for genes involved in malignant transformation |
| Hugo Symbol | Variant Class | Variant Classification | dbSNP RS | HGVSc | HGVSp | HGVSp Short | SWISSPROT | BIOTYPE | SIFT | PolyPhen | Tumor Sample Barcode | Tissue | Histology | Sex | Age | Stage | Therapy Types | Drugs | Outcome |
| PLGRKT | SNV | Missense_Mutation | novel | c.209N>T | p.Ala70Val | p.A70V | Q9HBL7 | protein_coding | tolerated(0.44) | benign(0.015) | TCGA-2W-A8YY-01 | Cervix | cervical & endocervical cancer | Female | <65 | I/II | Chemotherapy | cisplatin | CR |
| PLGRKT | SNV | Missense_Mutation | novel | c.74G>A | p.Arg25Gln | p.R25Q | Q9HBL7 | protein_coding | tolerated(0.47) | benign(0.035) | TCGA-CA-6717-01 | Colorectum | colon adenocarcinoma | Male | <65 | I/II | Chemotherapy | oxaliplatin | CR |
| PLGRKT | deletion | Frame_Shift_Del | c.183delN | p.Phe61LeufsTer8 | p.F61Lfs*8 | Q9HBL7 | protein_coding | TCGA-A6-6781-01 | Colorectum | colon adenocarcinoma | Male | <65 | III/IV | Chemotherapy | oxaliplatin | SD | |||
| PLGRKT | SNV | Missense_Mutation | novel | c.274A>T | p.Thr92Ser | p.T92S | Q9HBL7 | protein_coding | tolerated(0.25) | benign(0.01) | TCGA-AJ-A23O-01 | Endometrium | uterine corpus endometrioid carcinoma | Female | >=65 | I/II | Unknown | Unknown | SD |
| PLGRKT | SNV | Missense_Mutation | rs201380094 | c.215N>T | p.Ala72Val | p.A72V | Q9HBL7 | protein_coding | tolerated(0.28) | possibly_damaging(0.908) | TCGA-B5-A11E-01 | Endometrium | uterine corpus endometrioid carcinoma | Female | <65 | I/II | Unknown | Unknown | SD |
| PLGRKT | SNV | Missense_Mutation | rs201380094 | c.215C>T | p.Ala72Val | p.A72V | Q9HBL7 | protein_coding | tolerated(0.28) | possibly_damaging(0.908) | TCGA-D1-A17Q-01 | Endometrium | uterine corpus endometrioid carcinoma | Female | <65 | I/II | Unknown | Unknown | SD |
| PLGRKT | SNV | Missense_Mutation | novel | c.35N>A | p.Ser12Asn | p.S12N | Q9HBL7 | protein_coding | tolerated(1) | benign(0) | TCGA-FI-A2D5-01 | Endometrium | uterine corpus endometrioid carcinoma | Female | <65 | III/IV | Chemotherapy | carboplatinum | PD |
| PLGRKT | deletion | Frame_Shift_Del | c.183delT | p.Phe61LeufsTer8 | p.F61Lfs*8 | Q9HBL7 | protein_coding | TCGA-A5-A0GW-01 | Endometrium | uterine corpus endometrioid carcinoma | Female | <65 | I/II | Unknown | Unknown | SD | |||
| PLGRKT | deletion | Frame_Shift_Del | c.227delN | p.Lys76ArgfsTer12 | p.K76Rfs*12 | Q9HBL7 | protein_coding | TCGA-AP-A05N-01 | Endometrium | uterine corpus endometrioid carcinoma | Female | <65 | I/II | Unknown | Unknown | SD | |||
| PLGRKT | deletion | Frame_Shift_Del | c.227delA | p.Lys76ArgfsTer12 | p.K76Rfs*12 | Q9HBL7 | protein_coding | TCGA-BG-A18B-01 | Endometrium | uterine corpus endometrioid carcinoma | Female | <65 | I/II | Unknown | Unknown | SD |
| Page: 1 2 3 |
Top |
Related drugs of malignant transformation related genes |
| Identification of chemicals and drugs interact with genes involved in malignant transfromation |
| (DGIdb 4.0) |
| Entrez ID | Symbol | Category | Interaction Types | Drug Claim Name | Drug Name | PMIDs |
| Page: 1 |

Copyright 2023-Present -The University of Texas Health Science Center at Houston |