
|
|||||
|
 | |
| |
| |
| |
| |
| |
|
Gene: PLGLB2 |
Gene summary for PLGLB2 |
| Gene information | Species | Human | Gene symbol | PLGLB2 | Gene ID | 5342 |
| Gene name | plasminogen like B2 | |
| Gene Alias | PLGLA | |
| Cytomap | 2p11.2 | |
| Gene Type | protein-coding | GO ID | GO:0006508 | UniProtAcc | Q02325 |
Top |
Malignant transformation analysis |
| Identification of the aberrant gene expression in precancerous and cancerous lesions by comparing the gene expression of stem-like cells in diseased tissues with normal stem cells |
| Entrez ID | Symbol | Replicates | Species | Organ | Tissue | Adj P-value | Log2FC | Malignancy |
| 5342 | PLGLB2 | HCC1_Meng | Human | Liver | HCC | 3.31e-56 | 2.11e-01 | 0.0246 |
| 5342 | PLGLB2 | S027 | Human | Liver | HCC | 4.07e-09 | 8.94e-01 | 0.2446 |
| 5342 | PLGLB2 | S028 | Human | Liver | HCC | 2.23e-09 | 3.72e-01 | 0.2503 |
| 5342 | PLGLB2 | S029 | Human | Liver | HCC | 1.12e-34 | 1.45e+00 | 0.2581 |
| Page: 1 |
| Tissue | Expression Dynamics | Abbreviation |
| Liver | 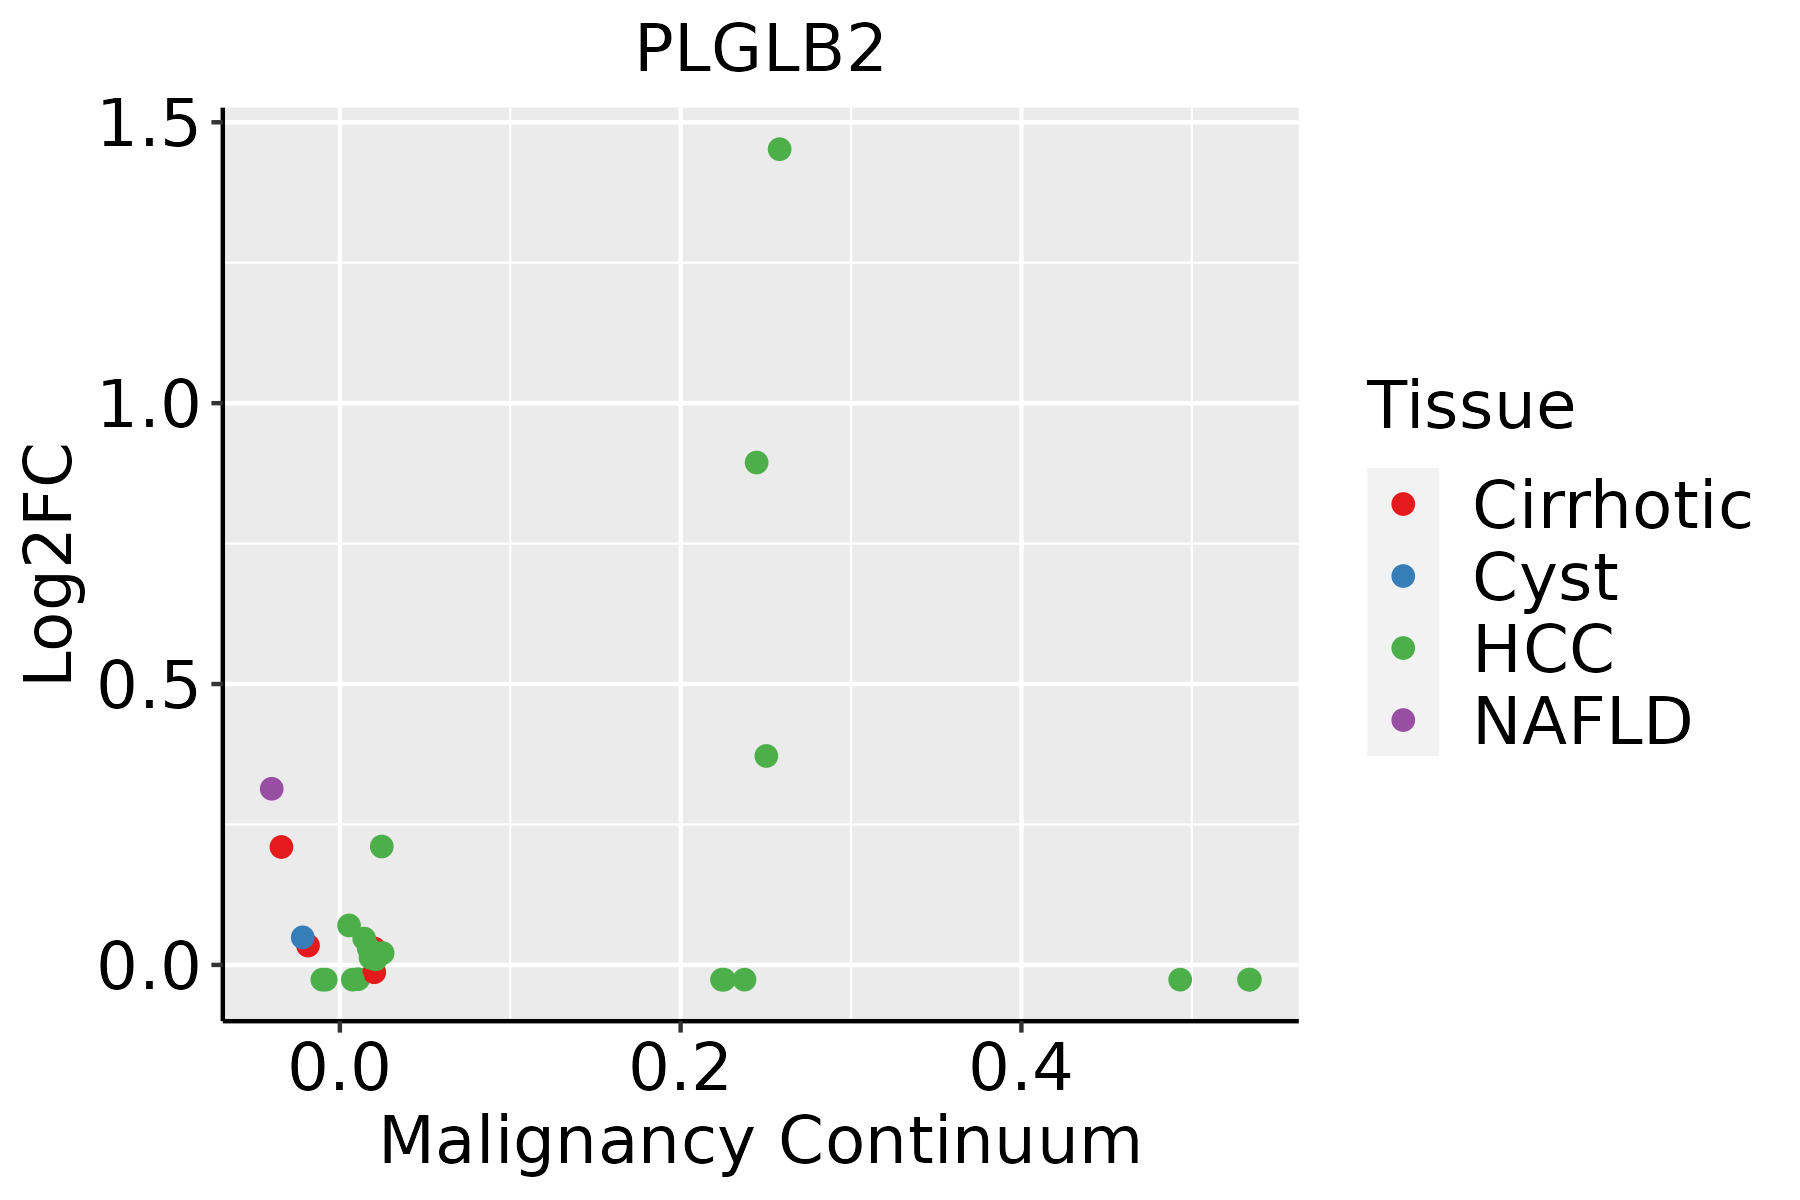 | HCC: Hepatocellular carcinoma |
| NAFLD: Non-alcoholic fatty liver disease |
| ∗log2FC in expression of this searched gene in stem-like cells from each diseased tissue sample relative to stem-like cells in normal samples in each tissue plotted against the malignancy continuum. Samples are colored based on if they are from different disease stage. |
Top |
Malignant transformation related pathway analysis |
| Find out the enriched GO biological processes and KEGG pathways involved in transition from healthy to precancer to cancer |
| Tissue | Disease Stage | Enriched GO biological Processes |
| Colorectum | AD |  |
| Colorectum | SER |  |
| Colorectum | MSS |  |
| Colorectum | MSI-H |  |
| Colorectum | FAP |  |
| ∗Top 15 enriched GO BP terms are showed in the bar plot of each disease state in each tissue. Each row represents a significant GO biological process which is colored according to the -log10(p.adjust). |
| Page: 1 2 3 4 5 6 7 8 9 |
| GO ID | Tissue | Disease Stage | Description | Gene Ratio | Bg Ratio | pvalue | p.adjust | Count |
| GO:001056322 | Liver | HCC | negative regulation of phosphorus metabolic process | 259/7958 | 442/18723 | 4.29e-12 | 1.92e-10 | 259 |
| GO:004593622 | Liver | HCC | negative regulation of phosphate metabolic process | 258/7958 | 441/18723 | 6.00e-12 | 2.60e-10 | 258 |
| GO:004232622 | Liver | HCC | negative regulation of phosphorylation | 227/7958 | 385/18723 | 3.98e-11 | 1.52e-09 | 227 |
| GO:005134822 | Liver | HCC | negative regulation of transferase activity | 166/7958 | 268/18723 | 8.97e-11 | 3.18e-09 | 166 |
| GO:003367322 | Liver | HCC | negative regulation of kinase activity | 144/7958 | 237/18723 | 9.76e-09 | 2.45e-07 | 144 |
| GO:00192162 | Liver | HCC | regulation of lipid metabolic process | 181/7958 | 331/18723 | 4.58e-06 | 5.79e-05 | 181 |
| Page: 1 |
| Pathway ID | Tissue | Disease Stage | Description | Gene Ratio | Bg Ratio | pvalue | p.adjust | qvalue | Count |
| Page: 1 |
Top |
Cell-cell communication analysis |
| Identification of potential cell-cell interactions between two cell types and their ligand-receptor pairs for different disease states |
| Ligand | Receptor | LRpair | Pathway | Tissue | Disease Stage |
| Page: 1 |
Top |
Single-cell gene regulatory network inference analysis |
| Find out the significant the regulons (TFs) and the target genes of each regulon across cell types for different disease states |
| TF | Cell Type | Tissue | Disease Stage | Target Gene | RSS | Regulon Activity |
| ∗The dot plots of a searched regulon are shown for all cell subpopulations in each disease state of each tissue based on the regulon specific score inferred using pySCENIC and by calculating the average expression. |
| Page: 1 |
Top |
Somatic mutation of malignant transformation related genes |
| Annotation of somatic variants for genes involved in malignant transformation |
| Hugo Symbol | Variant Class | Variant Classification | dbSNP RS | HGVSc | HGVSp | HGVSp Short | SWISSPROT | BIOTYPE | SIFT | PolyPhen | Tumor Sample Barcode | Tissue | Histology | Sex | Age | Stage | Therapy Types | Drugs | Outcome |
| PLGLB2 | SNV | Missense_Mutation | novel | c.234N>T | p.Glu78Asp | p.E78D | Q02325 | protein_coding | tolerated(0.09) | benign(0.058) | TCGA-A5-A0GP-01 | Endometrium | uterine corpus endometrioid carcinoma | Female | <65 | I/II | Unknown | Unknown | SD |
| PLGLB2 | SNV | Missense_Mutation | novel | c.226N>C | p.Met76Leu | p.M76L | Q02325 | protein_coding | tolerated(0.91) | benign(0.001) | TCGA-AJ-A5DW-01 | Endometrium | uterine corpus endometrioid carcinoma | Female | <65 | I/II | Unknown | Unknown | SD |
| PLGLB2 | SNV | Missense_Mutation | novel | c.22C>T | p.Leu8Phe | p.L8F | Q02325 | protein_coding | tolerated(0.5) | benign(0.007) | TCGA-AX-A2HC-01 | Endometrium | uterine corpus endometrioid carcinoma | Female | <65 | III/IV | Chemotherapy | paclitaxel | PD |
| PLGLB2 | SNV | Missense_Mutation | novel | c.22C>T | p.Leu8Phe | p.L8F | Q02325 | protein_coding | tolerated(0.5) | benign(0.007) | TCGA-BS-A0UV-01 | Endometrium | uterine corpus endometrioid carcinoma | Female | <65 | III/IV | Unknown | Unknown | SD |
| PLGLB2 | insertion | In_Frame_Ins | novel | c.38_39insCCC | p.Phe13_Leu14insPro | p.F13_L14insP | Q02325 | protein_coding | TCGA-AP-A0LM-01 | Endometrium | uterine corpus endometrioid carcinoma | Female | <65 | III/IV | Chemotherapy | cisplatin | SD | ||
| PLGLB2 | insertion | In_Frame_Ins | novel | c.38_39insCCC | p.Phe13_Leu14insPro | p.F13_L14insP | Q02325 | protein_coding | TCGA-B5-A11F-01 | Endometrium | uterine corpus endometrioid carcinoma | Female | <65 | I/II | Hormone Therapy | megace | SD | ||
| PLGLB2 | SNV | Missense_Mutation | novel | c.256N>G | p.Ile86Val | p.I86V | Q02325 | protein_coding | tolerated(0.6) | benign(0) | TCGA-22-5481-01 | Lung | lung squamous cell carcinoma | Female | >=65 | I/II | Unknown | Unknown | PD |
| PLGLB2 | SNV | Missense_Mutation | novel | c.251T>C | p.Ile84Thr | p.I84T | Q02325 | protein_coding | tolerated(0.73) | benign(0) | TCGA-92-7340-01 | Lung | lung squamous cell carcinoma | Female | <65 | I/II | Chemotherapy | cisplatin | SD |
| Page: 1 |
Top |
Related drugs of malignant transformation related genes |
| Identification of chemicals and drugs interact with genes involved in malignant transfromation |
| (DGIdb 4.0) |
| Entrez ID | Symbol | Category | Interaction Types | Drug Claim Name | Drug Name | PMIDs |
| Page: 1 |

Copyright 2023-Present -The University of Texas Health Science Center at Houston |