
|
|||||
|
 | |
| |
| |
| |
| |
| |
|
Gene: PLEKHO1 |
Gene summary for PLEKHO1 |
| Gene information | Species | Human | Gene symbol | PLEKHO1 | Gene ID | 51177 |
| Gene name | pleckstrin homology domain containing O1 | |
| Gene Alias | CKIP-1 | |
| Cytomap | 1q21.2 | |
| Gene Type | protein-coding | GO ID | GO:0000768 | UniProtAcc | Q53GL0 |
Top |
Malignant transformation analysis |
| Identification of the aberrant gene expression in precancerous and cancerous lesions by comparing the gene expression of stem-like cells in diseased tissues with normal stem cells |
| Entrez ID | Symbol | Replicates | Species | Organ | Tissue | Adj P-value | Log2FC | Malignancy |
| 51177 | PLEKHO1 | LZE7T | Human | Esophagus | ESCC | 1.18e-02 | 1.68e-01 | 0.0667 |
| 51177 | PLEKHO1 | LZE22T | Human | Esophagus | ESCC | 2.24e-02 | 4.13e-01 | 0.068 |
| 51177 | PLEKHO1 | LZE24T | Human | Esophagus | ESCC | 1.80e-09 | 2.19e-01 | 0.0596 |
| 51177 | PLEKHO1 | P1T-E | Human | Esophagus | ESCC | 3.71e-04 | 2.32e-01 | 0.0875 |
| 51177 | PLEKHO1 | P2T-E | Human | Esophagus | ESCC | 3.87e-29 | 5.80e-01 | 0.1177 |
| 51177 | PLEKHO1 | P4T-E | Human | Esophagus | ESCC | 1.50e-21 | 4.27e-01 | 0.1323 |
| 51177 | PLEKHO1 | P5T-E | Human | Esophagus | ESCC | 4.59e-05 | 1.22e-01 | 0.1327 |
| 51177 | PLEKHO1 | P8T-E | Human | Esophagus | ESCC | 3.08e-05 | 1.45e-01 | 0.0889 |
| 51177 | PLEKHO1 | P9T-E | Human | Esophagus | ESCC | 1.00e-20 | 4.99e-01 | 0.1131 |
| 51177 | PLEKHO1 | P10T-E | Human | Esophagus | ESCC | 3.82e-27 | 3.90e-01 | 0.116 |
| 51177 | PLEKHO1 | P11T-E | Human | Esophagus | ESCC | 5.63e-05 | 2.10e-01 | 0.1426 |
| 51177 | PLEKHO1 | P12T-E | Human | Esophagus | ESCC | 3.14e-18 | 2.98e-01 | 0.1122 |
| 51177 | PLEKHO1 | P15T-E | Human | Esophagus | ESCC | 1.37e-14 | 2.30e-01 | 0.1149 |
| 51177 | PLEKHO1 | P16T-E | Human | Esophagus | ESCC | 5.00e-17 | 2.84e-01 | 0.1153 |
| 51177 | PLEKHO1 | P17T-E | Human | Esophagus | ESCC | 3.54e-04 | 1.79e-01 | 0.1278 |
| 51177 | PLEKHO1 | P19T-E | Human | Esophagus | ESCC | 1.45e-02 | 3.48e-01 | 0.1662 |
| 51177 | PLEKHO1 | P20T-E | Human | Esophagus | ESCC | 1.87e-05 | 1.57e-01 | 0.1124 |
| 51177 | PLEKHO1 | P21T-E | Human | Esophagus | ESCC | 9.17e-04 | 9.39e-02 | 0.1617 |
| 51177 | PLEKHO1 | P22T-E | Human | Esophagus | ESCC | 1.01e-27 | 3.69e-01 | 0.1236 |
| 51177 | PLEKHO1 | P23T-E | Human | Esophagus | ESCC | 1.26e-10 | 3.22e-01 | 0.108 |
| Page: 1 2 3 4 |
| Tissue | Expression Dynamics | Abbreviation |
| Esophagus | 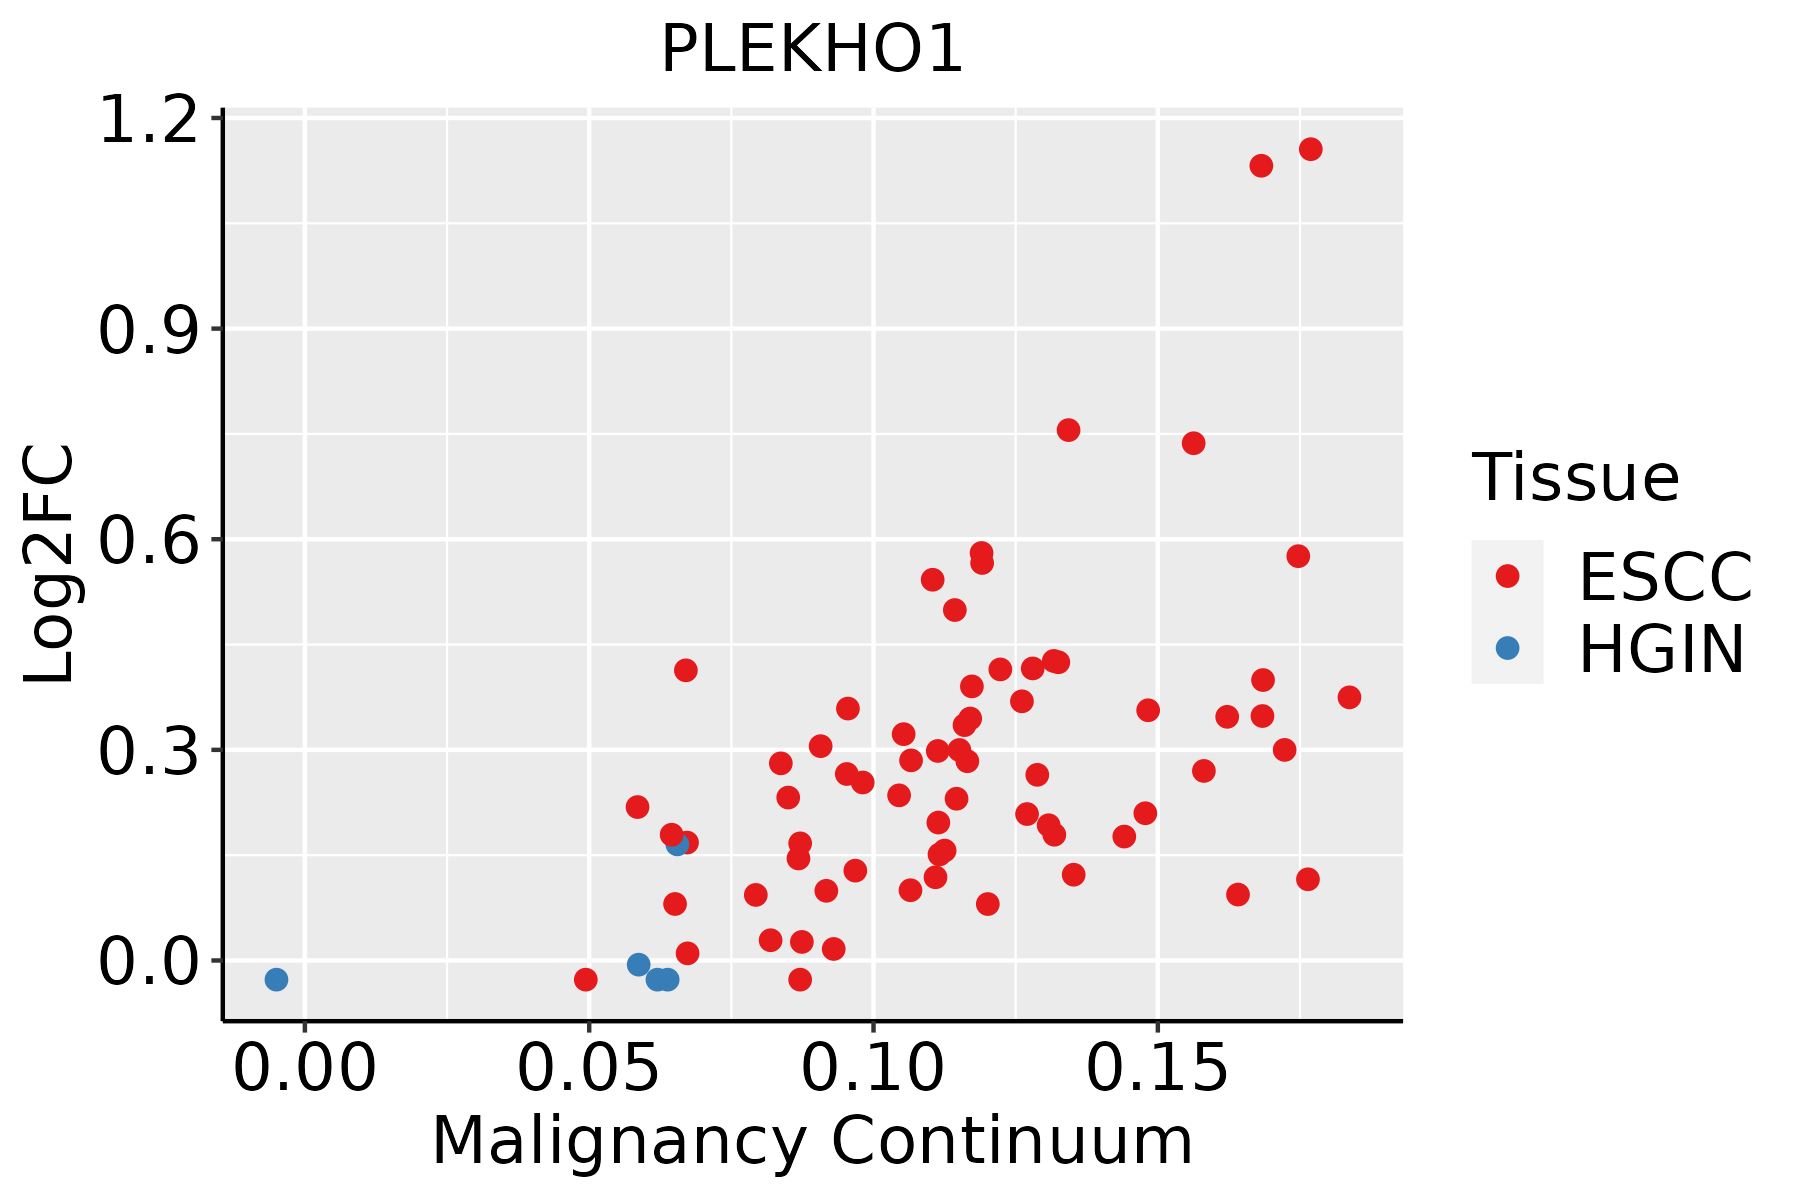 | ESCC: Esophageal squamous cell carcinoma |
| HGIN: High-grade intraepithelial neoplasias | ||
| LGIN: Low-grade intraepithelial neoplasias | ||
| Thyroid |  | ATC: Anaplastic thyroid cancer |
| HT: Hashimoto's thyroiditis | ||
| PTC: Papillary thyroid cancer |
| ∗log2FC in expression of this searched gene in stem-like cells from each diseased tissue sample relative to stem-like cells in normal samples in each tissue plotted against the malignancy continuum. Samples are colored based on if they are from different disease stage. |
Top |
Malignant transformation related pathway analysis |
| Find out the enriched GO biological processes and KEGG pathways involved in transition from healthy to precancer to cancer |
| Tissue | Disease Stage | Enriched GO biological Processes |
| Colorectum | AD |  |
| Colorectum | SER |  |
| Colorectum | MSS |  |
| Colorectum | MSI-H |  |
| Colorectum | FAP |  |
| ∗Top 15 enriched GO BP terms are showed in the bar plot of each disease state in each tissue. Each row represents a significant GO biological process which is colored according to the -log10(p.adjust). |
| Page: 1 2 3 4 5 6 7 8 9 |
| GO ID | Tissue | Disease Stage | Description | Gene Ratio | Bg Ratio | pvalue | p.adjust | Count |
| GO:002260420 | Esophagus | ESCC | regulation of cell morphogenesis | 180/8552 | 309/18723 | 5.19e-06 | 5.45e-05 | 180 |
| GO:000836018 | Esophagus | ESCC | regulation of cell shape | 92/8552 | 154/18723 | 3.00e-04 | 1.81e-03 | 92 |
| GO:00726735 | Esophagus | ESCC | lamellipodium morphogenesis | 14/8552 | 17/18723 | 2.22e-03 | 9.78e-03 | 14 |
| GO:009758116 | Esophagus | ESCC | lamellipodium organization | 53/8552 | 90/18723 | 7.92e-03 | 2.82e-02 | 53 |
| GO:0022604112 | Thyroid | PTC | regulation of cell morphogenesis | 165/5968 | 309/18723 | 2.60e-15 | 1.82e-13 | 165 |
| GO:0008360111 | Thyroid | PTC | regulation of cell shape | 86/5968 | 154/18723 | 6.22e-10 | 1.95e-08 | 86 |
| GO:009758119 | Thyroid | PTC | lamellipodium organization | 44/5968 | 90/18723 | 5.59e-04 | 3.56e-03 | 44 |
| GO:001481212 | Thyroid | PTC | muscle cell migration | 50/5968 | 110/18723 | 1.93e-03 | 1.04e-02 | 50 |
| GO:002260429 | Thyroid | ATC | regulation of cell morphogenesis | 171/6293 | 309/18723 | 2.36e-15 | 1.70e-13 | 171 |
| GO:000836026 | Thyroid | ATC | regulation of cell shape | 91/6293 | 154/18723 | 7.33e-11 | 2.31e-09 | 91 |
| GO:004269216 | Thyroid | ATC | muscle cell differentiation | 165/6293 | 384/18723 | 7.17e-05 | 5.46e-04 | 165 |
| GO:0097581110 | Thyroid | ATC | lamellipodium organization | 48/6293 | 90/18723 | 8.92e-05 | 6.59e-04 | 48 |
| GO:001481221 | Thyroid | ATC | muscle cell migration | 54/6293 | 110/18723 | 5.47e-04 | 3.16e-03 | 54 |
| GO:005114617 | Thyroid | ATC | striated muscle cell differentiation | 119/6293 | 283/18723 | 1.74e-03 | 8.70e-03 | 119 |
| Page: 1 |
| Pathway ID | Tissue | Disease Stage | Description | Gene Ratio | Bg Ratio | pvalue | p.adjust | qvalue | Count |
| Page: 1 |
Top |
Cell-cell communication analysis |
| Identification of potential cell-cell interactions between two cell types and their ligand-receptor pairs for different disease states |
| Ligand | Receptor | LRpair | Pathway | Tissue | Disease Stage |
| Page: 1 |
Top |
Single-cell gene regulatory network inference analysis |
| Find out the significant the regulons (TFs) and the target genes of each regulon across cell types for different disease states |
| TF | Cell Type | Tissue | Disease Stage | Target Gene | RSS | Regulon Activity |
| ∗The dot plots of a searched regulon are shown for all cell subpopulations in each disease state of each tissue based on the regulon specific score inferred using pySCENIC and by calculating the average expression. |
| Page: 1 |
Top |
Somatic mutation of malignant transformation related genes |
| Annotation of somatic variants for genes involved in malignant transformation |
| Hugo Symbol | Variant Class | Variant Classification | dbSNP RS | HGVSc | HGVSp | HGVSp Short | SWISSPROT | BIOTYPE | SIFT | PolyPhen | Tumor Sample Barcode | Tissue | Histology | Sex | Age | Stage | Therapy Types | Drugs | Outcome |
| PLEKHO1 | SNV | Missense_Mutation | c.184N>C | p.Asp62His | p.D62H | Q53GL0 | protein_coding | deleterious(0) | possibly_damaging(0.665) | TCGA-EK-A2RJ-01 | Cervix | cervical & endocervical cancer | Female | <65 | I/II | Unknown | Unknown | SD | |
| PLEKHO1 | SNV | Missense_Mutation | rs782338607 | c.622C>T | p.Arg208Trp | p.R208W | Q53GL0 | protein_coding | deleterious(0) | probably_damaging(0.965) | TCGA-FU-A40J-01 | Cervix | cervical & endocervical cancer | Female | <65 | III/IV | Chemotherapy | carboplatin | CR |
| PLEKHO1 | SNV | Missense_Mutation | novel | c.386N>G | p.Ser129Cys | p.S129C | Q53GL0 | protein_coding | deleterious(0.03) | probably_damaging(0.956) | TCGA-VS-A8EL-01 | Cervix | cervical & endocervical cancer | Female | <65 | I/II | Chemotherapy | cisplatin | CR |
| PLEKHO1 | SNV | Missense_Mutation | novel | c.464N>C | p.Arg155Pro | p.R155P | Q53GL0 | protein_coding | deleterious(0) | probably_damaging(0.997) | TCGA-VS-A9UY-01 | Cervix | cervical & endocervical cancer | Female | <65 | I/II | Chemotherapy | cisplatin | PD |
| PLEKHO1 | SNV | Missense_Mutation | c.674N>A | p.Ala225Glu | p.A225E | Q53GL0 | protein_coding | deleterious(0.01) | benign(0.233) | TCGA-A6-A566-01 | Colorectum | colon adenocarcinoma | Female | <65 | III/IV | Chemotherapy | oxaliplatin | PD | |
| PLEKHO1 | SNV | Missense_Mutation | novel | c.1083G>T | p.Glu361Asp | p.E361D | Q53GL0 | protein_coding | deleterious(0) | benign(0.433) | TCGA-AA-3710-01 | Colorectum | colon adenocarcinoma | Female | >=65 | I/II | Unknown | Unknown | SD |
| PLEKHO1 | SNV | Missense_Mutation | novel | c.1211N>G | p.Tyr404Cys | p.Y404C | Q53GL0 | protein_coding | deleterious_low_confidence(0.01) | possibly_damaging(0.819) | TCGA-AA-3947-01 | Colorectum | colon adenocarcinoma | Female | <65 | I/II | Unknown | Unknown | SD |
| PLEKHO1 | SNV | Missense_Mutation | rs782430585 | c.1214G>A | p.Arg405Gln | p.R405Q | Q53GL0 | protein_coding | deleterious_low_confidence(0) | possibly_damaging(0.662) | TCGA-AA-A022-01 | Colorectum | colon adenocarcinoma | Female | >=65 | I/II | Unknown | Unknown | SD |
| PLEKHO1 | SNV | Missense_Mutation | c.1011N>T | p.Lys337Asn | p.K337N | Q53GL0 | protein_coding | tolerated(0.06) | possibly_damaging(0.549) | TCGA-NH-A5IV-01 | Colorectum | colon adenocarcinoma | Female | >=65 | I/II | Unknown | Unknown | SD | |
| PLEKHO1 | SNV | Missense_Mutation | rs782519422 | c.835C>T | p.Arg279Trp | p.R279W | Q53GL0 | protein_coding | tolerated(0.05) | possibly_damaging(0.798) | TCGA-AG-A02N-01 | Colorectum | rectum adenocarcinoma | Male | >=65 | I/II | Chemotherapy | folinic | CR |
| Page: 1 2 3 4 5 |
Top |
Related drugs of malignant transformation related genes |
| Identification of chemicals and drugs interact with genes involved in malignant transfromation |
| (DGIdb 4.0) |
| Entrez ID | Symbol | Category | Interaction Types | Drug Claim Name | Drug Name | PMIDs |
| Page: 1 |

Copyright 2023-Present -The University of Texas Health Science Center at Houston |