
|
|||||
|
 | |
| |
| |
| |
| |
| |
|
Gene: PLEKHN1 |
Gene summary for PLEKHN1 |
| Gene information | Species | Human | Gene symbol | PLEKHN1 | Gene ID | 84069 |
| Gene name | pleckstrin homology domain containing N1 | |
| Gene Alias | CLPABP | |
| Cytomap | 1p36.33 | |
| Gene Type | protein-coding | GO ID | GO:0001666 | UniProtAcc | Q494U1 |
Top |
Malignant transformation analysis |
| Identification of the aberrant gene expression in precancerous and cancerous lesions by comparing the gene expression of stem-like cells in diseased tissues with normal stem cells |
| Entrez ID | Symbol | Replicates | Species | Organ | Tissue | Adj P-value | Log2FC | Malignancy |
| 84069 | PLEKHN1 | C21 | Human | Oral cavity | OSCC | 5.83e-15 | 5.17e-01 | 0.2678 |
| 84069 | PLEKHN1 | C30 | Human | Oral cavity | OSCC | 8.90e-06 | 2.51e-01 | 0.3055 |
| 84069 | PLEKHN1 | C57 | Human | Oral cavity | OSCC | 3.10e-16 | 5.48e-01 | 0.1679 |
| 84069 | PLEKHN1 | C09 | Human | Oral cavity | OSCC | 1.36e-06 | 2.18e-01 | 0.1431 |
| 84069 | PLEKHN1 | SYSMH1 | Human | Oral cavity | OSCC | 4.95e-02 | 9.86e-02 | 0.1127 |
| 84069 | PLEKHN1 | SYSMH2 | Human | Oral cavity | OSCC | 3.06e-04 | 1.95e-01 | 0.2326 |
| 84069 | PLEKHN1 | SYSMH3 | Human | Oral cavity | OSCC | 1.22e-07 | 2.48e-01 | 0.2442 |
| 84069 | PLEKHN1 | SYSMH5 | Human | Oral cavity | OSCC | 5.39e-05 | 1.44e-01 | 0.0647 |
| Page: 1 |
| Tissue | Expression Dynamics | Abbreviation |
| Oral Cavity | 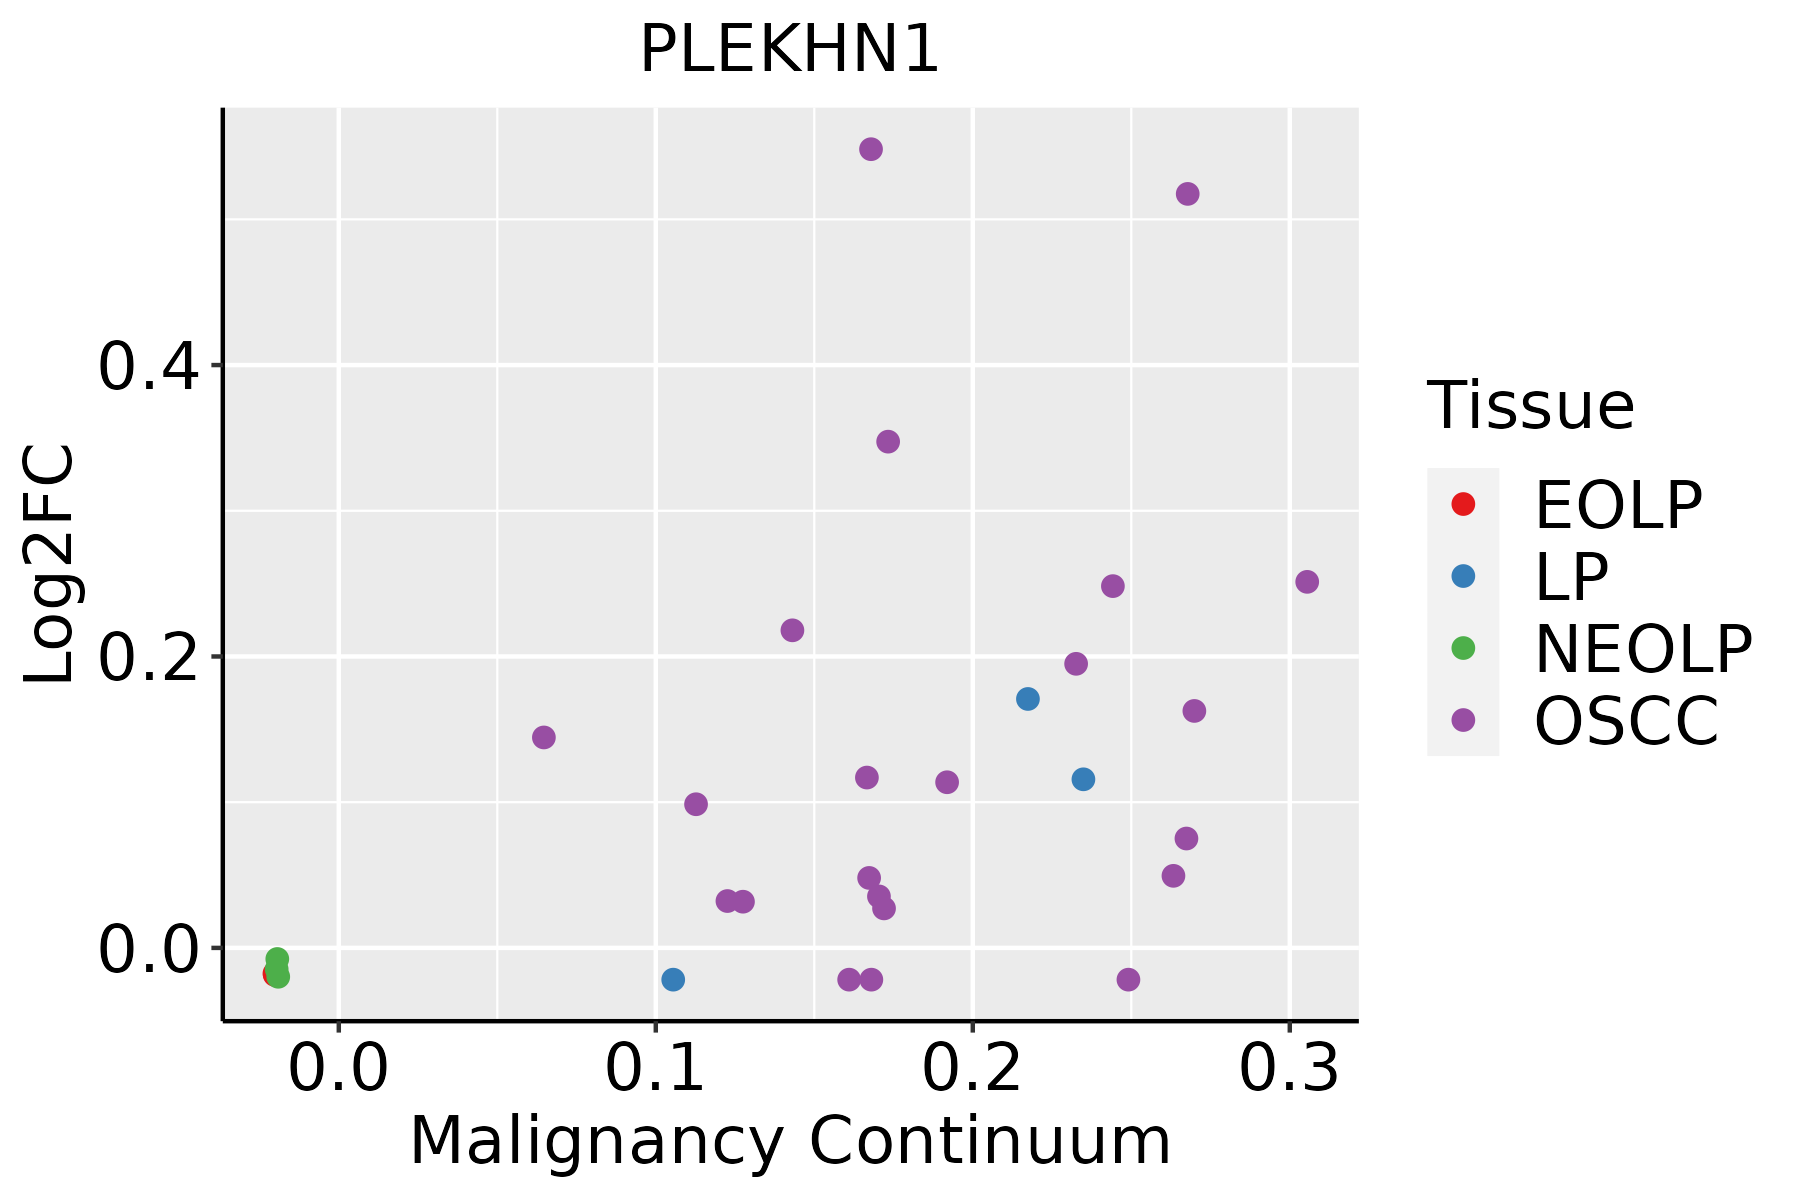 | EOLP: Erosive Oral lichen planus |
| LP: leukoplakia | ||
| NEOLP: Non-erosive oral lichen planus | ||
| OSCC: Oral squamous cell carcinoma |
| ∗log2FC in expression of this searched gene in stem-like cells from each diseased tissue sample relative to stem-like cells in normal samples in each tissue plotted against the malignancy continuum. Samples are colored based on if they are from different disease stage. |
Top |
Malignant transformation related pathway analysis |
| Find out the enriched GO biological processes and KEGG pathways involved in transition from healthy to precancer to cancer |
| Tissue | Disease Stage | Enriched GO biological Processes |
| Colorectum | AD |  |
| Colorectum | SER |  |
| Colorectum | MSS |  |
| Colorectum | MSI-H |  |
| Colorectum | FAP |  |
| ∗Top 15 enriched GO BP terms are showed in the bar plot of each disease state in each tissue. Each row represents a significant GO biological process which is colored according to the -log10(p.adjust). |
| Page: 1 2 3 4 5 6 7 8 9 |
| GO ID | Tissue | Disease Stage | Description | Gene Ratio | Bg Ratio | pvalue | p.adjust | Count |
| GO:000989620 | Oral cavity | OSCC | positive regulation of catabolic process | 307/7305 | 492/18723 | 2.29e-26 | 7.64e-24 | 307 |
| GO:003133120 | Oral cavity | OSCC | positive regulation of cellular catabolic process | 273/7305 | 427/18723 | 6.39e-26 | 2.02e-23 | 273 |
| GO:190331118 | Oral cavity | OSCC | regulation of mRNA metabolic process | 197/7305 | 288/18723 | 2.83e-24 | 7.16e-22 | 197 |
| GO:000640118 | Oral cavity | OSCC | RNA catabolic process | 184/7305 | 278/18723 | 2.71e-20 | 4.19e-18 | 184 |
| GO:000640218 | Oral cavity | OSCC | mRNA catabolic process | 156/7305 | 232/18723 | 2.13e-18 | 2.37e-16 | 156 |
| GO:000641720 | Oral cavity | OSCC | regulation of translation | 274/7305 | 468/18723 | 4.39e-18 | 4.63e-16 | 274 |
| GO:003465517 | Oral cavity | OSCC | nucleobase-containing compound catabolic process | 244/7305 | 407/18723 | 5.38e-18 | 5.49e-16 | 244 |
| GO:004670015 | Oral cavity | OSCC | heterocycle catabolic process | 254/7305 | 445/18723 | 5.07e-15 | 3.31e-13 | 254 |
| GO:004427016 | Oral cavity | OSCC | cellular nitrogen compound catabolic process | 256/7305 | 451/18723 | 9.67e-15 | 5.88e-13 | 256 |
| GO:001943915 | Oral cavity | OSCC | aromatic compound catabolic process | 263/7305 | 467/18723 | 1.49e-14 | 8.84e-13 | 263 |
| GO:190136115 | Oral cavity | OSCC | organic cyclic compound catabolic process | 272/7305 | 495/18723 | 2.73e-13 | 1.36e-11 | 272 |
| GO:007048219 | Oral cavity | OSCC | response to oxygen levels | 200/7305 | 347/18723 | 1.17e-12 | 5.13e-11 | 200 |
| GO:19033139 | Oral cavity | OSCC | positive regulation of mRNA metabolic process | 82/7305 | 118/18723 | 1.77e-11 | 6.13e-10 | 82 |
| GO:000166619 | Oral cavity | OSCC | response to hypoxia | 177/7305 | 307/18723 | 2.21e-11 | 7.50e-10 | 177 |
| GO:003629319 | Oral cavity | OSCC | response to decreased oxygen levels | 182/7305 | 322/18723 | 1.14e-10 | 3.41e-09 | 182 |
| GO:006101316 | Oral cavity | OSCC | regulation of mRNA catabolic process | 105/7305 | 166/18723 | 2.04e-10 | 5.82e-09 | 105 |
| GO:004348716 | Oral cavity | OSCC | regulation of RNA stability | 106/7305 | 170/18723 | 5.65e-10 | 1.47e-08 | 106 |
| GO:004348816 | Oral cavity | OSCC | regulation of mRNA stability | 99/7305 | 158/18723 | 1.41e-09 | 3.39e-08 | 99 |
| GO:00610149 | Oral cavity | OSCC | positive regulation of mRNA catabolic process | 58/7305 | 87/18723 | 1.59e-07 | 2.61e-06 | 58 |
| GO:00611579 | Oral cavity | OSCC | mRNA destabilization | 55/7305 | 84/18723 | 8.05e-07 | 1.12e-05 | 55 |
| Page: 1 2 |
| Pathway ID | Tissue | Disease Stage | Description | Gene Ratio | Bg Ratio | pvalue | p.adjust | qvalue | Count |
| Page: 1 |
Top |
Cell-cell communication analysis |
| Identification of potential cell-cell interactions between two cell types and their ligand-receptor pairs for different disease states |
| Ligand | Receptor | LRpair | Pathway | Tissue | Disease Stage |
| Page: 1 |
Top |
Single-cell gene regulatory network inference analysis |
| Find out the significant the regulons (TFs) and the target genes of each regulon across cell types for different disease states |
| TF | Cell Type | Tissue | Disease Stage | Target Gene | RSS | Regulon Activity |
| ∗The dot plots of a searched regulon are shown for all cell subpopulations in each disease state of each tissue based on the regulon specific score inferred using pySCENIC and by calculating the average expression. |
| Page: 1 |
Top |
Somatic mutation of malignant transformation related genes |
| Annotation of somatic variants for genes involved in malignant transformation |
| Hugo Symbol | Variant Class | Variant Classification | dbSNP RS | HGVSc | HGVSp | HGVSp Short | SWISSPROT | BIOTYPE | SIFT | PolyPhen | Tumor Sample Barcode | Tissue | Histology | Sex | Age | Stage | Therapy Types | Drugs | Outcome |
| PLEKHN1 | SNV | Missense_Mutation | novel | c.998C>T | p.Ser333Leu | p.S333L | Q494U1 | protein_coding | tolerated(0.65) | benign(0) | TCGA-A7-A3IZ-01 | Breast | breast invasive carcinoma | Female | <65 | I/II | Chemotherapy | cytoxan | SD |
| PLEKHN1 | SNV | Missense_Mutation | rs771197231 | c.454N>T | p.Gly152Trp | p.G152W | Q494U1 | protein_coding | deleterious(0) | possibly_damaging(0.895) | TCGA-E2-A14N-01 | Breast | breast invasive carcinoma | Female | <65 | I/II | Chemotherapy | cyclophosphamide | SD |
| PLEKHN1 | SNV | Missense_Mutation | rs775569859 | c.1190G>A | p.Arg397Gln | p.R397Q | Q494U1 | protein_coding | tolerated(0.69) | benign(0.001) | TCGA-2W-A8YY-01 | Cervix | cervical & endocervical cancer | Female | <65 | I/II | Chemotherapy | cisplatin | CR |
| PLEKHN1 | SNV | Missense_Mutation | rs150711457 | c.907G>A | p.Glu303Lys | p.E303K | Q494U1 | protein_coding | deleterious(0.04) | possibly_damaging(0.904) | TCGA-MA-AA42-01 | Cervix | cervical & endocervical cancer | Female | >=65 | I/II | Unknown | Unknown | SD |
| PLEKHN1 | SNV | Missense_Mutation | novel | c.1249N>A | p.Glu417Lys | p.E417K | Q494U1 | protein_coding | tolerated(0.23) | possibly_damaging(0.78) | TCGA-MA-AA43-01 | Cervix | cervical & endocervical cancer | Female | <65 | III/IV | Unknown | Unknown | SD |
| PLEKHN1 | insertion | Nonsense_Mutation | novel | c.280_281insCTGTGTGAGACAGCTT | p.Gly94AlafsTer3 | p.G94Afs*3 | Q494U1 | protein_coding | TCGA-DS-A1OB-01 | Cervix | cervical & endocervical cancer | Female | <65 | I/II | Chemotherapy | carboplatin | PD | ||
| PLEKHN1 | SNV | Missense_Mutation | rs369409460 | c.847N>T | p.Arg283Cys | p.R283C | Q494U1 | protein_coding | deleterious(0.04) | possibly_damaging(0.701) | TCGA-AA-A01P-01 | Colorectum | colon adenocarcinoma | Female | >=65 | III/IV | Unknown | Unknown | PD |
| PLEKHN1 | SNV | Missense_Mutation | rs765915628 | c.469N>A | p.Ala157Thr | p.A157T | Q494U1 | protein_coding | tolerated(0.09) | probably_damaging(0.923) | TCGA-AD-6889-01 | Colorectum | colon adenocarcinoma | Male | >=65 | I/II | Chemotherapy | xeloda | PD |
| PLEKHN1 | SNV | Missense_Mutation | rs181207265 | c.1087A>C | p.Thr363Pro | p.T363P | Q494U1 | protein_coding | deleterious(0.03) | probably_damaging(0.974) | TCGA-AZ-4614-01 | Colorectum | colon adenocarcinoma | Female | >=65 | I/II | Unknown | Unknown | PD |
| PLEKHN1 | SNV | Missense_Mutation | c.1592N>T | p.Ala531Val | p.A531V | Q494U1 | protein_coding | deleterious(0.01) | benign(0.015) | TCGA-D5-5538-01 | Colorectum | colon adenocarcinoma | Female | <65 | III/IV | Chemotherapy | calcium | PD |
| Page: 1 2 3 4 |
Top |
Related drugs of malignant transformation related genes |
| Identification of chemicals and drugs interact with genes involved in malignant transfromation |
| (DGIdb 4.0) |
| Entrez ID | Symbol | Category | Interaction Types | Drug Claim Name | Drug Name | PMIDs |
| Page: 1 |

Copyright 2023-Present -The University of Texas Health Science Center at Houston |