
|
|||||
|
 | |
| |
| |
| |
| |
| |
|
Gene: PLEKHJ1 |
Gene summary for PLEKHJ1 |
| Gene information | Species | Human | Gene symbol | PLEKHJ1 | Gene ID | 55111 |
| Gene name | pleckstrin homology domain containing J1 | |
| Gene Alias | GNRPX | |
| Cytomap | 19p13.3 | |
| Gene Type | protein-coding | GO ID | GO:0001881 | UniProtAcc | K7EIZ3 |
Top |
Malignant transformation analysis |
| Identification of the aberrant gene expression in precancerous and cancerous lesions by comparing the gene expression of stem-like cells in diseased tissues with normal stem cells |
| Entrez ID | Symbol | Replicates | Species | Organ | Tissue | Adj P-value | Log2FC | Malignancy |
| 55111 | PLEKHJ1 | HTA11_2487_2000001011 | Human | Colorectum | SER | 3.18e-17 | 7.27e-01 | -0.1808 |
| 55111 | PLEKHJ1 | HTA11_1938_2000001011 | Human | Colorectum | AD | 1.87e-07 | 3.72e-01 | -0.0811 |
| 55111 | PLEKHJ1 | HTA11_347_2000001011 | Human | Colorectum | AD | 2.02e-10 | 3.27e-01 | -0.1954 |
| 55111 | PLEKHJ1 | HTA11_411_2000001011 | Human | Colorectum | SER | 1.79e-02 | 6.11e-01 | -0.2602 |
| 55111 | PLEKHJ1 | HTA11_2112_2000001011 | Human | Colorectum | SER | 4.82e-08 | 7.39e-01 | -0.2196 |
| 55111 | PLEKHJ1 | HTA11_3361_2000001011 | Human | Colorectum | AD | 3.38e-03 | 3.02e-01 | -0.1207 |
| 55111 | PLEKHJ1 | HTA11_696_2000001011 | Human | Colorectum | AD | 8.40e-13 | 4.23e-01 | -0.1464 |
| 55111 | PLEKHJ1 | HTA11_866_2000001011 | Human | Colorectum | AD | 1.16e-06 | 3.51e-01 | -0.1001 |
| 55111 | PLEKHJ1 | HTA11_1391_2000001011 | Human | Colorectum | AD | 8.49e-13 | 4.48e-01 | -0.059 |
| 55111 | PLEKHJ1 | HTA11_5212_2000001011 | Human | Colorectum | AD | 2.46e-06 | 4.39e-01 | -0.2061 |
| 55111 | PLEKHJ1 | HTA11_10623_2000001011 | Human | Colorectum | AD | 4.78e-03 | 2.57e-01 | -0.0177 |
| 55111 | PLEKHJ1 | HTA11_7696_3000711011 | Human | Colorectum | AD | 3.64e-05 | 2.78e-01 | 0.0674 |
| 55111 | PLEKHJ1 | HTA11_7469_2000001011 | Human | Colorectum | AD | 2.91e-02 | 4.40e-01 | -0.0124 |
| 55111 | PLEKHJ1 | HTA11_99999971662_82457 | Human | Colorectum | MSS | 5.93e-05 | 2.86e-01 | 0.3859 |
| 55111 | PLEKHJ1 | LZE2T | Human | Esophagus | ESCC | 4.44e-07 | 8.38e-01 | 0.082 |
| 55111 | PLEKHJ1 | LZE4T | Human | Esophagus | ESCC | 2.59e-11 | 2.97e-01 | 0.0811 |
| 55111 | PLEKHJ1 | LZE7T | Human | Esophagus | ESCC | 1.80e-08 | 6.07e-01 | 0.0667 |
| 55111 | PLEKHJ1 | LZE8T | Human | Esophagus | ESCC | 5.00e-08 | 4.15e-01 | 0.067 |
| 55111 | PLEKHJ1 | LZE20T | Human | Esophagus | ESCC | 2.15e-06 | 3.17e-01 | 0.0662 |
| 55111 | PLEKHJ1 | LZE22D1 | Human | Esophagus | HGIN | 7.90e-06 | 2.68e-01 | 0.0595 |
| Page: 1 2 3 4 5 6 7 8 9 |
| Tissue | Expression Dynamics | Abbreviation |
| Colorectum (GSE201348) |  | FAP: Familial adenomatous polyposis |
| CRC: Colorectal cancer | ||
| Colorectum (HTA11) | 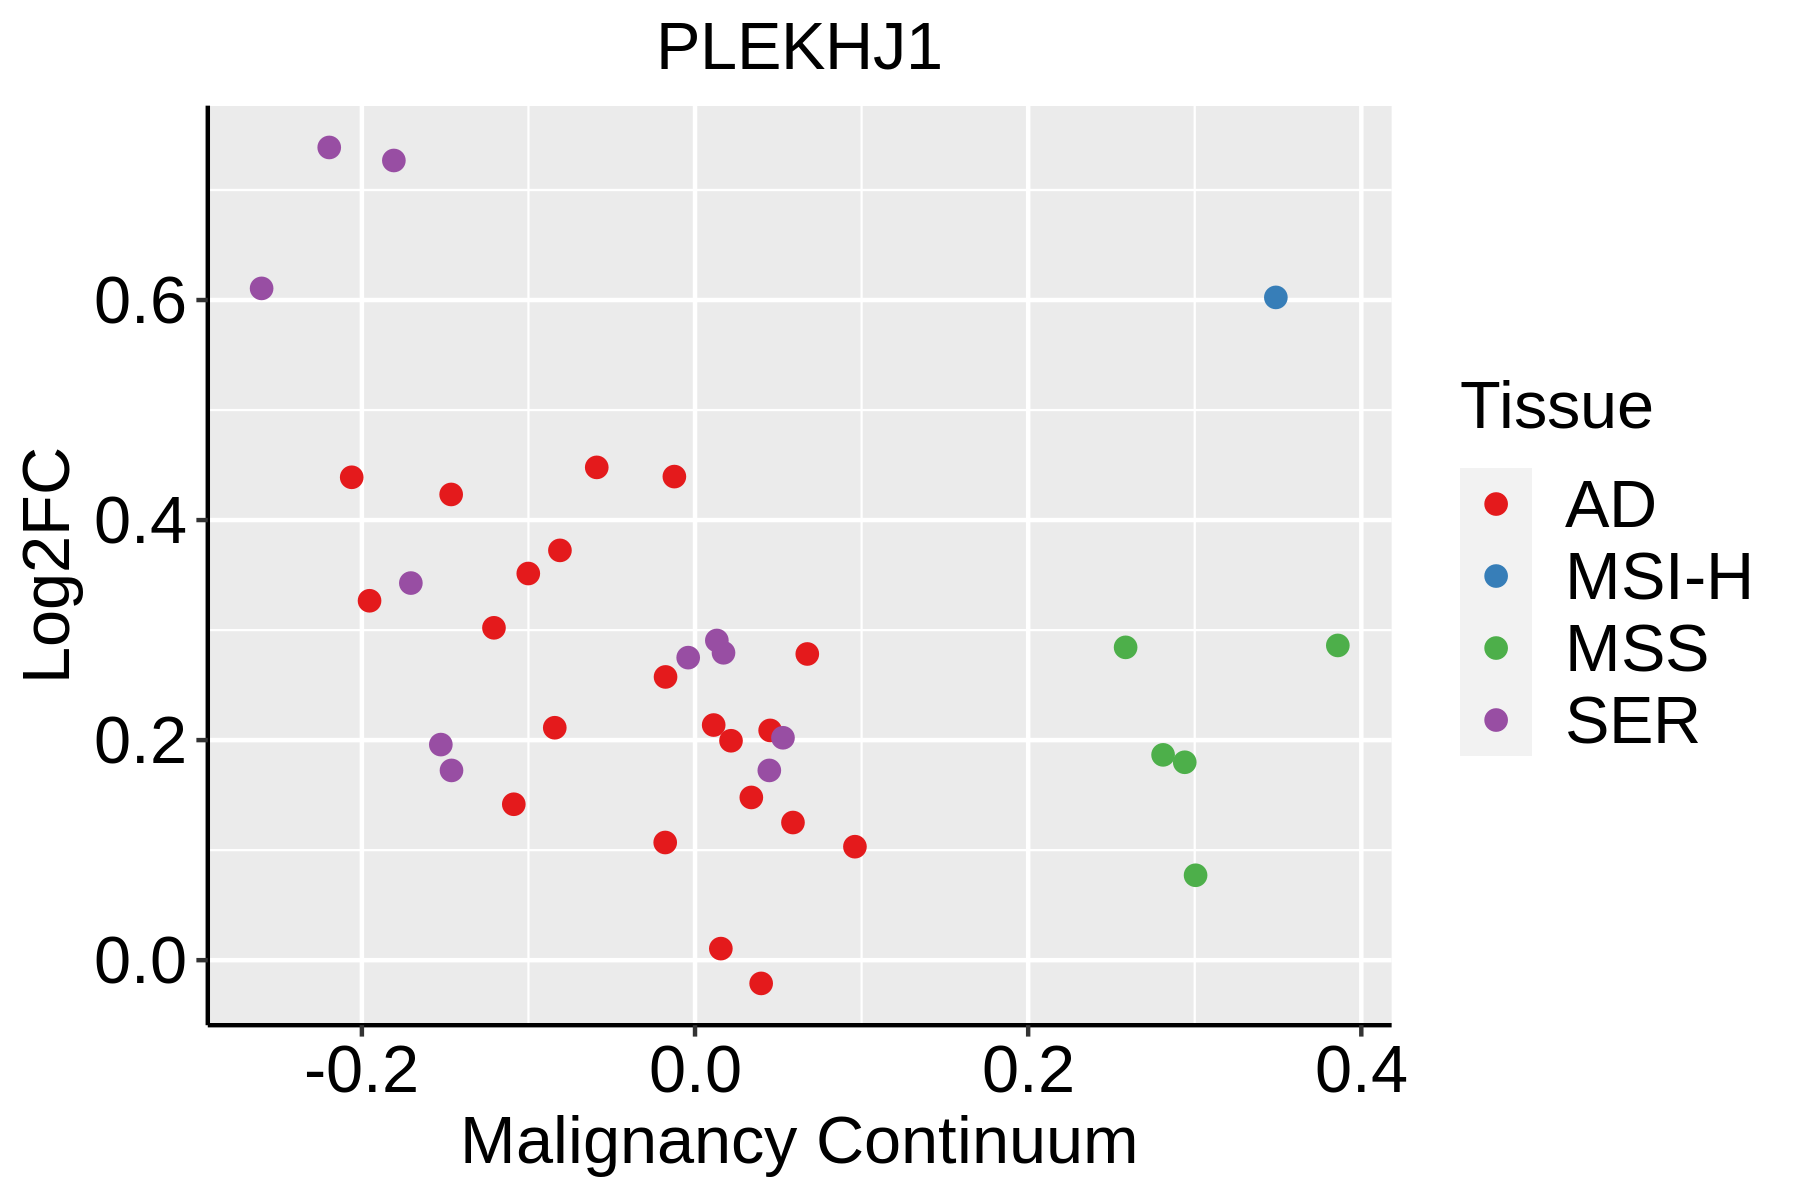 | AD: Adenomas |
| SER: Sessile serrated lesions | ||
| MSI-H: Microsatellite-high colorectal cancer | ||
| MSS: Microsatellite stable colorectal cancer | ||
| Esophagus | 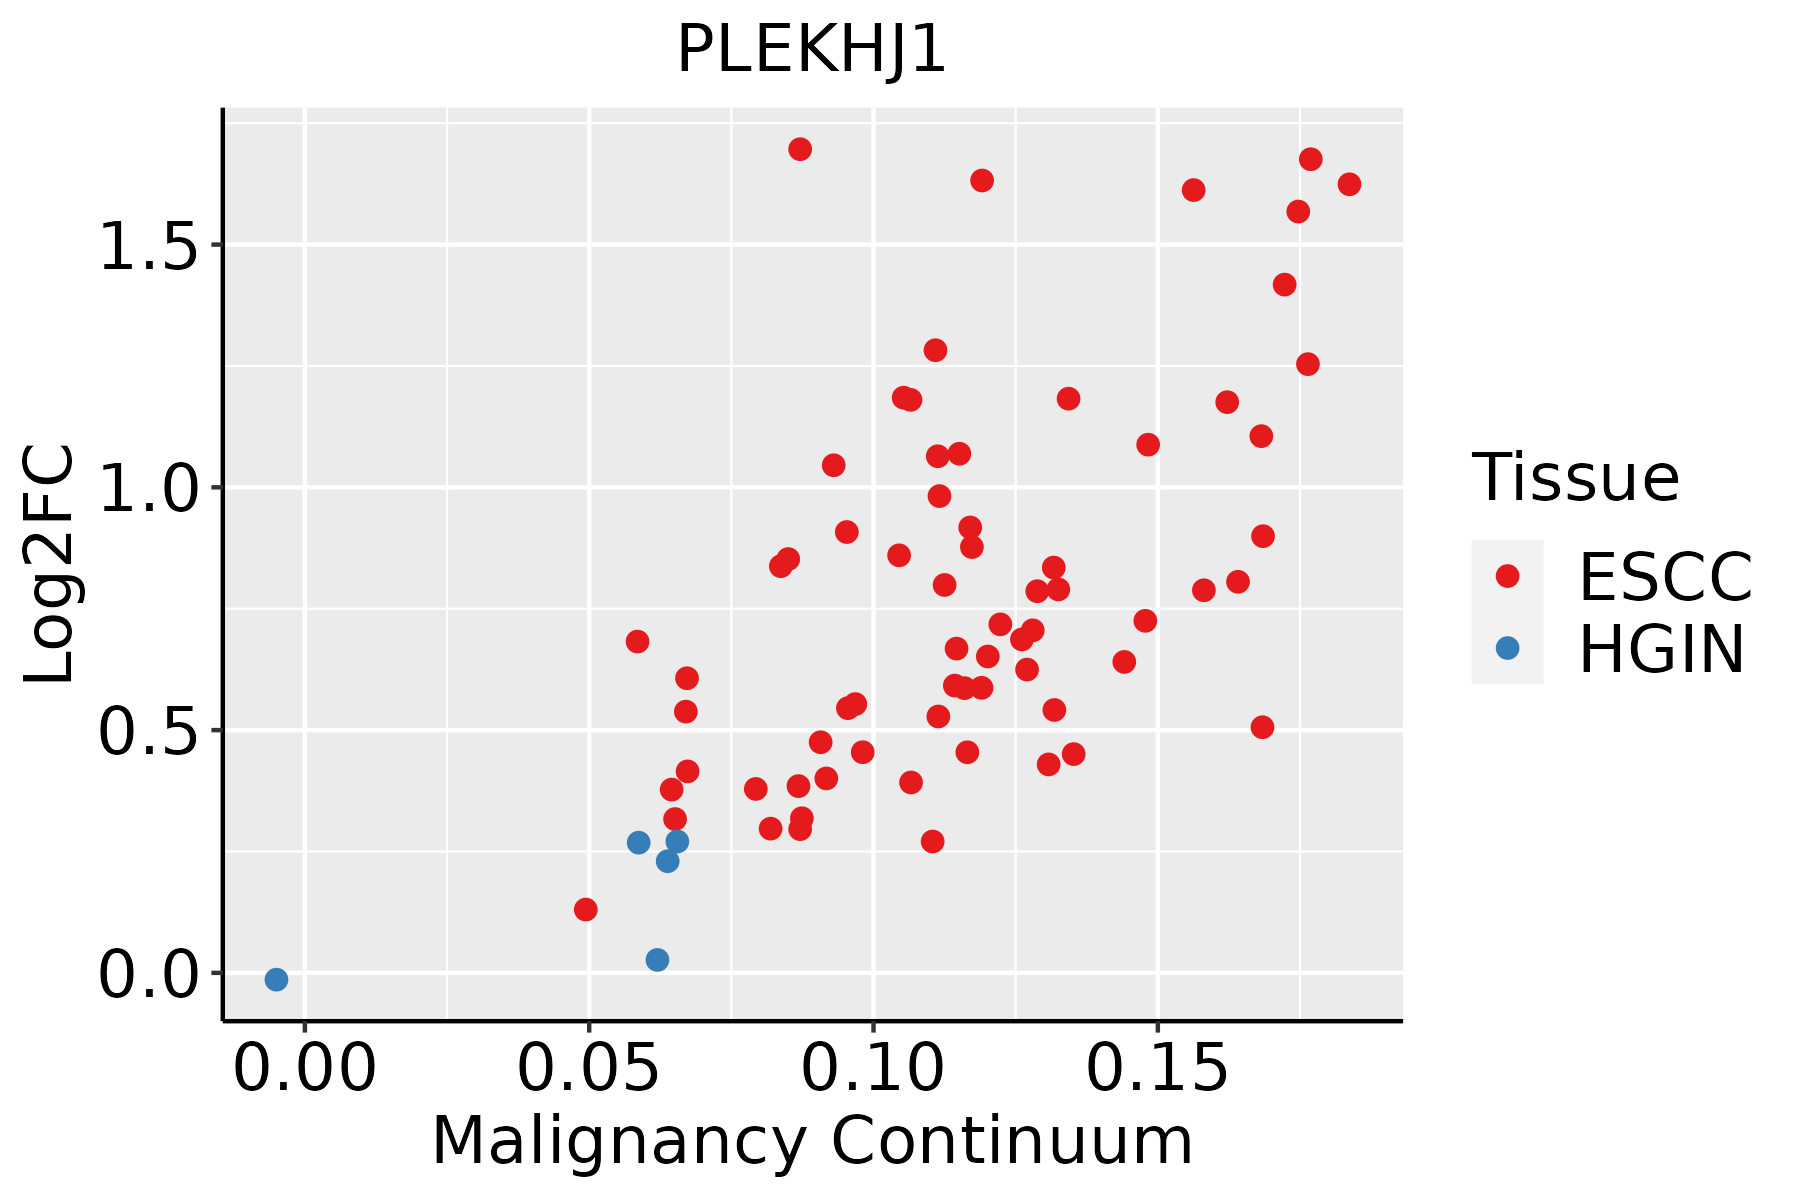 | ESCC: Esophageal squamous cell carcinoma |
| HGIN: High-grade intraepithelial neoplasias | ||
| LGIN: Low-grade intraepithelial neoplasias | ||
| GC |  | CAG: Chronic atrophic gastritis |
| CAG with IM: Chronic atrophic gastritis with intestinal metaplasia | ||
| CSG: Chronic superficial gastritis | ||
| GC: Gastric cancer | ||
| SIM: Severe intestinal metaplasia | ||
| WIM: Wild intestinal metaplasia | ||
| Liver | 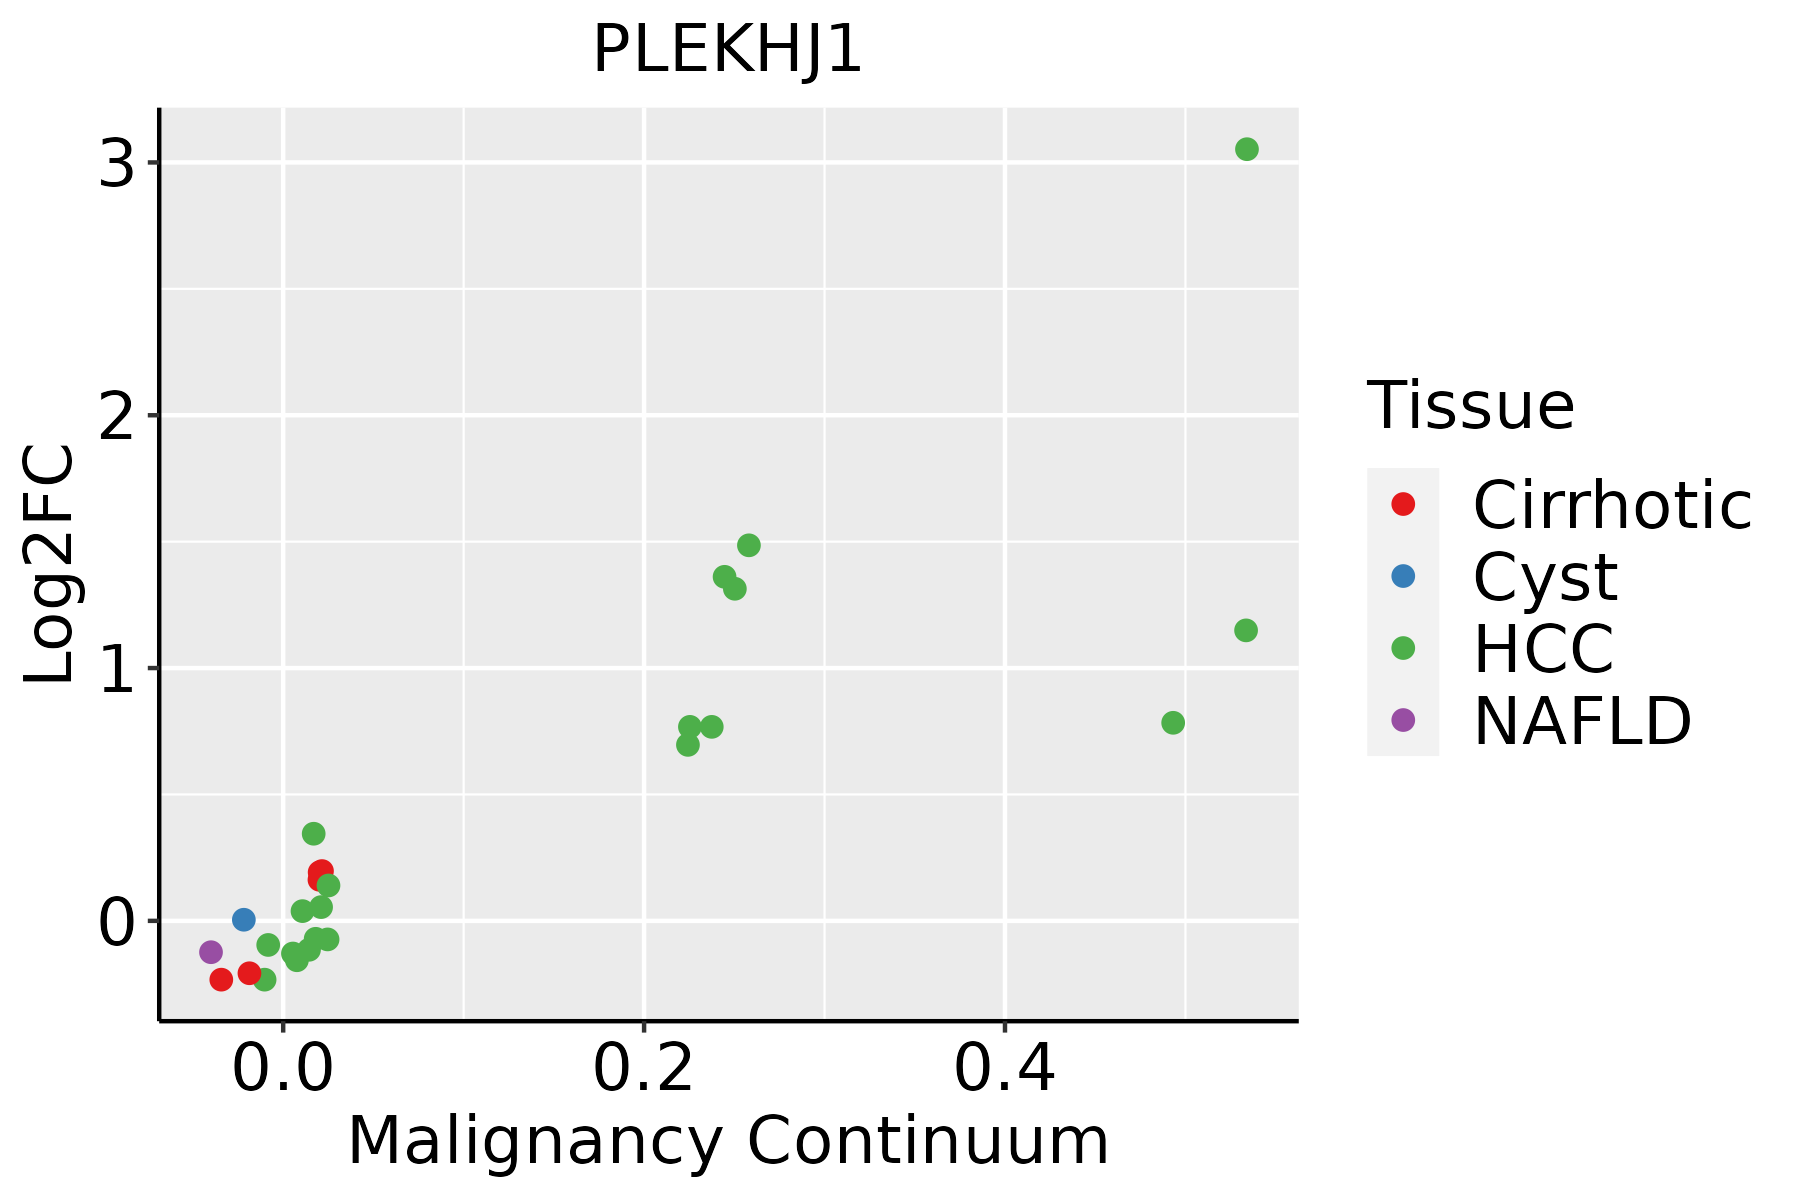 | HCC: Hepatocellular carcinoma |
| NAFLD: Non-alcoholic fatty liver disease | ||
| Oral Cavity | 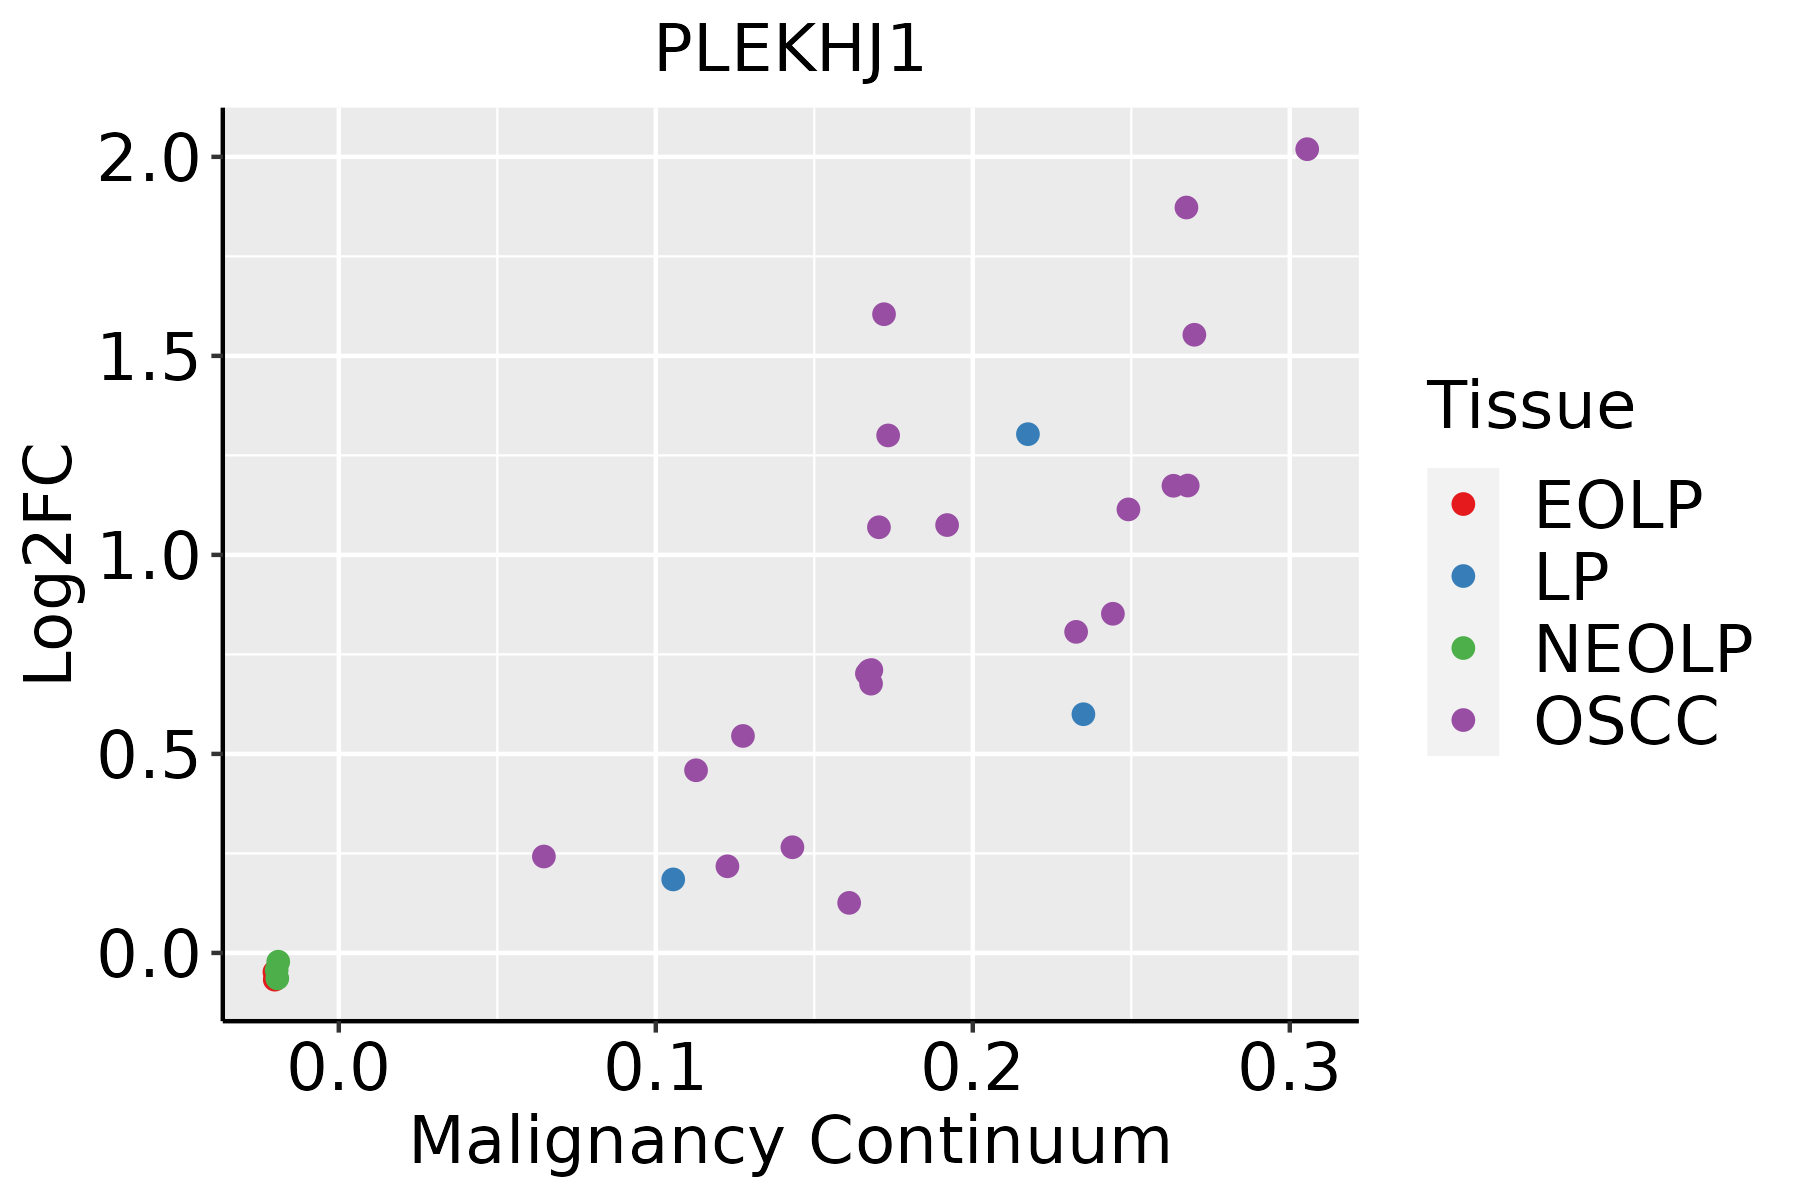 | EOLP: Erosive Oral lichen planus |
| LP: leukoplakia | ||
| NEOLP: Non-erosive oral lichen planus | ||
| OSCC: Oral squamous cell carcinoma | ||
| Prostate | 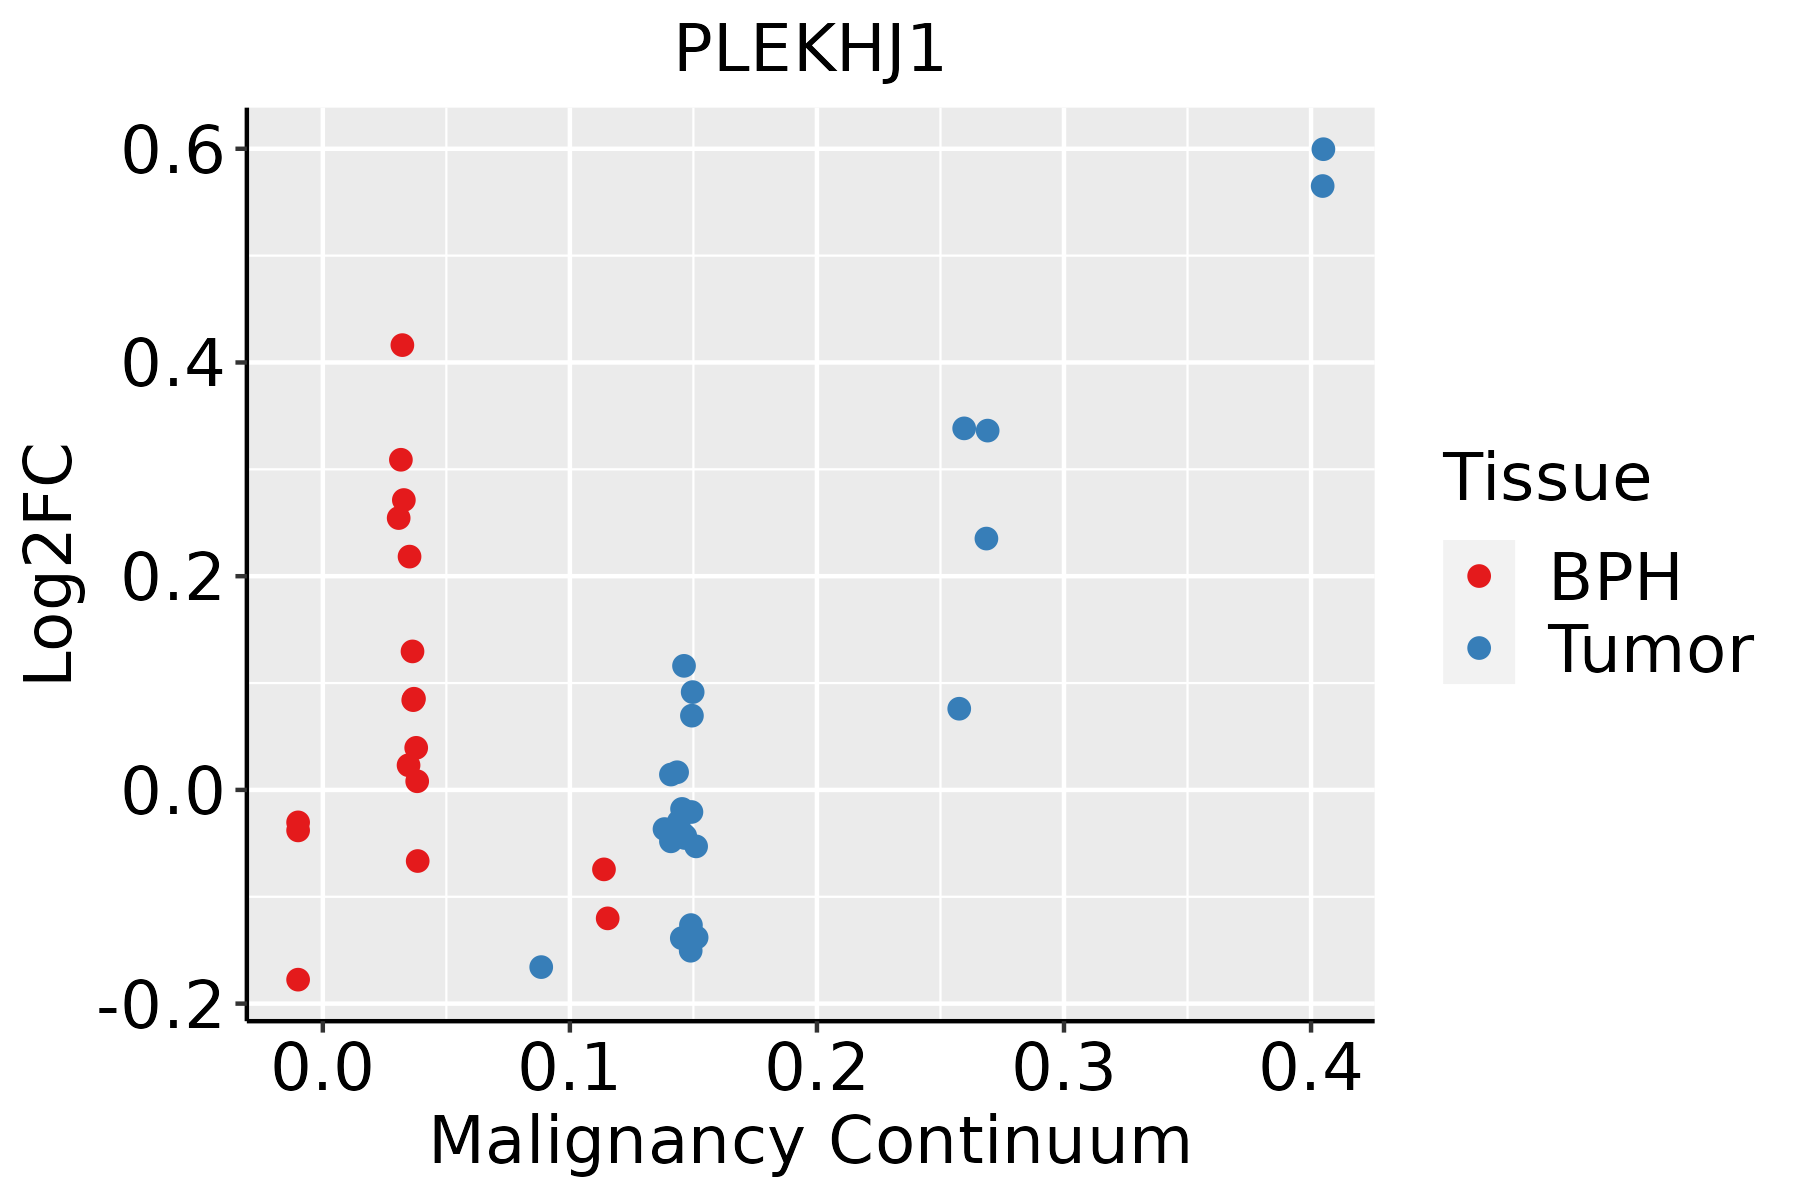 | BPH: Benign Prostatic Hyperplasia |
| Skin |  | AK: Actinic keratosis |
| cSCC: Cutaneous squamous cell carcinoma | ||
| SCCIS:squamous cell carcinoma in situ | ||
| Thyroid | 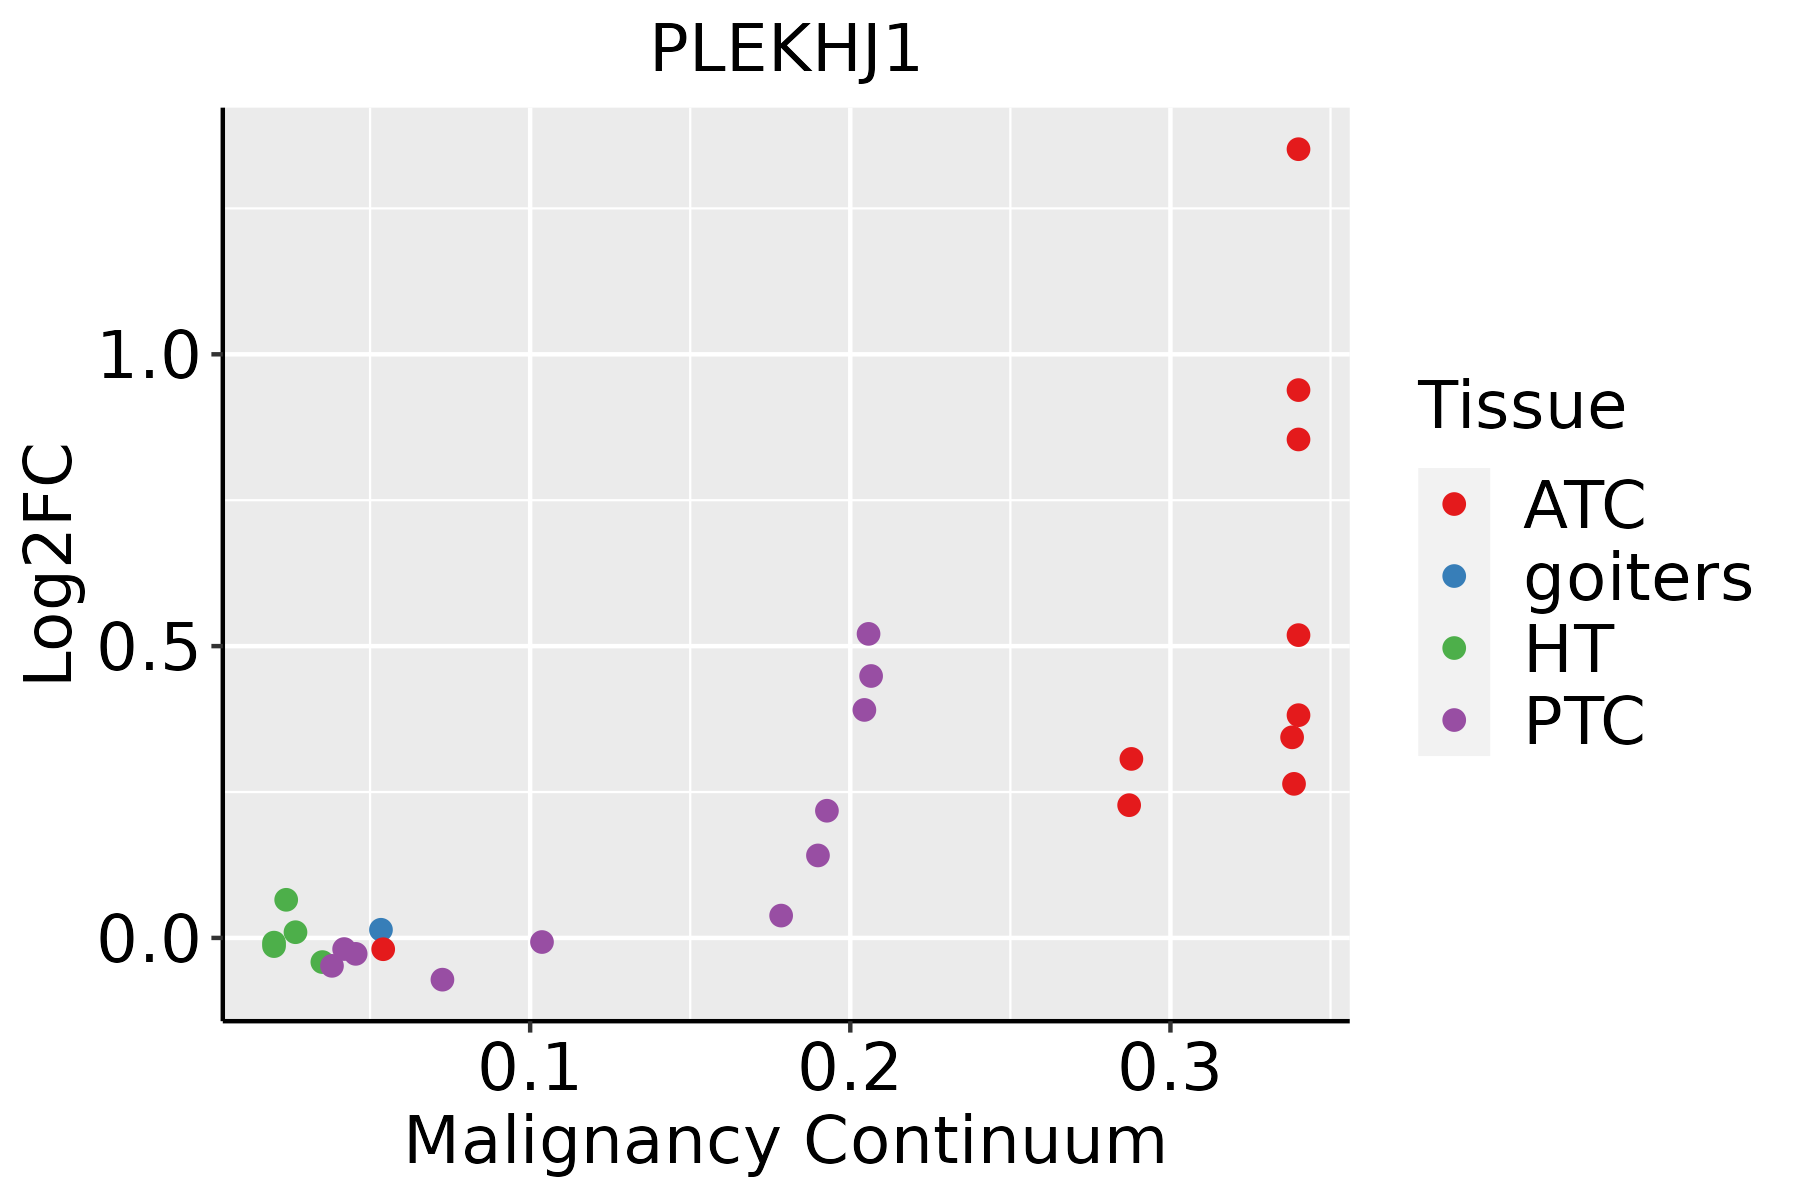 | ATC: Anaplastic thyroid cancer |
| HT: Hashimoto's thyroiditis | ||
| PTC: Papillary thyroid cancer |
| ∗log2FC in expression of this searched gene in stem-like cells from each diseased tissue sample relative to stem-like cells in normal samples in each tissue plotted against the malignancy continuum. Samples are colored based on if they are from different disease stage. |
Top |
Malignant transformation related pathway analysis |
| Find out the enriched GO biological processes and KEGG pathways involved in transition from healthy to precancer to cancer |
| Tissue | Disease Stage | Enriched GO biological Processes |
| Colorectum | AD |  |
| Colorectum | SER |  |
| Colorectum | MSS |  |
| Colorectum | MSI-H |  |
| Colorectum | FAP |  |
| ∗Top 15 enriched GO BP terms are showed in the bar plot of each disease state in each tissue. Each row represents a significant GO biological process which is colored according to the -log10(p.adjust). |
| Page: 1 2 3 4 5 6 7 8 9 |
| GO ID | Tissue | Disease Stage | Description | Gene Ratio | Bg Ratio | pvalue | p.adjust | Count |
| GO:0016197 | Colorectum | AD | endosomal transport | 90/3918 | 230/18723 | 1.88e-10 | 1.73e-08 | 90 |
| GO:0016482 | Colorectum | AD | cytosolic transport | 68/3918 | 168/18723 | 6.00e-09 | 3.72e-07 | 68 |
| GO:0016050 | Colorectum | AD | vesicle organization | 101/3918 | 300/18723 | 1.65e-07 | 7.17e-06 | 101 |
| GO:0043112 | Colorectum | AD | receptor metabolic process | 62/3918 | 166/18723 | 8.18e-07 | 2.85e-05 | 62 |
| GO:0042147 | Colorectum | AD | retrograde transport, endosome to Golgi | 37/3918 | 91/18723 | 1.46e-05 | 3.14e-04 | 37 |
| GO:0001881 | Colorectum | AD | receptor recycling | 18/3918 | 33/18723 | 2.23e-05 | 4.40e-04 | 18 |
| GO:0007032 | Colorectum | AD | endosome organization | 33/3918 | 82/18723 | 5.30e-05 | 9.01e-04 | 33 |
| GO:00161971 | Colorectum | SER | endosomal transport | 61/2897 | 230/18723 | 1.03e-05 | 3.35e-04 | 61 |
| GO:00164821 | Colorectum | SER | cytosolic transport | 46/2897 | 168/18723 | 5.20e-05 | 1.25e-03 | 46 |
| GO:00160501 | Colorectum | SER | vesicle organization | 69/2897 | 300/18723 | 3.59e-04 | 5.61e-03 | 69 |
| GO:00070321 | Colorectum | SER | endosome organization | 24/2897 | 82/18723 | 1.11e-03 | 1.28e-02 | 24 |
| GO:00161972 | Colorectum | MSS | endosomal transport | 79/3467 | 230/18723 | 7.04e-09 | 4.39e-07 | 79 |
| GO:00160502 | Colorectum | MSS | vesicle organization | 93/3467 | 300/18723 | 1.04e-07 | 4.97e-06 | 93 |
| GO:00164822 | Colorectum | MSS | cytosolic transport | 59/3467 | 168/18723 | 2.29e-07 | 9.79e-06 | 59 |
| GO:00431121 | Colorectum | MSS | receptor metabolic process | 57/3467 | 166/18723 | 8.47e-07 | 2.97e-05 | 57 |
| GO:00421471 | Colorectum | MSS | retrograde transport, endosome to Golgi | 33/3467 | 91/18723 | 4.78e-05 | 8.71e-04 | 33 |
| GO:00018811 | Colorectum | MSS | receptor recycling | 16/3467 | 33/18723 | 8.66e-05 | 1.40e-03 | 16 |
| GO:00070322 | Colorectum | MSS | endosome organization | 28/3467 | 82/18723 | 5.44e-04 | 6.07e-03 | 28 |
| GO:001619710 | Esophagus | HGIN | endosomal transport | 57/2587 | 230/18723 | 5.74e-06 | 1.81e-04 | 57 |
| GO:00070328 | Esophagus | HGIN | endosome organization | 25/2587 | 82/18723 | 7.45e-05 | 1.69e-03 | 25 |
| Page: 1 2 3 4 5 |
| Pathway ID | Tissue | Disease Stage | Description | Gene Ratio | Bg Ratio | pvalue | p.adjust | qvalue | Count |
| Page: 1 |
Top |
Cell-cell communication analysis |
| Identification of potential cell-cell interactions between two cell types and their ligand-receptor pairs for different disease states |
| Ligand | Receptor | LRpair | Pathway | Tissue | Disease Stage |
| Page: 1 |
Top |
Single-cell gene regulatory network inference analysis |
| Find out the significant the regulons (TFs) and the target genes of each regulon across cell types for different disease states |
| TF | Cell Type | Tissue | Disease Stage | Target Gene | RSS | Regulon Activity |
| ∗The dot plots of a searched regulon are shown for all cell subpopulations in each disease state of each tissue based on the regulon specific score inferred using pySCENIC and by calculating the average expression. |
| Page: 1 |
Top |
Somatic mutation of malignant transformation related genes |
| Annotation of somatic variants for genes involved in malignant transformation |
| Hugo Symbol | Variant Class | Variant Classification | dbSNP RS | HGVSc | HGVSp | HGVSp Short | SWISSPROT | BIOTYPE | SIFT | PolyPhen | Tumor Sample Barcode | Tissue | Histology | Sex | Age | Stage | Therapy Types | Drugs | Outcome |
| PLEKHJ1 | SNV | Missense_Mutation | novel | c.333N>A | p.Met111Ile | p.M111I | protein_coding | tolerated_low_confidence(0.09) | benign(0.237) | TCGA-DI-A1BU-01 | Endometrium | uterine corpus endometrioid carcinoma | Female | <65 | I/II | Chemotherapy | paclitaxel | SD | |
| PLEKHJ1 | SNV | Missense_Mutation | c.276C>G | p.Ser92Arg | p.S92R | protein_coding | deleterious_low_confidence(0.01) | probably_damaging(0.957) | TCGA-FI-A2D2-01 | Endometrium | uterine corpus endometrioid carcinoma | Female | >=65 | I/II | Chemotherapy | carboplatinum | PD |
| Page: 1 |
Top |
Related drugs of malignant transformation related genes |
| Identification of chemicals and drugs interact with genes involved in malignant transfromation |
| (DGIdb 4.0) |
| Entrez ID | Symbol | Category | Interaction Types | Drug Claim Name | Drug Name | PMIDs |
| 55111 | PLEKHJ1 | NA | candesartan | CANDESARTAN | 31327267 |
| Page: 1 |

Copyright 2023-Present -The University of Texas Health Science Center at Houston |