
|
|||||
|
 | |
| |
| |
| |
| |
| |
|
Gene: PLEKHG4B |
Gene summary for PLEKHG4B |
| Gene information | Species | Human | Gene symbol | PLEKHG4B | Gene ID | 153478 |
| Gene name | pleckstrin homology and RhoGEF domain containing G4B | |
| Gene Alias | PLEKHG4B | |
| Cytomap | 5p15.33 | |
| Gene Type | protein-coding | GO ID | GO:0007154 | UniProtAcc | Q96PX9 |
Top |
Malignant transformation analysis |
| Identification of the aberrant gene expression in precancerous and cancerous lesions by comparing the gene expression of stem-like cells in diseased tissues with normal stem cells |
| Entrez ID | Symbol | Replicates | Species | Organ | Tissue | Adj P-value | Log2FC | Malignancy |
| 153478 | PLEKHG4B | HCC1 | Human | Liver | HCC | 8.59e-03 | 4.89e-01 | 0.5336 |
| 153478 | PLEKHG4B | HCC2 | Human | Liver | HCC | 1.33e-24 | 1.30e+00 | 0.5341 |
| 153478 | PLEKHG4B | HCC5 | Human | Liver | HCC | 6.78e-29 | 1.46e+00 | 0.4932 |
| Page: 1 |
| Tissue | Expression Dynamics | Abbreviation |
| Liver | 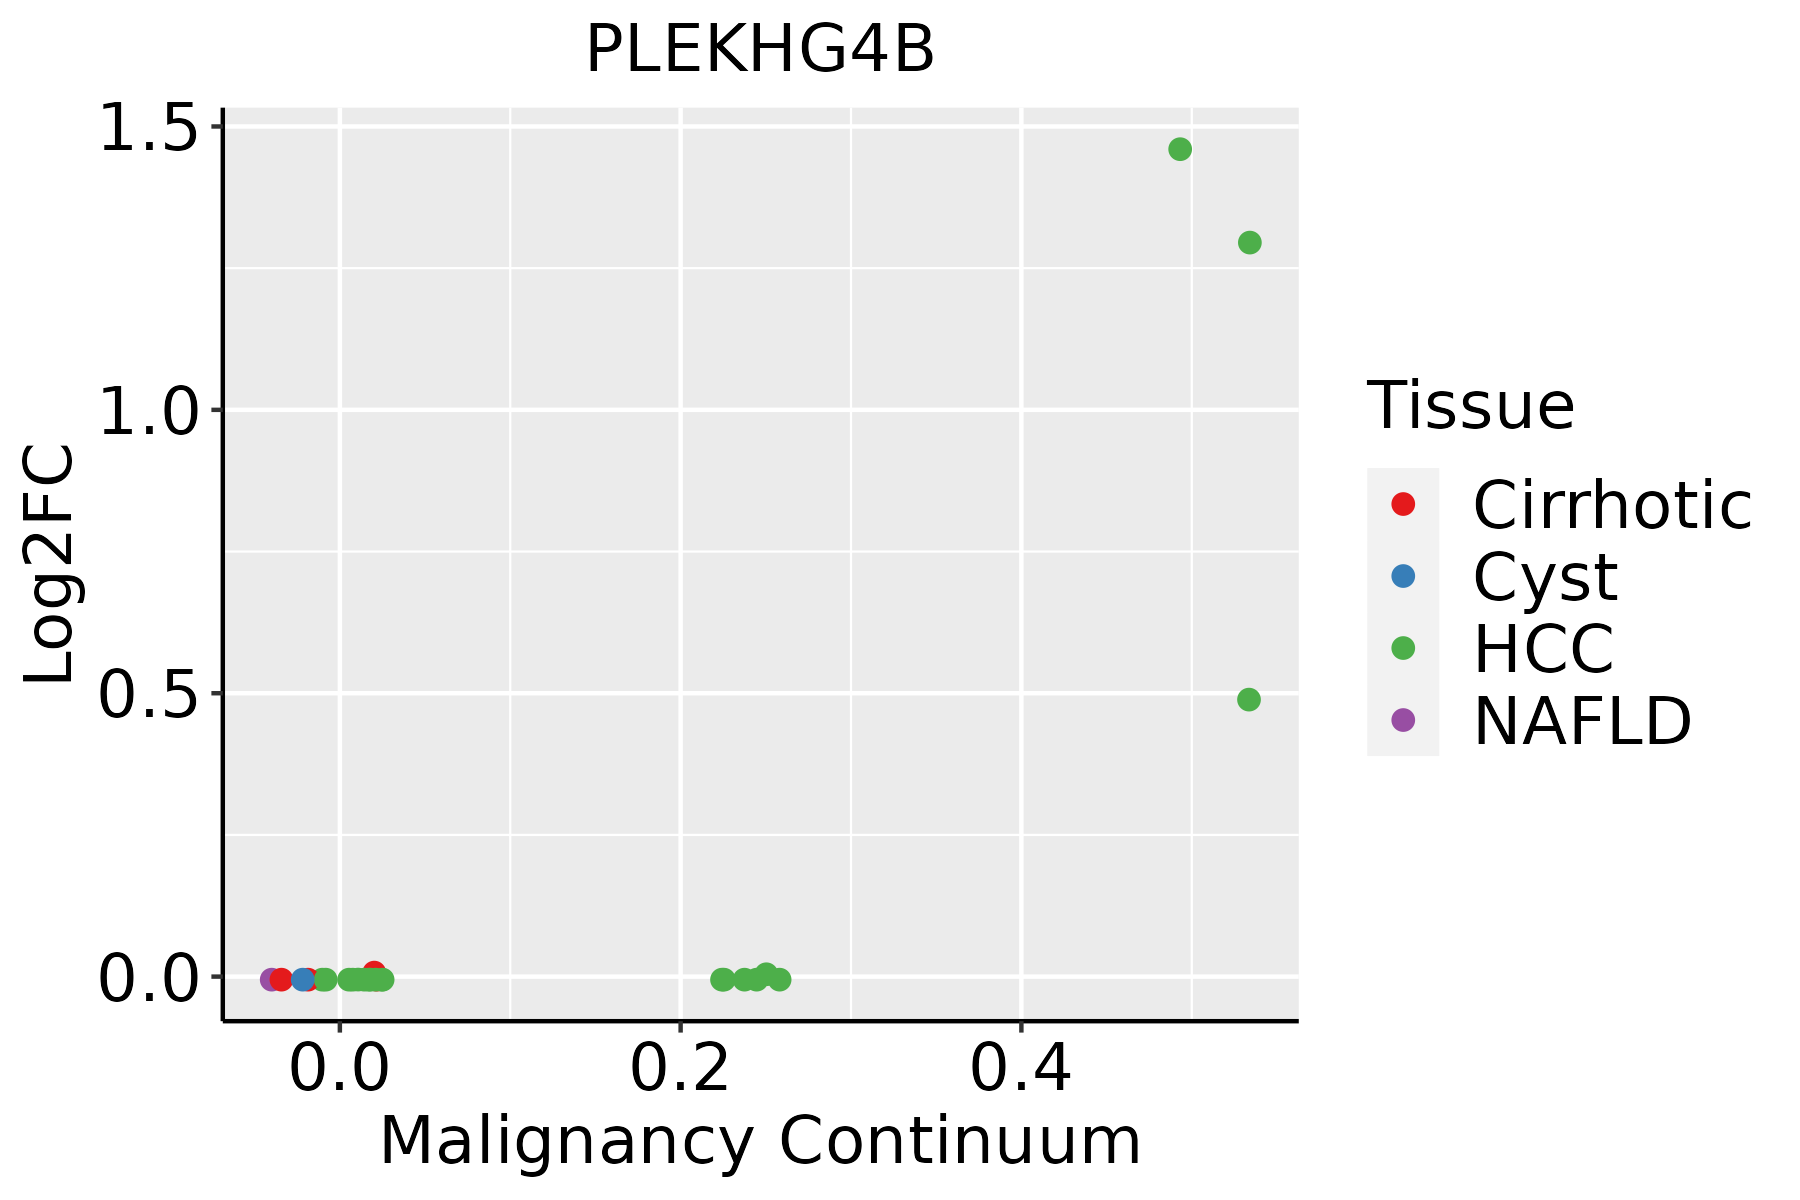 | HCC: Hepatocellular carcinoma |
| NAFLD: Non-alcoholic fatty liver disease |
| ∗log2FC in expression of this searched gene in stem-like cells from each diseased tissue sample relative to stem-like cells in normal samples in each tissue plotted against the malignancy continuum. Samples are colored based on if they are from different disease stage. |
Top |
Malignant transformation related pathway analysis |
| Find out the enriched GO biological processes and KEGG pathways involved in transition from healthy to precancer to cancer |
| Tissue | Disease Stage | Enriched GO biological Processes |
| Colorectum | AD |  |
| Colorectum | SER |  |
| Colorectum | MSS |  |
| Colorectum | MSI-H |  |
| Colorectum | FAP |  |
| ∗Top 15 enriched GO BP terms are showed in the bar plot of each disease state in each tissue. Each row represents a significant GO biological process which is colored according to the -log10(p.adjust). |
| Page: 1 2 3 4 5 6 7 8 9 |
| GO ID | Tissue | Disease Stage | Description | Gene Ratio | Bg Ratio | pvalue | p.adjust | Count |
| Page: 1 |
| Pathway ID | Tissue | Disease Stage | Description | Gene Ratio | Bg Ratio | pvalue | p.adjust | qvalue | Count |
| Page: 1 |
Top |
Cell-cell communication analysis |
| Identification of potential cell-cell interactions between two cell types and their ligand-receptor pairs for different disease states |
| Ligand | Receptor | LRpair | Pathway | Tissue | Disease Stage |
| Page: 1 |
Top |
Single-cell gene regulatory network inference analysis |
| Find out the significant the regulons (TFs) and the target genes of each regulon across cell types for different disease states |
| TF | Cell Type | Tissue | Disease Stage | Target Gene | RSS | Regulon Activity |
| ∗The dot plots of a searched regulon are shown for all cell subpopulations in each disease state of each tissue based on the regulon specific score inferred using pySCENIC and by calculating the average expression. |
| Page: 1 |
Top |
Somatic mutation of malignant transformation related genes |
| Annotation of somatic variants for genes involved in malignant transformation |
| Hugo Symbol | Variant Class | Variant Classification | dbSNP RS | HGVSc | HGVSp | HGVSp Short | SWISSPROT | BIOTYPE | SIFT | PolyPhen | Tumor Sample Barcode | Tissue | Histology | Sex | Age | Stage | Therapy Types | Drugs | Outcome |
| PLEKHG4B | SNV | Missense_Mutation | rs147897190 | c.3647C>T | p.Ser1216Phe | p.S1216F | Q96PX9 | protein_coding | deleterious(0.03) | possibly_damaging(0.466) | TCGA-A2-A0D0-01 | Breast | breast invasive carcinoma | Female | <65 | I/II | Chemotherapy | cytoxan | SD |
| PLEKHG4B | SNV | Missense_Mutation | c.2872N>G | p.Leu958Val | p.L958V | Q96PX9 | protein_coding | deleterious(0.04) | benign(0.079) | TCGA-A7-A13E-01 | Breast | breast invasive carcinoma | Female | <65 | I/II | Targeted Molecular therapy | bevacizumab | PD | |
| PLEKHG4B | SNV | Missense_Mutation | rs146749875 | c.2465N>A | p.Arg822Gln | p.R822Q | Q96PX9 | protein_coding | deleterious(0) | probably_damaging(0.947) | TCGA-B6-A0RG-01 | Breast | breast invasive carcinoma | Female | <65 | I/II | Unknown | Unknown | SD |
| PLEKHG4B | SNV | Missense_Mutation | novel | c.3070N>T | p.Leu1024Phe | p.L1024F | Q96PX9 | protein_coding | deleterious(0.03) | benign(0.32) | TCGA-BH-A0HF-01 | Breast | breast invasive carcinoma | Female | >=65 | I/II | Hormone Therapy | arimidex | SD |
| PLEKHG4B | SNV | Missense_Mutation | c.2618G>A | p.Cys873Tyr | p.C873Y | Q96PX9 | protein_coding | deleterious(0) | probably_damaging(0.997) | TCGA-BH-A18G-01 | Breast | breast invasive carcinoma | Female | >=65 | I/II | Unknown | Unknown | SD | |
| PLEKHG4B | SNV | Missense_Mutation | novel | c.175N>A | p.Glu59Lys | p.E59K | Q96PX9 | protein_coding | tolerated(0.06) | benign(0.007) | TCGA-D8-A73U-01 | Breast | breast invasive carcinoma | Female | >=65 | I/II | Hormone Therapy | tamoxiphen | SD |
| PLEKHG4B | SNV | Missense_Mutation | novel | c.3064G>A | p.Val1022Met | p.V1022M | Q96PX9 | protein_coding | deleterious(0.03) | probably_damaging(0.989) | TCGA-OL-A97C-01 | Breast | breast invasive carcinoma | Female | >=65 | I/II | Unknown | Unknown | PD |
| PLEKHG4B | SNV | Missense_Mutation | rs374979115 | c.3463N>A | p.Asp1155Asn | p.D1155N | Q96PX9 | protein_coding | deleterious(0.04) | benign(0) | TCGA-S3-AA12-01 | Breast | breast invasive carcinoma | Female | >=65 | III/IV | Hormone Therapy | anastrozole | SD |
| PLEKHG4B | SNV | Missense_Mutation | novel | c.1964G>A | p.Gly655Asp | p.G655D | Q96PX9 | protein_coding | tolerated(0.53) | benign(0.109) | TCGA-2W-A8YY-01 | Cervix | cervical & endocervical cancer | Female | <65 | I/II | Chemotherapy | cisplatin | CR |
| PLEKHG4B | SNV | Missense_Mutation | novel | c.3163A>G | p.Ile1055Val | p.I1055V | Q96PX9 | protein_coding | tolerated(0.07) | benign(0.223) | TCGA-2W-A8YY-01 | Cervix | cervical & endocervical cancer | Female | <65 | I/II | Chemotherapy | cisplatin | CR |
| Page: 1 2 3 4 5 6 7 8 9 10 11 12 13 14 15 16 17 |
Top |
Related drugs of malignant transformation related genes |
| Identification of chemicals and drugs interact with genes involved in malignant transfromation |
| (DGIdb 4.0) |
| Entrez ID | Symbol | Category | Interaction Types | Drug Claim Name | Drug Name | PMIDs |
| Page: 1 |

Copyright 2023-Present -The University of Texas Health Science Center at Houston |