
|
|||||
|
 | |
| |
| |
| |
| |
| |
|
Gene: PLEKHG3 |
Gene summary for PLEKHG3 |
| Gene information | Species | Human | Gene symbol | PLEKHG3 | Gene ID | 26030 |
| Gene name | pleckstrin homology and RhoGEF domain containing G3 | |
| Gene Alias | ARHGEF43 | |
| Cytomap | 14q23.3 | |
| Gene Type | protein-coding | GO ID | GO:0007154 | UniProtAcc | A1L390 |
Top |
Malignant transformation analysis |
| Identification of the aberrant gene expression in precancerous and cancerous lesions by comparing the gene expression of stem-like cells in diseased tissues with normal stem cells |
| Entrez ID | Symbol | Replicates | Species | Organ | Tissue | Adj P-value | Log2FC | Malignancy |
| 26030 | PLEKHG3 | CCI_1 | Human | Cervix | CC | 1.50e-03 | 5.13e-01 | 0.528 |
| 26030 | PLEKHG3 | CCI_3 | Human | Cervix | CC | 6.14e-10 | 7.05e-01 | 0.516 |
| 26030 | PLEKHG3 | LZE4T | Human | Esophagus | ESCC | 2.90e-04 | 8.82e-02 | 0.0811 |
| 26030 | PLEKHG3 | LZE7T | Human | Esophagus | ESCC | 1.91e-02 | -3.35e-02 | 0.0667 |
| 26030 | PLEKHG3 | LZE20T | Human | Esophagus | ESCC | 2.45e-06 | 9.84e-02 | 0.0662 |
| 26030 | PLEKHG3 | LZE22D1 | Human | Esophagus | HGIN | 1.85e-03 | 8.95e-03 | 0.0595 |
| 26030 | PLEKHG3 | LZE24T | Human | Esophagus | ESCC | 3.32e-05 | 3.93e-02 | 0.0596 |
| 26030 | PLEKHG3 | LZE21T | Human | Esophagus | ESCC | 4.22e-06 | 1.93e-01 | 0.0655 |
| 26030 | PLEKHG3 | P1T-E | Human | Esophagus | ESCC | 1.62e-03 | 1.75e-01 | 0.0875 |
| 26030 | PLEKHG3 | P2T-E | Human | Esophagus | ESCC | 1.47e-10 | 1.09e-01 | 0.1177 |
| 26030 | PLEKHG3 | P4T-E | Human | Esophagus | ESCC | 2.07e-17 | 2.19e-01 | 0.1323 |
| 26030 | PLEKHG3 | P5T-E | Human | Esophagus | ESCC | 1.30e-08 | -7.93e-02 | 0.1327 |
| 26030 | PLEKHG3 | P8T-E | Human | Esophagus | ESCC | 2.00e-10 | 1.94e-01 | 0.0889 |
| 26030 | PLEKHG3 | P9T-E | Human | Esophagus | ESCC | 7.11e-08 | -6.49e-02 | 0.1131 |
| 26030 | PLEKHG3 | P10T-E | Human | Esophagus | ESCC | 1.43e-15 | 3.54e-01 | 0.116 |
| 26030 | PLEKHG3 | P12T-E | Human | Esophagus | ESCC | 1.03e-12 | 1.92e-01 | 0.1122 |
| 26030 | PLEKHG3 | P15T-E | Human | Esophagus | ESCC | 6.35e-21 | 5.95e-01 | 0.1149 |
| 26030 | PLEKHG3 | P16T-E | Human | Esophagus | ESCC | 5.01e-09 | -6.56e-03 | 0.1153 |
| 26030 | PLEKHG3 | P17T-E | Human | Esophagus | ESCC | 2.41e-05 | 1.56e-01 | 0.1278 |
| 26030 | PLEKHG3 | P19T-E | Human | Esophagus | ESCC | 1.09e-02 | 4.39e-02 | 0.1662 |
| Page: 1 2 3 4 |
| Tissue | Expression Dynamics | Abbreviation |
| Cervix | 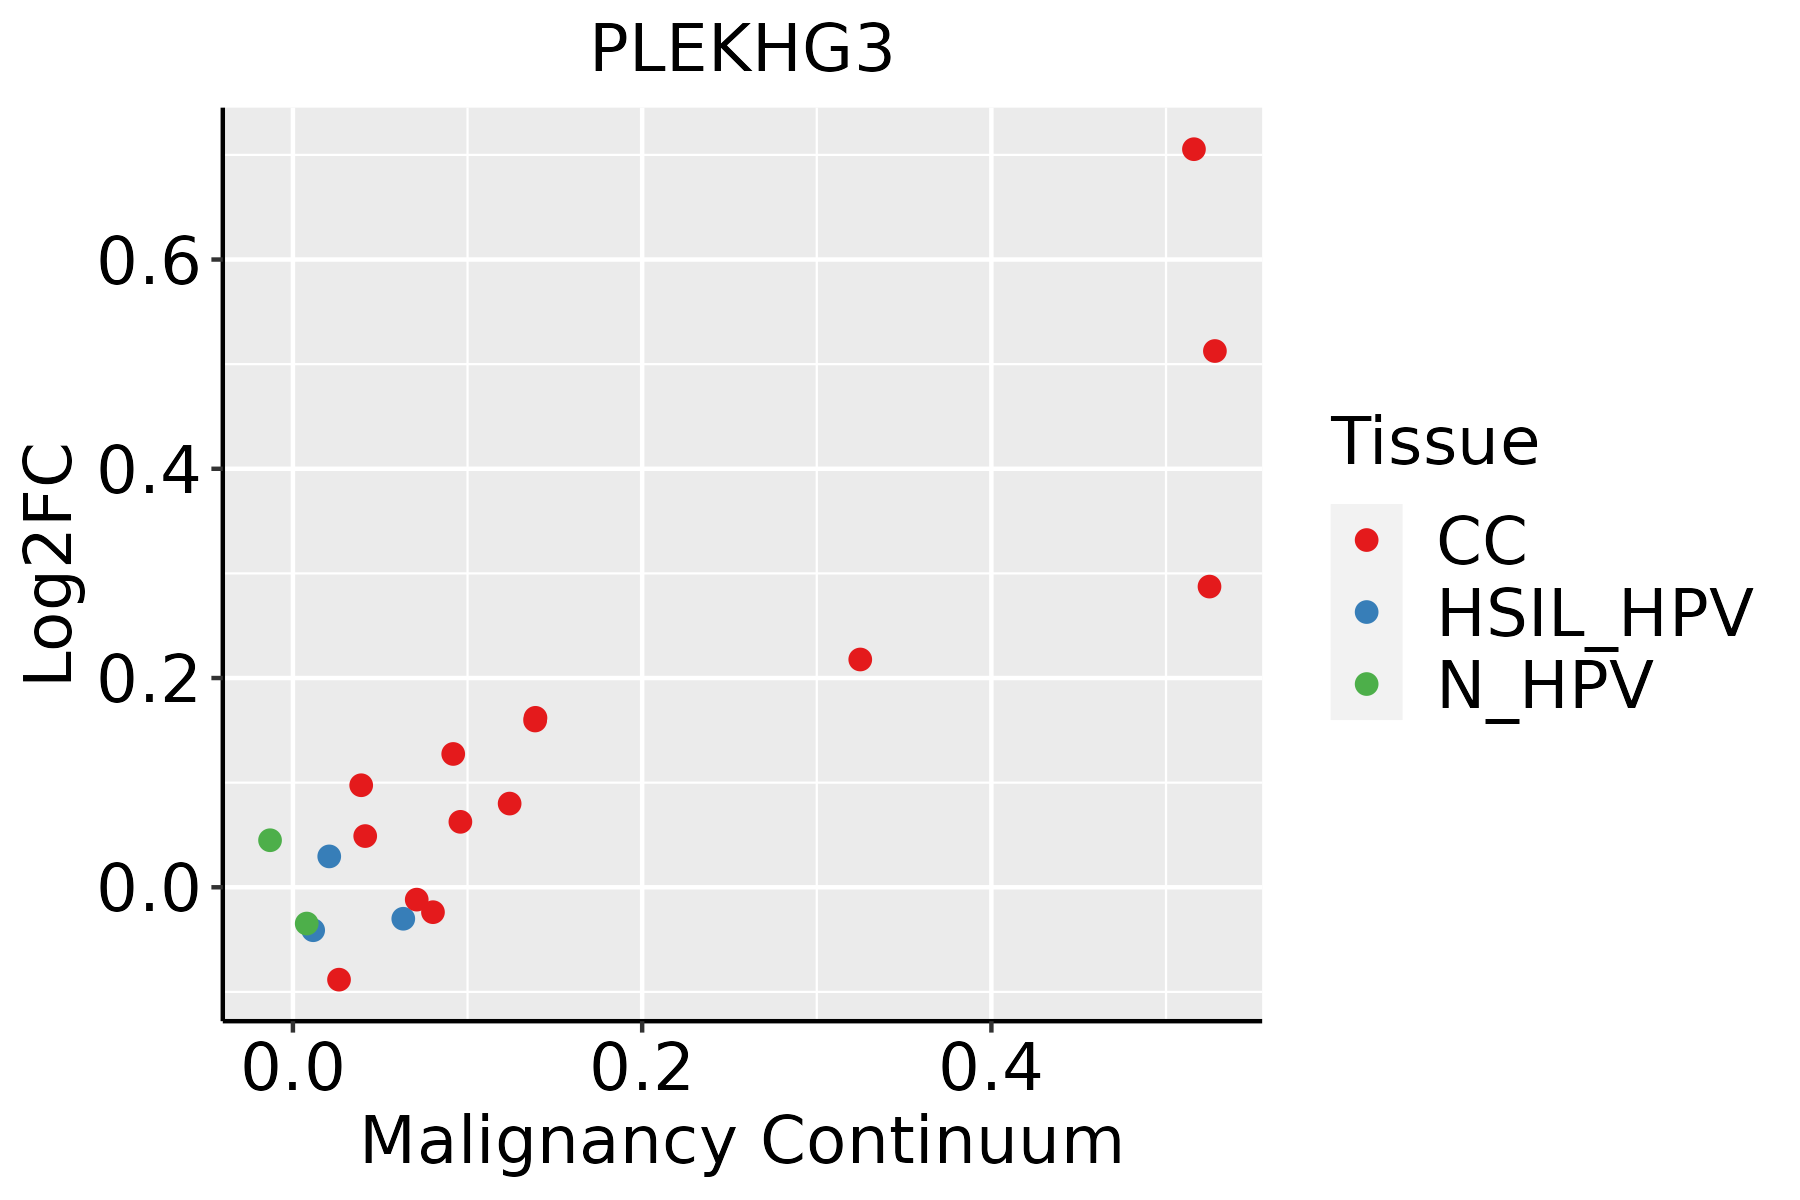 | CC: Cervix cancer |
| HSIL_HPV: HPV-infected high-grade squamous intraepithelial lesions | ||
| N_HPV: HPV-infected normal cervix | ||
| Esophagus | 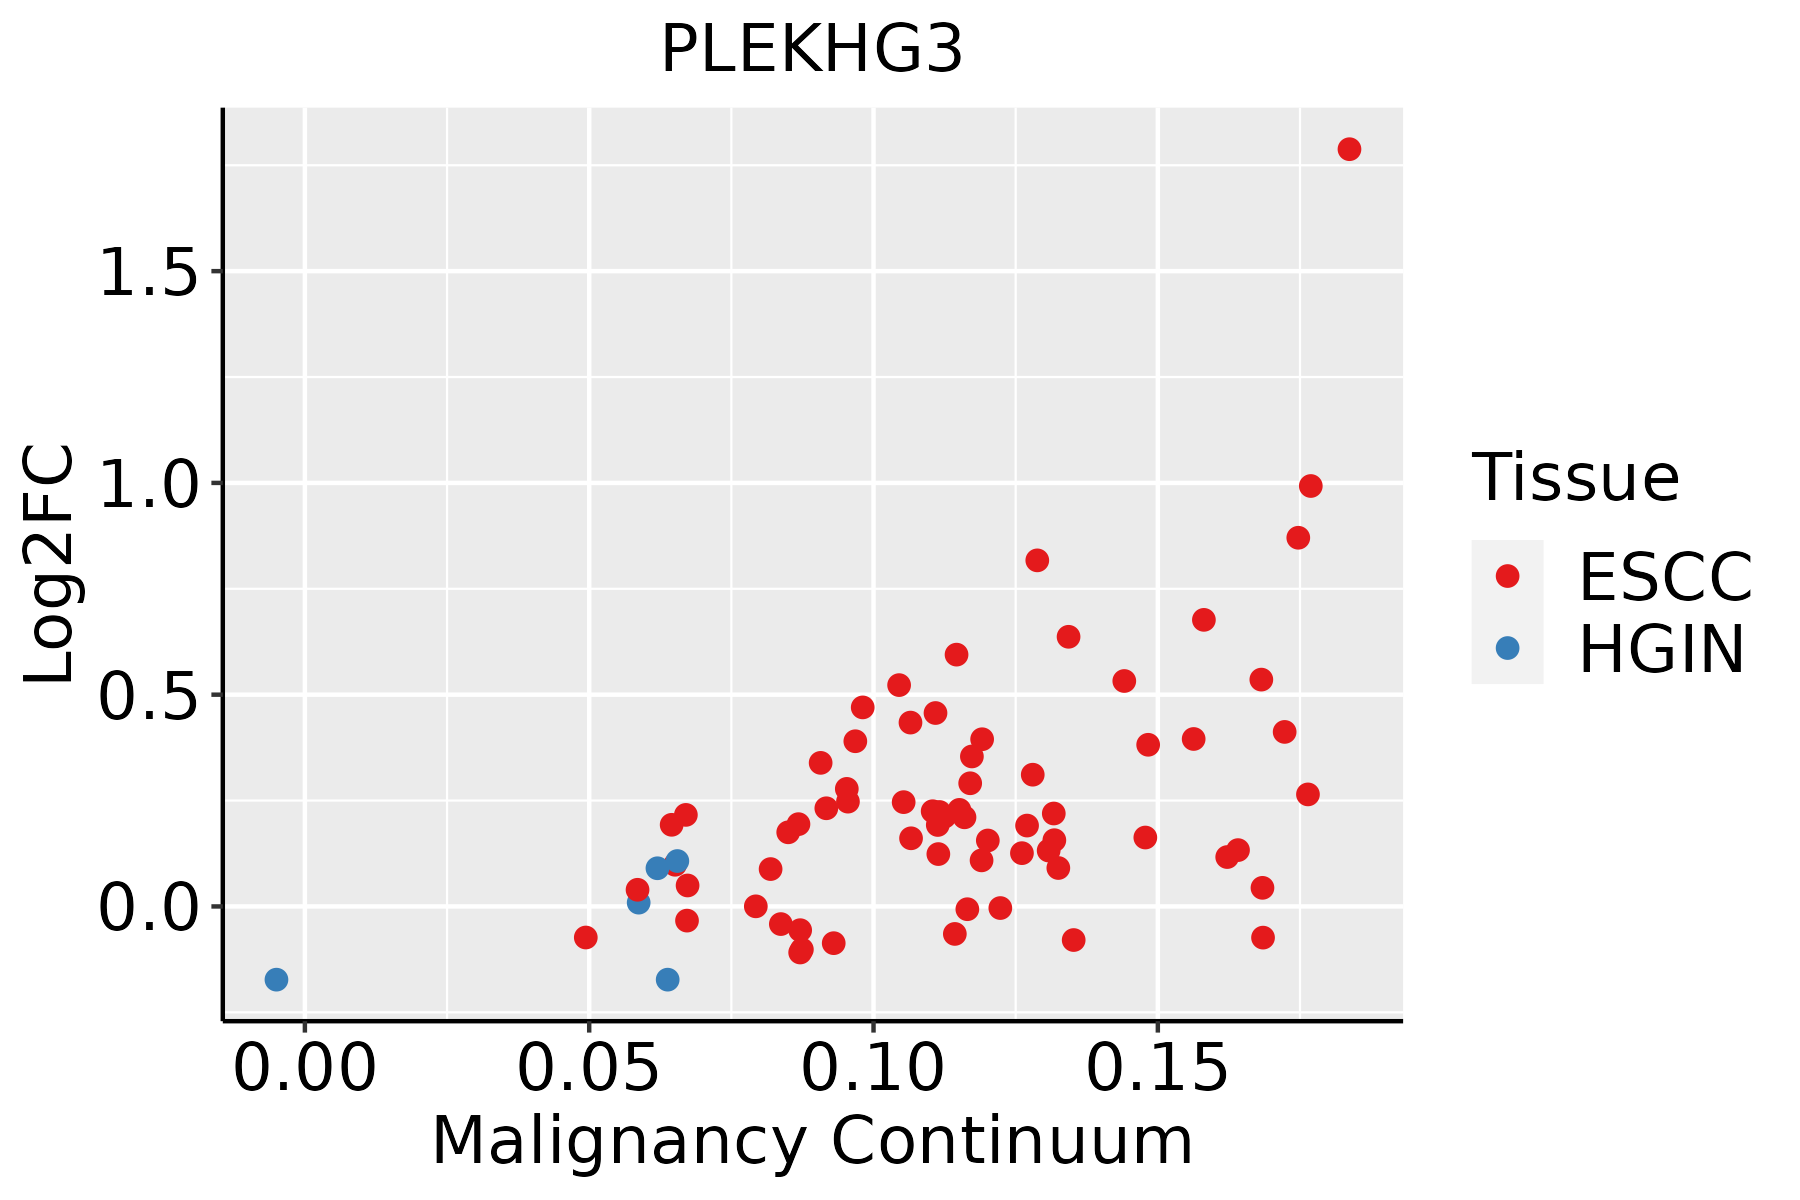 | ESCC: Esophageal squamous cell carcinoma |
| HGIN: High-grade intraepithelial neoplasias | ||
| LGIN: Low-grade intraepithelial neoplasias | ||
| Oral Cavity | 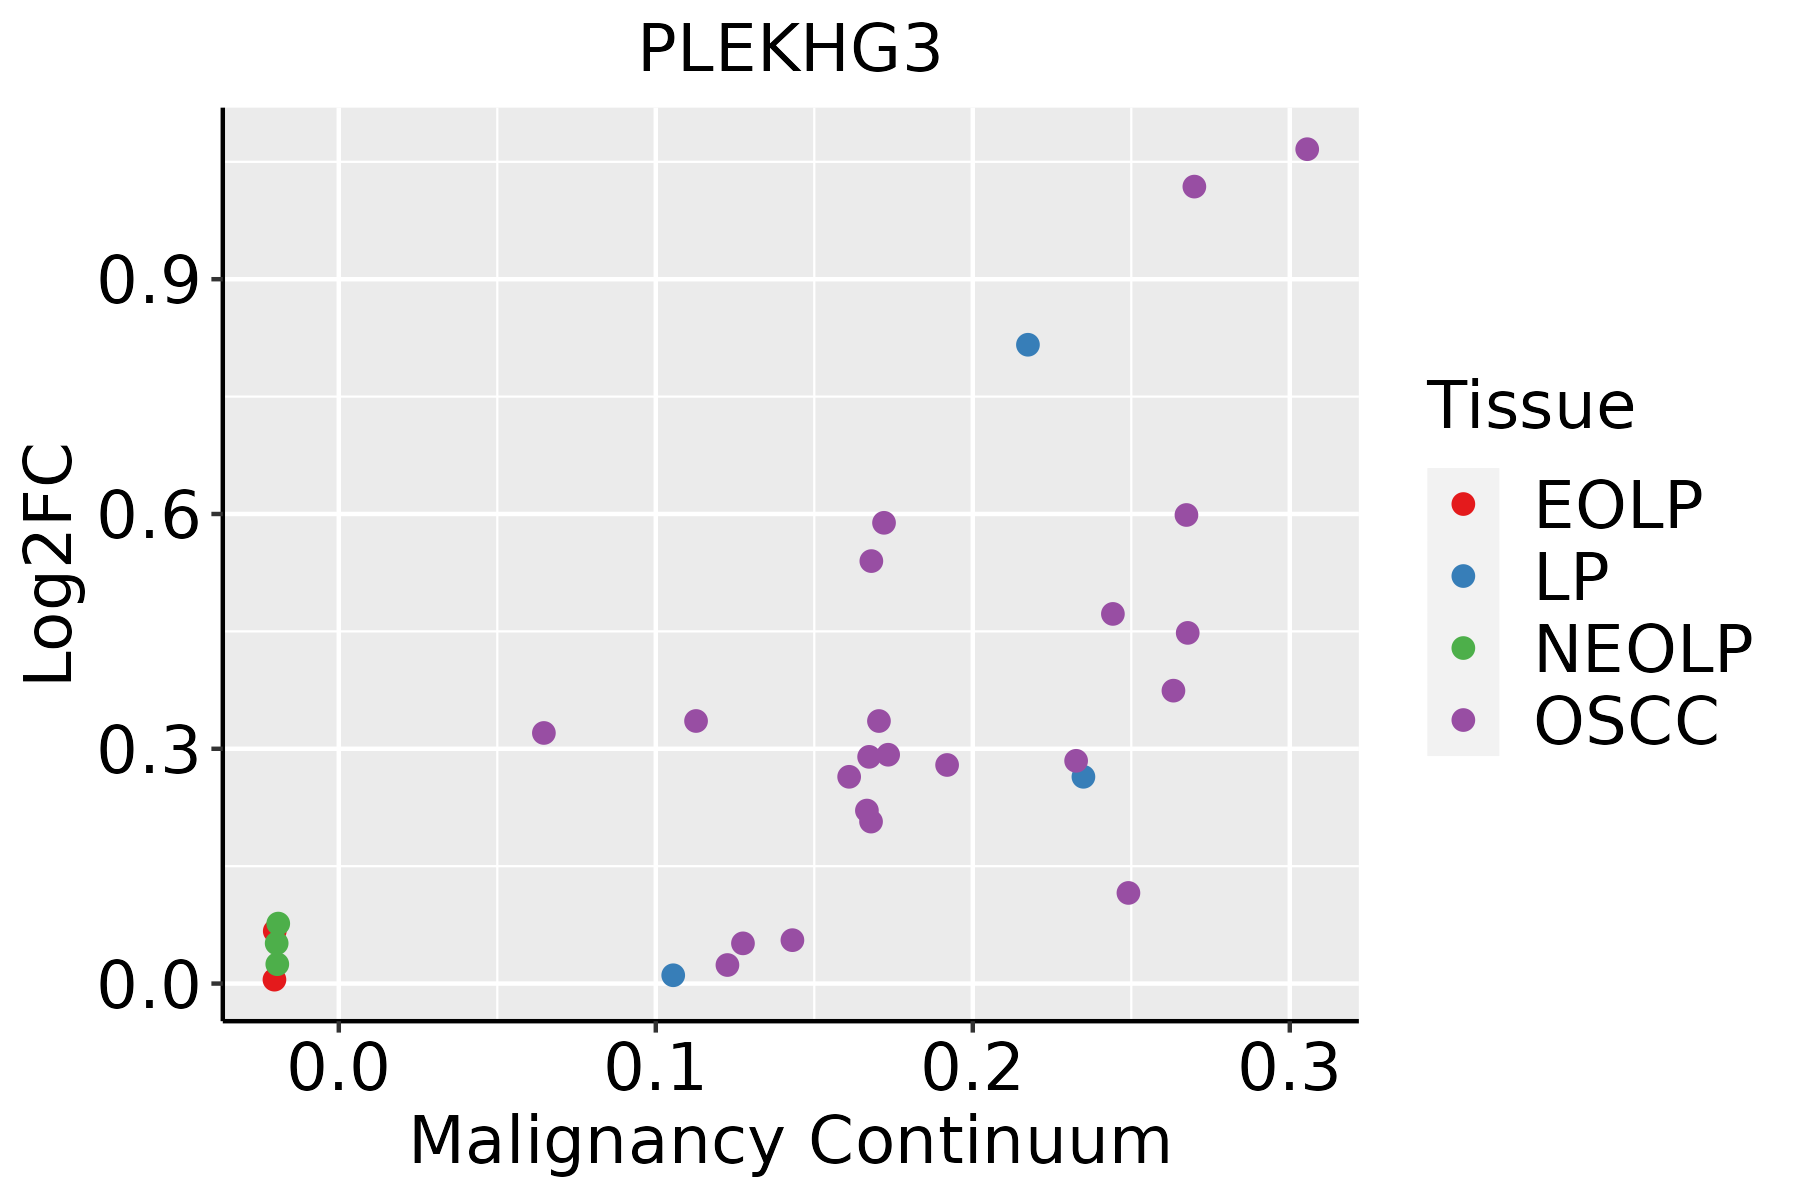 | EOLP: Erosive Oral lichen planus |
| LP: leukoplakia | ||
| NEOLP: Non-erosive oral lichen planus | ||
| OSCC: Oral squamous cell carcinoma | ||
| Skin | 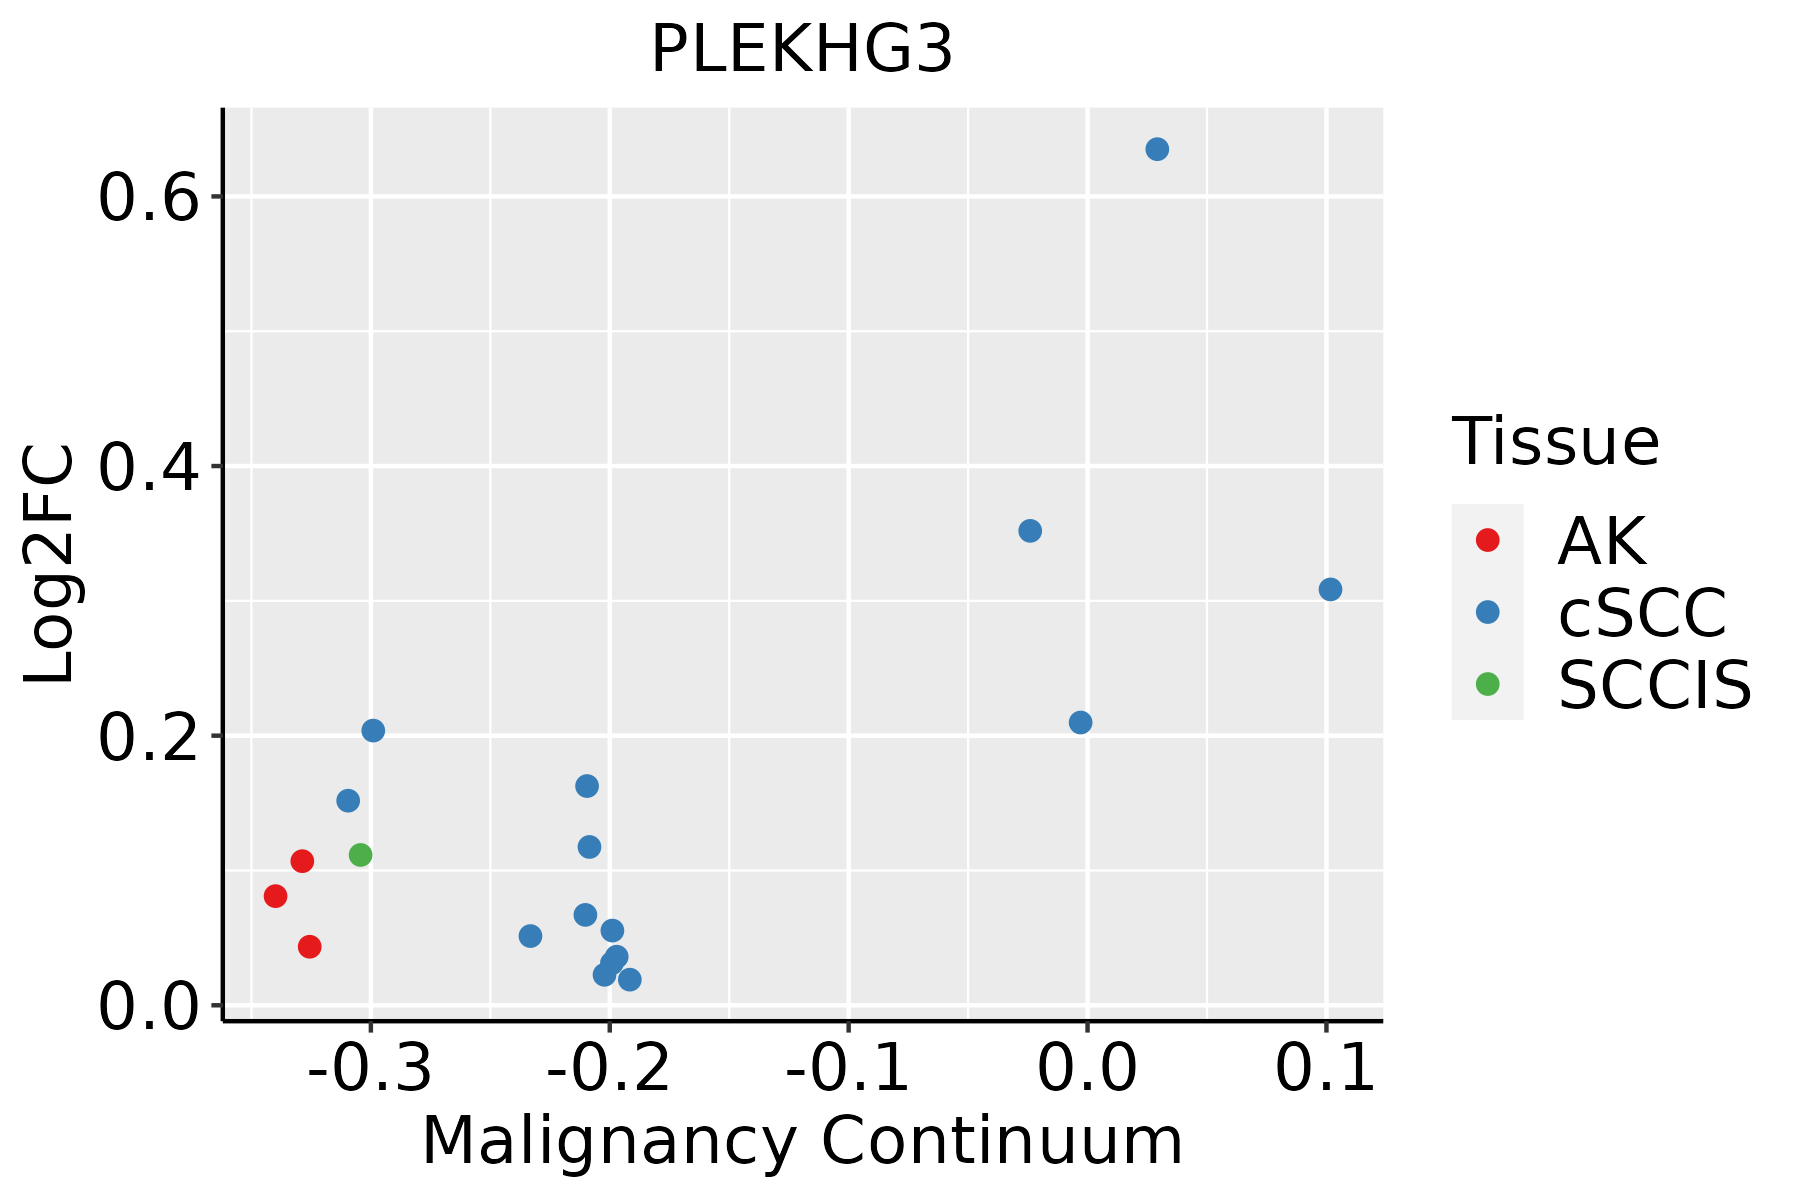 | AK: Actinic keratosis |
| cSCC: Cutaneous squamous cell carcinoma | ||
| SCCIS:squamous cell carcinoma in situ |
| ∗log2FC in expression of this searched gene in stem-like cells from each diseased tissue sample relative to stem-like cells in normal samples in each tissue plotted against the malignancy continuum. Samples are colored based on if they are from different disease stage. |
Top |
Malignant transformation related pathway analysis |
| Find out the enriched GO biological processes and KEGG pathways involved in transition from healthy to precancer to cancer |
| Tissue | Disease Stage | Enriched GO biological Processes |
| Colorectum | AD |  |
| Colorectum | SER |  |
| Colorectum | MSS |  |
| Colorectum | MSI-H |  |
| Colorectum | FAP |  |
| ∗Top 15 enriched GO BP terms are showed in the bar plot of each disease state in each tissue. Each row represents a significant GO biological process which is colored according to the -log10(p.adjust). |
| Page: 1 2 3 4 5 6 7 8 9 |
| GO ID | Tissue | Disease Stage | Description | Gene Ratio | Bg Ratio | pvalue | p.adjust | Count |
| GO:00510566 | Cervix | CC | regulation of small GTPase mediated signal transduction | 75/2311 | 302/18723 | 1.54e-09 | 1.74e-07 | 75 |
| GO:005105610 | Esophagus | ESCC | regulation of small GTPase mediated signal transduction | 157/8552 | 302/18723 | 1.55e-02 | 4.98e-02 | 157 |
| Page: 1 |
| Pathway ID | Tissue | Disease Stage | Description | Gene Ratio | Bg Ratio | pvalue | p.adjust | qvalue | Count |
| Page: 1 |
Top |
Cell-cell communication analysis |
| Identification of potential cell-cell interactions between two cell types and their ligand-receptor pairs for different disease states |
| Ligand | Receptor | LRpair | Pathway | Tissue | Disease Stage |
| Page: 1 |
Top |
Single-cell gene regulatory network inference analysis |
| Find out the significant the regulons (TFs) and the target genes of each regulon across cell types for different disease states |
| TF | Cell Type | Tissue | Disease Stage | Target Gene | RSS | Regulon Activity |
| ∗The dot plots of a searched regulon are shown for all cell subpopulations in each disease state of each tissue based on the regulon specific score inferred using pySCENIC and by calculating the average expression. |
| Page: 1 |
Top |
Somatic mutation of malignant transformation related genes |
| Annotation of somatic variants for genes involved in malignant transformation |
| Hugo Symbol | Variant Class | Variant Classification | dbSNP RS | HGVSc | HGVSp | HGVSp Short | SWISSPROT | BIOTYPE | SIFT | PolyPhen | Tumor Sample Barcode | Tissue | Histology | Sex | Age | Stage | Therapy Types | Drugs | Outcome |
| PLEKHG3 | SNV | Missense_Mutation | c.172N>G | p.Leu58Val | p.L58V | A1L390 | protein_coding | tolerated(0.43) | benign(0.001) | TCGA-AC-A23H-01 | Breast | breast invasive carcinoma | Female | >=65 | I/II | Unknown | Unknown | PD | |
| PLEKHG3 | SNV | Missense_Mutation | c.1625N>G | p.Glu542Gly | p.E542G | A1L390 | protein_coding | deleterious(0) | benign(0.195) | TCGA-AN-A0AL-01 | Breast | breast invasive carcinoma | Female | <65 | III/IV | Unknown | Unknown | SD | |
| PLEKHG3 | SNV | Missense_Mutation | rs779117999 | c.772N>T | p.Ala258Ser | p.A258S | A1L390 | protein_coding | deleterious(0) | probably_damaging(1) | TCGA-B6-A0I9-01 | Breast | breast invasive carcinoma | Female | <65 | III/IV | Unknown | Unknown | PD |
| PLEKHG3 | SNV | Missense_Mutation | rs779117999 | c.772G>T | p.Ala258Ser | p.A258S | A1L390 | protein_coding | deleterious(0) | probably_damaging(1) | TCGA-C8-A26X-01 | Breast | breast invasive carcinoma | Female | <65 | I/II | Chemotherapy | 5-fluorouracil | CR |
| PLEKHG3 | SNV | Missense_Mutation | rs779117999 | c.772N>T | p.Ala258Ser | p.A258S | A1L390 | protein_coding | deleterious(0) | probably_damaging(1) | TCGA-C8-A274-01 | Breast | breast invasive carcinoma | Female | <65 | I/II | Hormone Therapy | tamoxiphen | SD |
| PLEKHG3 | SNV | Missense_Mutation | c.2132N>T | p.Thr711Ile | p.T711I | A1L390 | protein_coding | deleterious(0.02) | possibly_damaging(0.567) | TCGA-D8-A140-01 | Breast | breast invasive carcinoma | Female | <65 | I/II | Chemotherapy | doxorubicin+cyclophosphamid | SD | |
| PLEKHG3 | SNV | Missense_Mutation | novel | c.645N>T | p.Gln215His | p.Q215H | A1L390 | protein_coding | deleterious(0) | benign(0.044) | TCGA-2W-A8YY-01 | Cervix | cervical & endocervical cancer | Female | <65 | I/II | Chemotherapy | cisplatin | CR |
| PLEKHG3 | SNV | Missense_Mutation | rs781274507 | c.929N>A | p.Arg310His | p.R310H | A1L390 | protein_coding | tolerated(0.23) | benign(0.426) | TCGA-2W-A8YY-01 | Cervix | cervical & endocervical cancer | Female | <65 | I/II | Chemotherapy | cisplatin | CR |
| PLEKHG3 | SNV | Missense_Mutation | novel | c.2443N>A | p.Val815Met | p.V815M | A1L390 | protein_coding | deleterious(0.01) | possibly_damaging(0.732) | TCGA-2W-A8YY-01 | Cervix | cervical & endocervical cancer | Female | <65 | I/II | Chemotherapy | cisplatin | CR |
| PLEKHG3 | SNV | Missense_Mutation | c.2530N>A | p.Glu844Lys | p.E844K | A1L390 | protein_coding | deleterious(0.04) | probably_damaging(0.99) | TCGA-C5-A1MK-01 | Cervix | cervical & endocervical cancer | Female | >=65 | III/IV | Chemotherapy | carboplatin | PD |
| Page: 1 2 3 4 5 6 7 8 9 10 |
Top |
Related drugs of malignant transformation related genes |
| Identification of chemicals and drugs interact with genes involved in malignant transfromation |
| (DGIdb 4.0) |
| Entrez ID | Symbol | Category | Interaction Types | Drug Claim Name | Drug Name | PMIDs |
| Page: 1 |

Copyright 2023-Present -The University of Texas Health Science Center at Houston |