
|
|||||
|
 | |
| |
| |
| |
| |
| |
|
Gene: PLEKHG2 |
Gene summary for PLEKHG2 |
| Gene information | Species | Human | Gene symbol | PLEKHG2 | Gene ID | 64857 |
| Gene name | pleckstrin homology and RhoGEF domain containing G2 | |
| Gene Alias | ARHGEF42 | |
| Cytomap | 19q13.2 | |
| Gene Type | protein-coding | GO ID | GO:0006996 | UniProtAcc | Q9H7P9 |
Top |
Malignant transformation analysis |
| Identification of the aberrant gene expression in precancerous and cancerous lesions by comparing the gene expression of stem-like cells in diseased tissues with normal stem cells |
| Entrez ID | Symbol | Replicates | Species | Organ | Tissue | Adj P-value | Log2FC | Malignancy |
| 64857 | PLEKHG2 | HCC1_Meng | Human | Liver | HCC | 1.45e-22 | 2.65e-02 | 0.0246 |
| 64857 | PLEKHG2 | HCC1 | Human | Liver | HCC | 4.65e-04 | 2.58e+00 | 0.5336 |
| 64857 | PLEKHG2 | HCC2 | Human | Liver | HCC | 2.52e-06 | 9.94e-01 | 0.5341 |
| 64857 | PLEKHG2 | HCC5 | Human | Liver | HCC | 2.17e-02 | 7.50e-01 | 0.4932 |
| 64857 | PLEKHG2 | S014 | Human | Liver | HCC | 4.48e-06 | 2.30e-01 | 0.2254 |
| 64857 | PLEKHG2 | S015 | Human | Liver | HCC | 2.83e-10 | 3.87e-01 | 0.2375 |
| 64857 | PLEKHG2 | S016 | Human | Liver | HCC | 4.99e-09 | 2.99e-01 | 0.2243 |
| 64857 | PLEKHG2 | male-WTA | Human | Thyroid | PTC | 6.79e-06 | 6.93e-02 | 0.1037 |
| 64857 | PLEKHG2 | PTC03 | Human | Thyroid | PTC | 6.54e-05 | 1.75e-01 | 0.1784 |
| 64857 | PLEKHG2 | PTC04 | Human | Thyroid | PTC | 1.93e-06 | 2.48e-01 | 0.1927 |
| 64857 | PLEKHG2 | PTC05 | Human | Thyroid | PTC | 8.85e-09 | 2.09e-01 | 0.2065 |
| 64857 | PLEKHG2 | PTC06 | Human | Thyroid | PTC | 1.79e-04 | 2.96e-01 | 0.2057 |
| 64857 | PLEKHG2 | PTC07 | Human | Thyroid | PTC | 5.02e-11 | 2.90e-01 | 0.2044 |
| 64857 | PLEKHG2 | ATC09 | Human | Thyroid | ATC | 1.54e-02 | 1.48e-01 | 0.2871 |
| 64857 | PLEKHG2 | ATC11 | Human | Thyroid | ATC | 3.04e-02 | 2.15e-01 | 0.3386 |
| 64857 | PLEKHG2 | ATC12 | Human | Thyroid | ATC | 3.20e-06 | 1.77e-01 | 0.34 |
| 64857 | PLEKHG2 | ATC13 | Human | Thyroid | ATC | 5.17e-87 | 1.40e+00 | 0.34 |
| 64857 | PLEKHG2 | ATC1 | Human | Thyroid | ATC | 5.43e-04 | 1.95e-01 | 0.2878 |
| 64857 | PLEKHG2 | ATC3 | Human | Thyroid | ATC | 1.00e-06 | 2.81e-01 | 0.338 |
| 64857 | PLEKHG2 | ATC4 | Human | Thyroid | ATC | 6.01e-11 | 2.49e-01 | 0.34 |
| Page: 1 2 |
| Tissue | Expression Dynamics | Abbreviation |
| Liver | 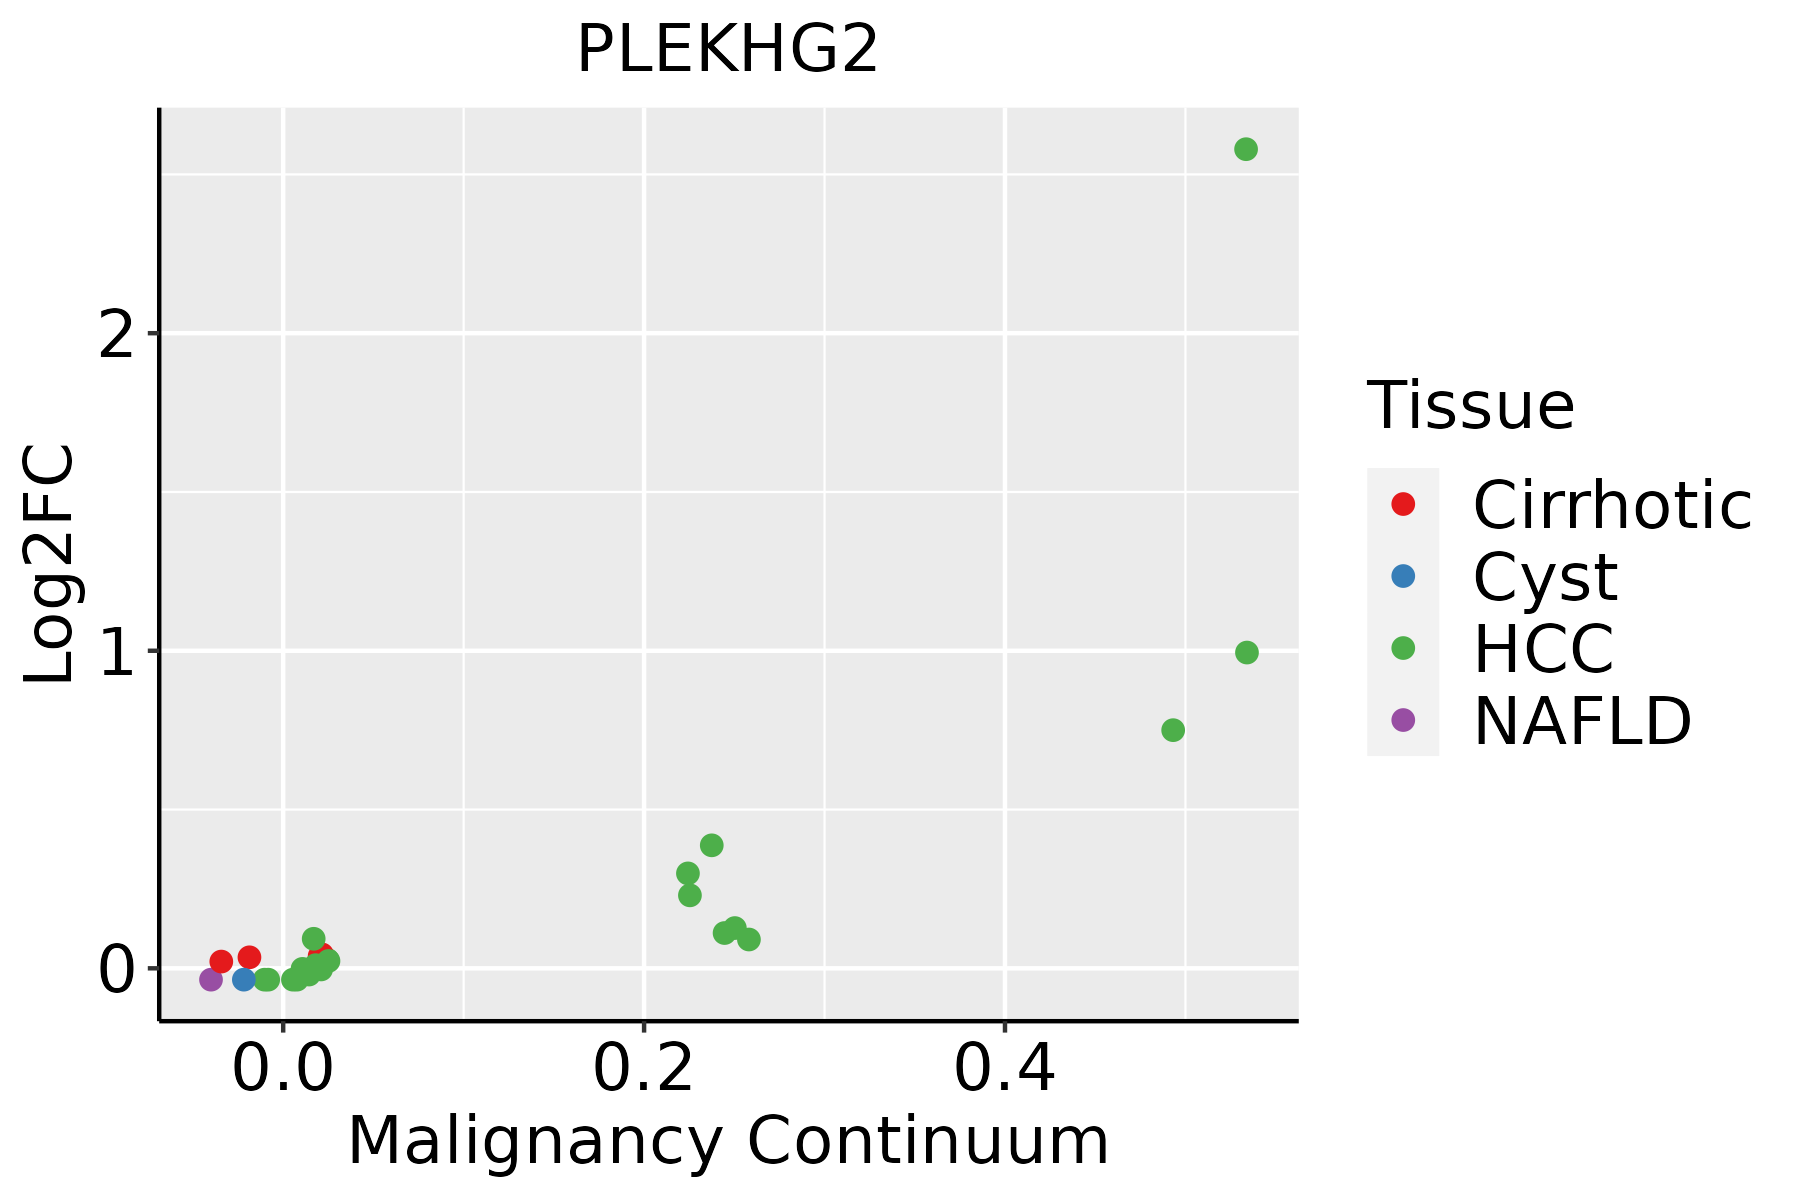 | HCC: Hepatocellular carcinoma |
| NAFLD: Non-alcoholic fatty liver disease | ||
| Thyroid |  | ATC: Anaplastic thyroid cancer |
| HT: Hashimoto's thyroiditis | ||
| PTC: Papillary thyroid cancer |
| ∗log2FC in expression of this searched gene in stem-like cells from each diseased tissue sample relative to stem-like cells in normal samples in each tissue plotted against the malignancy continuum. Samples are colored based on if they are from different disease stage. |
Top |
Malignant transformation related pathway analysis |
| Find out the enriched GO biological processes and KEGG pathways involved in transition from healthy to precancer to cancer |
| Tissue | Disease Stage | Enriched GO biological Processes |
| Colorectum | AD |  |
| Colorectum | SER |  |
| Colorectum | MSS |  |
| Colorectum | MSI-H |  |
| Colorectum | FAP |  |
| ∗Top 15 enriched GO BP terms are showed in the bar plot of each disease state in each tissue. Each row represents a significant GO biological process which is colored according to the -log10(p.adjust). |
| Page: 1 2 3 4 5 6 7 8 9 |
| GO ID | Tissue | Disease Stage | Description | Gene Ratio | Bg Ratio | pvalue | p.adjust | Count |
| GO:004325422 | Liver | HCC | regulation of protein-containing complex assembly | 264/7958 | 428/18723 | 5.47e-16 | 4.39e-14 | 264 |
| GO:005125822 | Liver | HCC | protein polymerization | 182/7958 | 297/18723 | 4.17e-11 | 1.58e-09 | 182 |
| GO:190290322 | Liver | HCC | regulation of supramolecular fiber organization | 224/7958 | 383/18723 | 1.54e-10 | 5.33e-09 | 224 |
| GO:000701522 | Liver | HCC | actin filament organization | 252/7958 | 442/18723 | 3.83e-10 | 1.25e-08 | 252 |
| GO:003253522 | Liver | HCC | regulation of cellular component size | 217/7958 | 383/18723 | 1.28e-08 | 3.14e-07 | 217 |
| GO:003227122 | Liver | HCC | regulation of protein polymerization | 141/7958 | 233/18723 | 2.00e-08 | 4.72e-07 | 141 |
| GO:003297022 | Liver | HCC | regulation of actin filament-based process | 222/7958 | 397/18723 | 3.81e-08 | 8.30e-07 | 222 |
| GO:003295622 | Liver | HCC | regulation of actin cytoskeleton organization | 202/7958 | 358/18723 | 6.18e-08 | 1.29e-06 | 202 |
| GO:000815422 | Liver | HCC | actin polymerization or depolymerization | 130/7958 | 218/18723 | 2.31e-07 | 4.14e-06 | 130 |
| GO:003004122 | Liver | HCC | actin filament polymerization | 116/7958 | 191/18723 | 2.66e-07 | 4.68e-06 | 116 |
| GO:011005322 | Liver | HCC | regulation of actin filament organization | 158/7958 | 278/18723 | 9.01e-07 | 1.37e-05 | 158 |
| GO:003083212 | Liver | HCC | regulation of actin filament length | 113/7958 | 189/18723 | 1.16e-06 | 1.71e-05 | 113 |
| GO:003083322 | Liver | HCC | regulation of actin filament polymerization | 104/7958 | 172/18723 | 1.46e-06 | 2.08e-05 | 104 |
| GO:000806412 | Liver | HCC | regulation of actin polymerization or depolymerization | 112/7958 | 188/18723 | 1.65e-06 | 2.31e-05 | 112 |
| GO:1902903113 | Thyroid | PTC | regulation of supramolecular fiber organization | 202/5968 | 383/18723 | 1.16e-17 | 1.15e-15 | 202 |
| GO:0007015112 | Thyroid | PTC | actin filament organization | 225/5968 | 442/18723 | 3.76e-17 | 3.44e-15 | 225 |
| GO:0043254113 | Thyroid | PTC | regulation of protein-containing complex assembly | 215/5968 | 428/18723 | 1.23e-15 | 9.09e-14 | 215 |
| GO:0032956113 | Thyroid | PTC | regulation of actin cytoskeleton organization | 182/5968 | 358/18723 | 4.64e-14 | 2.79e-12 | 182 |
| GO:0032970113 | Thyroid | PTC | regulation of actin filament-based process | 197/5968 | 397/18723 | 8.91e-14 | 4.89e-12 | 197 |
| GO:0051258113 | Thyroid | PTC | protein polymerization | 154/5968 | 297/18723 | 5.35e-13 | 2.66e-11 | 154 |
| Page: 1 2 3 |
| Pathway ID | Tissue | Disease Stage | Description | Gene Ratio | Bg Ratio | pvalue | p.adjust | qvalue | Count |
| Page: 1 |
Top |
Cell-cell communication analysis |
| Identification of potential cell-cell interactions between two cell types and their ligand-receptor pairs for different disease states |
| Ligand | Receptor | LRpair | Pathway | Tissue | Disease Stage |
| Page: 1 |
Top |
Single-cell gene regulatory network inference analysis |
| Find out the significant the regulons (TFs) and the target genes of each regulon across cell types for different disease states |
| TF | Cell Type | Tissue | Disease Stage | Target Gene | RSS | Regulon Activity |
| ∗The dot plots of a searched regulon are shown for all cell subpopulations in each disease state of each tissue based on the regulon specific score inferred using pySCENIC and by calculating the average expression. |
| Page: 1 |
Top |
Somatic mutation of malignant transformation related genes |
| Annotation of somatic variants for genes involved in malignant transformation |
| Hugo Symbol | Variant Class | Variant Classification | dbSNP RS | HGVSc | HGVSp | HGVSp Short | SWISSPROT | BIOTYPE | SIFT | PolyPhen | Tumor Sample Barcode | Tissue | Histology | Sex | Age | Stage | Therapy Types | Drugs | Outcome |
| PLEKHG2 | SNV | Missense_Mutation | rs780273825 | c.853N>T | p.Arg285Cys | p.R285C | Q9H7P9 | protein_coding | deleterious_low_confidence(0) | probably_damaging(0.996) | TCGA-A2-A0T2-01 | Breast | breast invasive carcinoma | Female | >=65 | III/IV | Chemotherapy | xeloda | PD |
| PLEKHG2 | SNV | Missense_Mutation | c.62N>A | p.Arg21Gln | p.R21Q | Q9H7P9 | protein_coding | deleterious_low_confidence(0.03) | benign(0.059) | TCGA-AC-A23H-01 | Breast | breast invasive carcinoma | Female | >=65 | I/II | Unknown | Unknown | PD | |
| PLEKHG2 | SNV | Missense_Mutation | c.1236N>C | p.Glu412Asp | p.E412D | Q9H7P9 | protein_coding | deleterious_low_confidence(0.01) | benign(0.079) | TCGA-AC-A23H-01 | Breast | breast invasive carcinoma | Female | >=65 | I/II | Unknown | Unknown | PD | |
| PLEKHG2 | SNV | Missense_Mutation | c.3544N>T | p.Pro1182Ser | p.P1182S | Q9H7P9 | protein_coding | deleterious_low_confidence(0.03) | benign(0.012) | TCGA-AC-A23H-01 | Breast | breast invasive carcinoma | Female | >=65 | I/II | Unknown | Unknown | PD | |
| PLEKHG2 | SNV | Missense_Mutation | c.184N>C | p.Gly62Arg | p.G62R | Q9H7P9 | protein_coding | deleterious_low_confidence(0) | probably_damaging(0.999) | TCGA-AO-A1KS-01 | Breast | breast invasive carcinoma | Female | >=65 | I/II | Hormone Therapy | arimidex | SD | |
| PLEKHG2 | SNV | Missense_Mutation | c.2905N>A | p.Leu969Ile | p.L969I | Q9H7P9 | protein_coding | tolerated_low_confidence(0.67) | benign(0) | TCGA-B6-A0IJ-01 | Breast | breast invasive carcinoma | Female | <65 | I/II | Unknown | Unknown | SD | |
| PLEKHG2 | SNV | Missense_Mutation | rs774674904 | c.1954G>A | p.Glu652Lys | p.E652K | Q9H7P9 | protein_coding | tolerated_low_confidence(0.81) | benign(0) | TCGA-D8-A1J8-01 | Breast | breast invasive carcinoma | Female | >=65 | I/II | Hormone Therapy | nolvadex | SD |
| PLEKHG2 | SNV | Missense_Mutation | novel | c.1206N>C | p.Trp402Cys | p.W402C | Q9H7P9 | protein_coding | deleterious_low_confidence(0) | probably_damaging(0.994) | TCGA-E2-A14U-01 | Breast | breast invasive carcinoma | Female | >=65 | I/II | Hormone Therapy | arimidex | SD |
| PLEKHG2 | SNV | Missense_Mutation | c.370N>T | p.Ile124Phe | p.I124F | Q9H7P9 | protein_coding | deleterious_low_confidence(0) | probably_damaging(0.996) | TCGA-EW-A1P6-01 | Breast | breast invasive carcinoma | Female | <65 | I/II | Chemotherapy | cyclophosphamide | SD | |
| PLEKHG2 | SNV | Missense_Mutation | rs759064788 | c.3142N>A | p.Glu1048Lys | p.E1048K | Q9H7P9 | protein_coding | deleterious_low_confidence(0.02) | benign(0) | TCGA-EW-A3E8-01 | Breast | breast invasive carcinoma | Female | <65 | I/II | Hormone Therapy | anastrozole | SD |
| Page: 1 2 3 4 5 6 7 8 9 10 11 12 |
Top |
Related drugs of malignant transformation related genes |
| Identification of chemicals and drugs interact with genes involved in malignant transfromation |
| (DGIdb 4.0) |
| Entrez ID | Symbol | Category | Interaction Types | Drug Claim Name | Drug Name | PMIDs |
| Page: 1 |

Copyright 2023-Present -The University of Texas Health Science Center at Houston |