
|
|||||
|
 | |
| |
| |
| |
| |
| |
|
Gene: PLEKHG1 |
Gene summary for PLEKHG1 |
| Gene information | Species | Human | Gene symbol | PLEKHG1 | Gene ID | 57480 |
| Gene name | pleckstrin homology and RhoGEF domain containing G1 | |
| Gene Alias | ARHGEF41 | |
| Cytomap | 6q25.1 | |
| Gene Type | protein-coding | GO ID | GO:0007154 | UniProtAcc | Q5JYA6 |
Top |
Malignant transformation analysis |
| Identification of the aberrant gene expression in precancerous and cancerous lesions by comparing the gene expression of stem-like cells in diseased tissues with normal stem cells |
| Entrez ID | Symbol | Replicates | Species | Organ | Tissue | Adj P-value | Log2FC | Malignancy |
| 57480 | PLEKHG1 | CCI_1 | Human | Cervix | CC | 5.17e-17 | 1.32e+00 | 0.528 |
| 57480 | PLEKHG1 | CCI_2 | Human | Cervix | CC | 1.07e-02 | 4.15e-01 | 0.5249 |
| 57480 | PLEKHG1 | CCI_3 | Human | Cervix | CC | 1.19e-19 | 1.08e+00 | 0.516 |
| 57480 | PLEKHG1 | sample3 | Human | Cervix | CC | 1.07e-02 | 1.57e-01 | 0.1387 |
| 57480 | PLEKHG1 | HTA11_3410_2000001011 | Human | Colorectum | AD | 5.05e-05 | -3.85e-01 | 0.0155 |
| 57480 | PLEKHG1 | HTA11_347_2000001011 | Human | Colorectum | AD | 1.48e-05 | 4.33e-01 | -0.1954 |
| 57480 | PLEKHG1 | HTA11_7696_3000711011 | Human | Colorectum | AD | 2.55e-03 | -3.40e-01 | 0.0674 |
| 57480 | PLEKHG1 | HTA11_99999970781_79442 | Human | Colorectum | MSS | 5.21e-22 | -6.21e-01 | 0.294 |
| 57480 | PLEKHG1 | HTA11_99999971662_82457 | Human | Colorectum | MSS | 1.60e-09 | -4.96e-01 | 0.3859 |
| 57480 | PLEKHG1 | HTA11_99999974143_84620 | Human | Colorectum | MSS | 1.64e-11 | -5.02e-01 | 0.3005 |
| 57480 | PLEKHG1 | A001-C-207 | Human | Colorectum | FAP | 5.55e-07 | -4.36e-01 | 0.1278 |
| 57480 | PLEKHG1 | A015-C-203 | Human | Colorectum | FAP | 3.54e-32 | -6.10e-01 | -0.1294 |
| 57480 | PLEKHG1 | A015-C-204 | Human | Colorectum | FAP | 9.07e-06 | -2.70e-01 | -0.0228 |
| 57480 | PLEKHG1 | A014-C-040 | Human | Colorectum | FAP | 3.12e-03 | -3.38e-01 | -0.1184 |
| 57480 | PLEKHG1 | A002-C-201 | Human | Colorectum | FAP | 1.51e-13 | -3.73e-01 | 0.0324 |
| 57480 | PLEKHG1 | A001-C-119 | Human | Colorectum | FAP | 1.42e-08 | -5.55e-01 | -0.1557 |
| 57480 | PLEKHG1 | A001-C-108 | Human | Colorectum | FAP | 6.39e-21 | -5.41e-01 | -0.0272 |
| 57480 | PLEKHG1 | A002-C-205 | Human | Colorectum | FAP | 1.05e-21 | -4.46e-01 | -0.1236 |
| 57480 | PLEKHG1 | A001-C-104 | Human | Colorectum | FAP | 4.12e-13 | -4.73e-01 | 0.0184 |
| 57480 | PLEKHG1 | A015-C-005 | Human | Colorectum | FAP | 8.15e-05 | -3.57e-01 | -0.0336 |
| Page: 1 2 3 4 5 6 |
| Tissue | Expression Dynamics | Abbreviation |
| Cervix |  | CC: Cervix cancer |
| HSIL_HPV: HPV-infected high-grade squamous intraepithelial lesions | ||
| N_HPV: HPV-infected normal cervix | ||
| Colorectum (GSE201348) |  | FAP: Familial adenomatous polyposis |
| CRC: Colorectal cancer | ||
| Colorectum (HTA11) |  | AD: Adenomas |
| SER: Sessile serrated lesions | ||
| MSI-H: Microsatellite-high colorectal cancer | ||
| MSS: Microsatellite stable colorectal cancer | ||
| Endometrium | 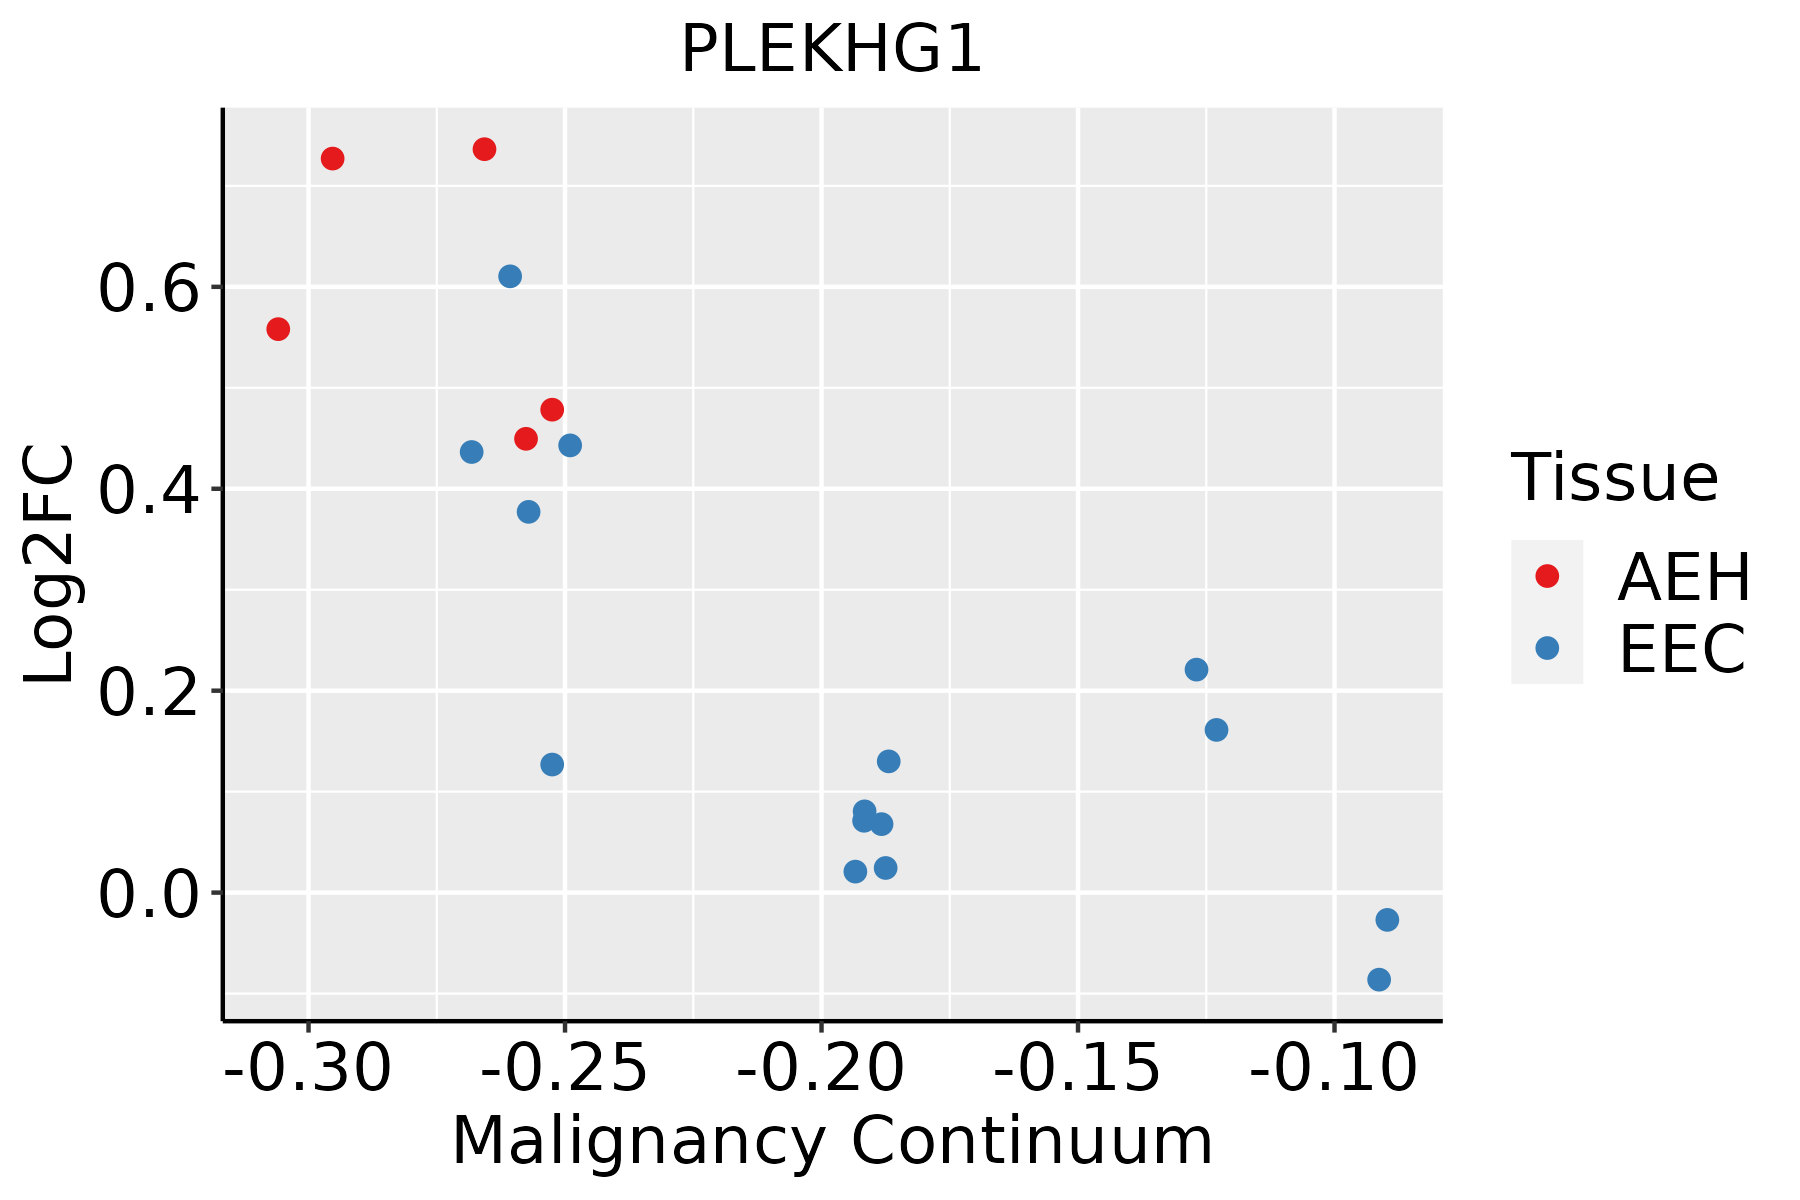 | AEH: Atypical endometrial hyperplasia |
| EEC: Endometrioid Cancer | ||
| Esophagus | 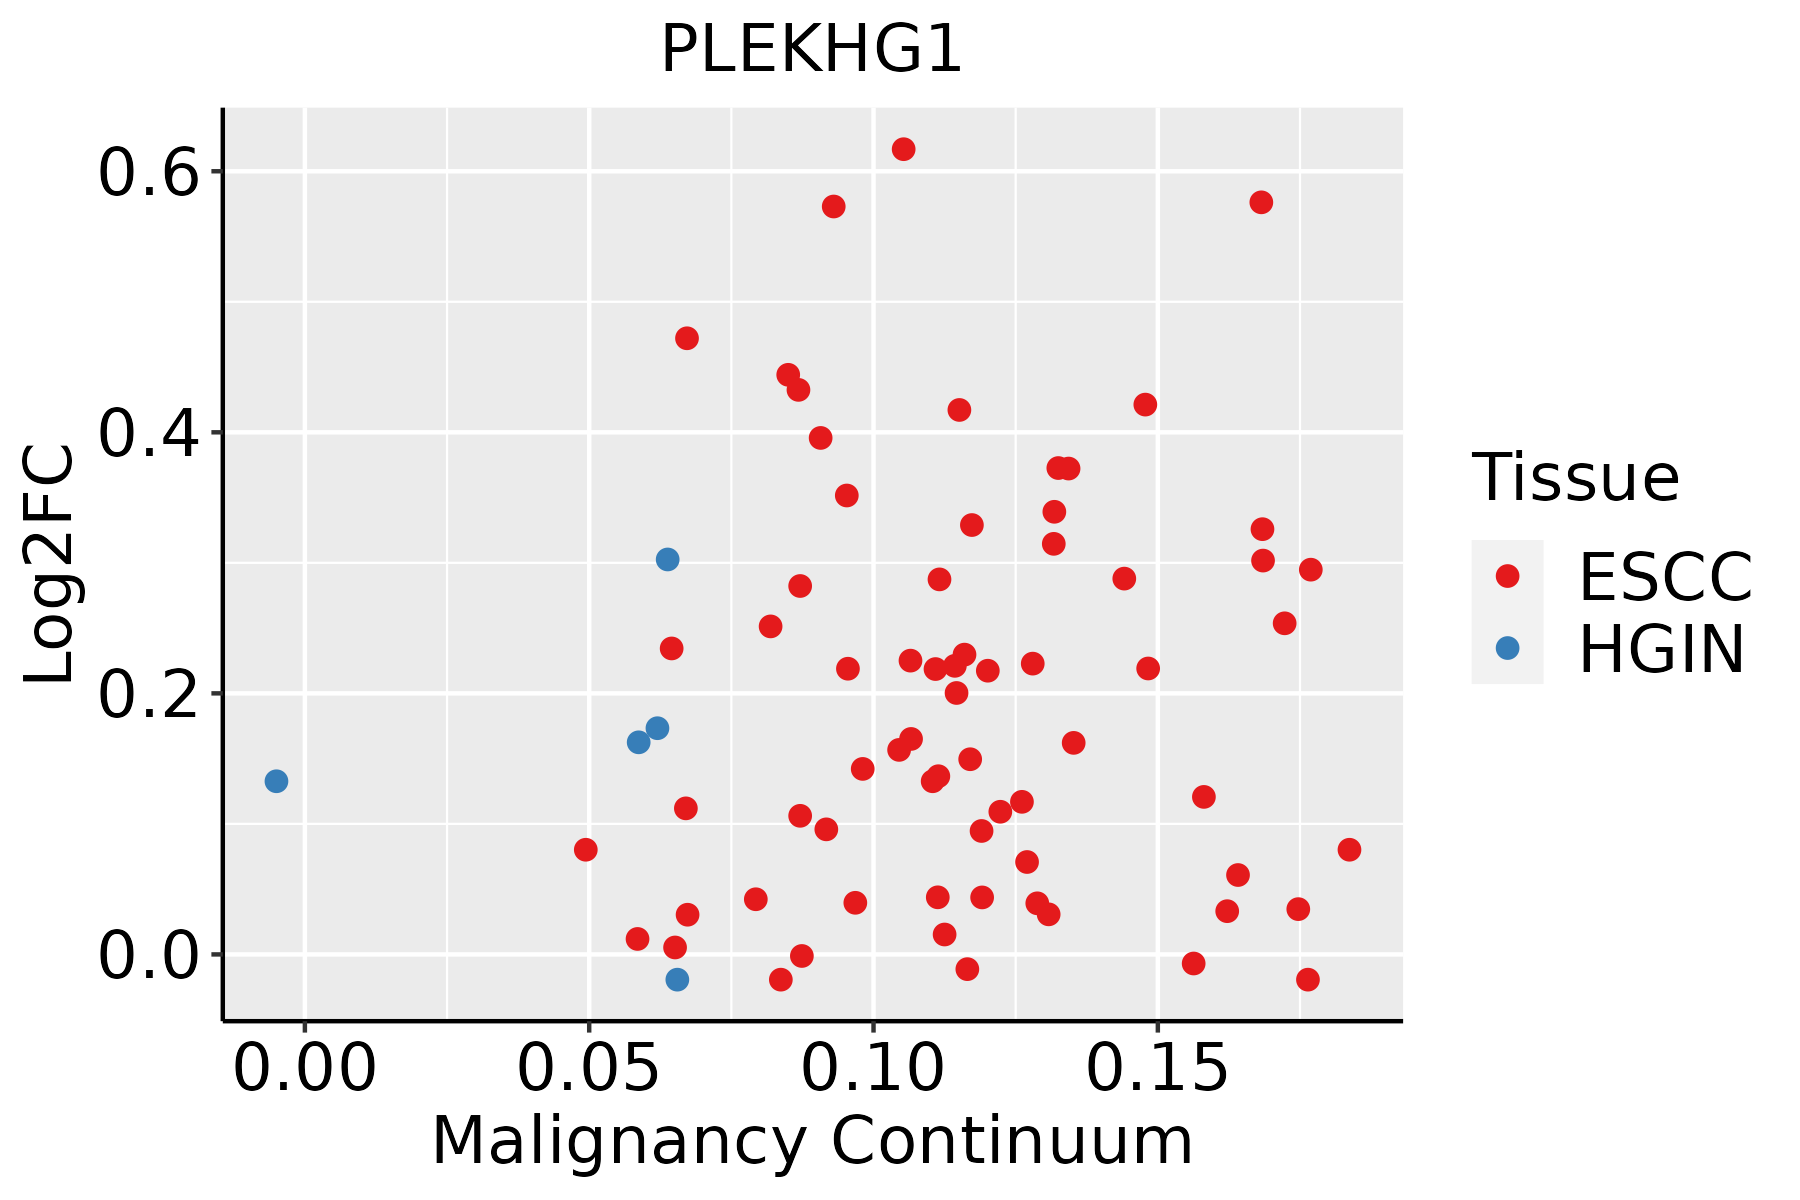 | ESCC: Esophageal squamous cell carcinoma |
| HGIN: High-grade intraepithelial neoplasias | ||
| LGIN: Low-grade intraepithelial neoplasias | ||
| Lung | 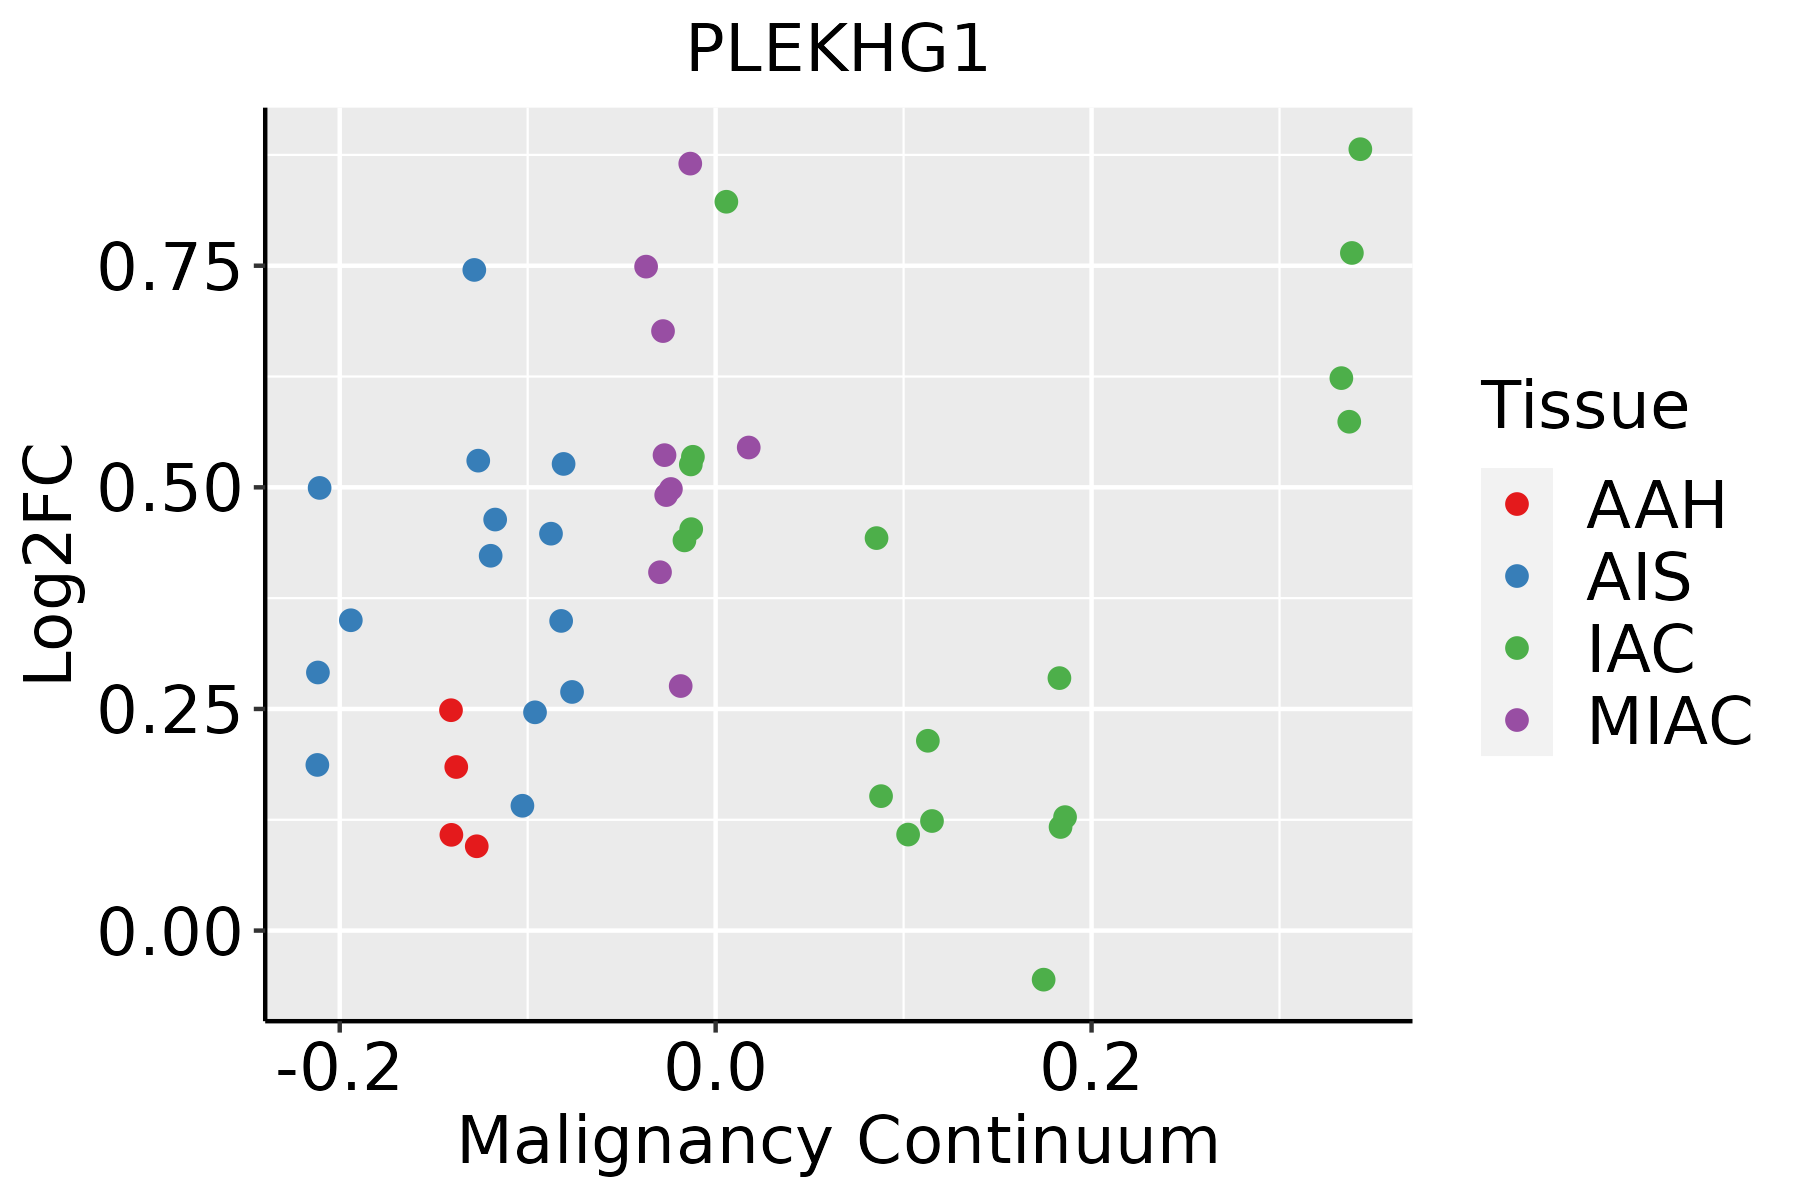 | AAH: Atypical adenomatous hyperplasia |
| AIS: Adenocarcinoma in situ | ||
| IAC: Invasive lung adenocarcinoma | ||
| MIA: Minimally invasive adenocarcinoma | ||
| Thyroid |  | ATC: Anaplastic thyroid cancer |
| HT: Hashimoto's thyroiditis | ||
| PTC: Papillary thyroid cancer |
| ∗log2FC in expression of this searched gene in stem-like cells from each diseased tissue sample relative to stem-like cells in normal samples in each tissue plotted against the malignancy continuum. Samples are colored based on if they are from different disease stage. |
Top |
Malignant transformation related pathway analysis |
| Find out the enriched GO biological processes and KEGG pathways involved in transition from healthy to precancer to cancer |
| Tissue | Disease Stage | Enriched GO biological Processes |
| Colorectum | AD |  |
| Colorectum | SER |  |
| Colorectum | MSS |  |
| Colorectum | MSI-H |  |
| Colorectum | FAP |  |
| ∗Top 15 enriched GO BP terms are showed in the bar plot of each disease state in each tissue. Each row represents a significant GO biological process which is colored according to the -log10(p.adjust). |
| Page: 1 2 3 4 5 6 7 8 9 |
| GO ID | Tissue | Disease Stage | Description | Gene Ratio | Bg Ratio | pvalue | p.adjust | Count |
| GO:00510566 | Cervix | CC | regulation of small GTPase mediated signal transduction | 75/2311 | 302/18723 | 1.54e-09 | 1.74e-07 | 75 |
| GO:0051056 | Colorectum | AD | regulation of small GTPase mediated signal transduction | 94/3918 | 302/18723 | 1.81e-05 | 3.76e-04 | 94 |
| GO:00510561 | Colorectum | MSS | regulation of small GTPase mediated signal transduction | 82/3467 | 302/18723 | 1.31e-04 | 1.99e-03 | 82 |
| GO:00510562 | Colorectum | FAP | regulation of small GTPase mediated signal transduction | 78/2622 | 302/18723 | 3.25e-08 | 2.85e-06 | 78 |
| GO:00510563 | Colorectum | CRC | regulation of small GTPase mediated signal transduction | 69/2078 | 302/18723 | 3.34e-09 | 9.08e-07 | 69 |
| GO:00510567 | Endometrium | AEH | regulation of small GTPase mediated signal transduction | 59/2100 | 302/18723 | 1.43e-05 | 3.03e-04 | 59 |
| GO:005105612 | Endometrium | EEC | regulation of small GTPase mediated signal transduction | 61/2168 | 302/18723 | 9.42e-06 | 2.08e-04 | 61 |
| GO:005105610 | Esophagus | ESCC | regulation of small GTPase mediated signal transduction | 157/8552 | 302/18723 | 1.55e-02 | 4.98e-02 | 157 |
| GO:00510565 | Lung | IAC | regulation of small GTPase mediated signal transduction | 70/2061 | 302/18723 | 9.44e-10 | 1.87e-07 | 70 |
| GO:005105611 | Lung | AIS | regulation of small GTPase mediated signal transduction | 66/1849 | 302/18723 | 4.26e-10 | 9.53e-08 | 66 |
| GO:005105617 | Thyroid | PTC | regulation of small GTPase mediated signal transduction | 132/5968 | 302/18723 | 9.26e-06 | 1.04e-04 | 132 |
| GO:005105618 | Thyroid | ATC | regulation of small GTPase mediated signal transduction | 141/6293 | 302/18723 | 1.43e-06 | 1.77e-05 | 141 |
| Page: 1 |
| Pathway ID | Tissue | Disease Stage | Description | Gene Ratio | Bg Ratio | pvalue | p.adjust | qvalue | Count |
| Page: 1 |
Top |
Cell-cell communication analysis |
| Identification of potential cell-cell interactions between two cell types and their ligand-receptor pairs for different disease states |
| Ligand | Receptor | LRpair | Pathway | Tissue | Disease Stage |
| Page: 1 |
Top |
Single-cell gene regulatory network inference analysis |
| Find out the significant the regulons (TFs) and the target genes of each regulon across cell types for different disease states |
| TF | Cell Type | Tissue | Disease Stage | Target Gene | RSS | Regulon Activity |
| ∗The dot plots of a searched regulon are shown for all cell subpopulations in each disease state of each tissue based on the regulon specific score inferred using pySCENIC and by calculating the average expression. |
| Page: 1 |
Top |
Somatic mutation of malignant transformation related genes |
| Annotation of somatic variants for genes involved in malignant transformation |
| Hugo Symbol | Variant Class | Variant Classification | dbSNP RS | HGVSc | HGVSp | HGVSp Short | SWISSPROT | BIOTYPE | SIFT | PolyPhen | Tumor Sample Barcode | Tissue | Histology | Sex | Age | Stage | Therapy Types | Drugs | Outcome |
| PLEKHG1 | SNV | Missense_Mutation | c.2934G>C | p.Met978Ile | p.M978I | Q9ULL1 | protein_coding | deleterious(0.02) | benign(0.001) | TCGA-AC-A23H-01 | Breast | breast invasive carcinoma | Female | >=65 | I/II | Unknown | Unknown | PD | |
| PLEKHG1 | SNV | Missense_Mutation | rs750832410 | c.1033G>A | p.Asp345Asn | p.D345N | Q9ULL1 | protein_coding | deleterious(0) | probably_damaging(0.997) | TCGA-AN-A046-01 | Breast | breast invasive carcinoma | Female | >=65 | I/II | Unknown | Unknown | SD |
| PLEKHG1 | SNV | Missense_Mutation | novel | c.3792G>T | p.Gln1264His | p.Q1264H | Q9ULL1 | protein_coding | deleterious(0.02) | probably_damaging(0.921) | TCGA-AN-A046-01 | Breast | breast invasive carcinoma | Female | >=65 | I/II | Unknown | Unknown | SD |
| PLEKHG1 | SNV | Missense_Mutation | rs372906441 | c.2207N>T | p.Ala736Val | p.A736V | Q9ULL1 | protein_coding | tolerated(0.48) | benign(0) | TCGA-AN-A0AK-01 | Breast | breast invasive carcinoma | Female | >=65 | I/II | Unknown | Unknown | SD |
| PLEKHG1 | SNV | Missense_Mutation | c.898G>C | p.Ala300Pro | p.A300P | Q9ULL1 | protein_coding | deleterious(0) | probably_damaging(1) | TCGA-AN-A0XN-01 | Breast | breast invasive carcinoma | Female | >=65 | III/IV | Unknown | Unknown | SD | |
| PLEKHG1 | SNV | Missense_Mutation | novel | c.2020G>T | p.Ala674Ser | p.A674S | Q9ULL1 | protein_coding | tolerated(0.08) | benign(0.162) | TCGA-AO-A0J9-01 | Breast | breast invasive carcinoma | Female | <65 | III/IV | Chemotherapy | cyclophosphamide | PD |
| PLEKHG1 | SNV | Missense_Mutation | rs768747492 | c.1646N>T | p.Pro549Leu | p.P549L | Q9ULL1 | protein_coding | tolerated(0.11) | benign(0.001) | TCGA-AR-A2LE-01 | Breast | breast invasive carcinoma | Female | >=65 | I/II | Hormone Therapy | tamoxiphen | PD |
| PLEKHG1 | SNV | Missense_Mutation | c.3241N>A | p.Gly1081Arg | p.G1081R | Q9ULL1 | protein_coding | deleterious(0) | benign(0) | TCGA-BH-A18G-01 | Breast | breast invasive carcinoma | Female | >=65 | I/II | Unknown | Unknown | SD | |
| PLEKHG1 | SNV | Missense_Mutation | c.2597N>T | p.Asp866Val | p.D866V | Q9ULL1 | protein_coding | deleterious(0) | benign(0.422) | TCGA-C8-A26Y-01 | Breast | breast invasive carcinoma | Female | >=65 | I/II | Unknown | Unknown | SD | |
| PLEKHG1 | SNV | Missense_Mutation | c.2401C>G | p.Gln801Glu | p.Q801E | Q9ULL1 | protein_coding | tolerated(0.11) | benign(0.037) | TCGA-E9-A226-01 | Breast | breast invasive carcinoma | Female | <65 | III/IV | Hormone Therapy | tamoxiphen | PD |
| Page: 1 2 3 4 5 6 7 8 9 10 11 12 13 14 15 16 17 |
Top |
Related drugs of malignant transformation related genes |
| Identification of chemicals and drugs interact with genes involved in malignant transfromation |
| (DGIdb 4.0) |
| Entrez ID | Symbol | Category | Interaction Types | Drug Claim Name | Drug Name | PMIDs |
| Page: 1 |

Copyright 2023-Present -The University of Texas Health Science Center at Houston |