
|
|||||
|
 | |
| |
| |
| |
| |
| |
|
Gene: PLEKHF2 |
Gene summary for PLEKHF2 |
| Gene information | Species | Human | Gene symbol | PLEKHF2 | Gene ID | 79666 |
| Gene name | pleckstrin homology and FYVE domain containing 2 | |
| Gene Alias | EAPF | |
| Cytomap | 8q22.1 | |
| Gene Type | protein-coding | GO ID | GO:0006810 | UniProtAcc | Q9H8W4 |
Top |
Malignant transformation analysis |
| Identification of the aberrant gene expression in precancerous and cancerous lesions by comparing the gene expression of stem-like cells in diseased tissues with normal stem cells |
| Entrez ID | Symbol | Replicates | Species | Organ | Tissue | Adj P-value | Log2FC | Malignancy |
| 79666 | PLEKHF2 | LZE2T | Human | Esophagus | ESCC | 1.15e-04 | 4.17e-01 | 0.082 |
| 79666 | PLEKHF2 | LZE4T | Human | Esophagus | ESCC | 3.50e-10 | 4.57e-01 | 0.0811 |
| 79666 | PLEKHF2 | LZE8T | Human | Esophagus | ESCC | 3.37e-03 | 9.20e-02 | 0.067 |
| 79666 | PLEKHF2 | LZE20T | Human | Esophagus | ESCC | 3.98e-17 | 5.91e-01 | 0.0662 |
| 79666 | PLEKHF2 | LZE22T | Human | Esophagus | ESCC | 1.06e-02 | 4.88e-01 | 0.068 |
| 79666 | PLEKHF2 | LZE24T | Human | Esophagus | ESCC | 2.64e-50 | 1.81e+00 | 0.0596 |
| 79666 | PLEKHF2 | LZE21T | Human | Esophagus | ESCC | 1.42e-05 | 4.31e-01 | 0.0655 |
| 79666 | PLEKHF2 | P1T-E | Human | Esophagus | ESCC | 2.18e-04 | 5.16e-01 | 0.0875 |
| 79666 | PLEKHF2 | P2T-E | Human | Esophagus | ESCC | 1.52e-28 | 4.75e-01 | 0.1177 |
| 79666 | PLEKHF2 | P4T-E | Human | Esophagus | ESCC | 5.68e-34 | 9.18e-01 | 0.1323 |
| 79666 | PLEKHF2 | P5T-E | Human | Esophagus | ESCC | 3.92e-24 | 5.17e-01 | 0.1327 |
| 79666 | PLEKHF2 | P8T-E | Human | Esophagus | ESCC | 9.03e-41 | 8.32e-01 | 0.0889 |
| 79666 | PLEKHF2 | P9T-E | Human | Esophagus | ESCC | 5.79e-30 | 7.90e-01 | 0.1131 |
| 79666 | PLEKHF2 | P10T-E | Human | Esophagus | ESCC | 1.72e-25 | 3.96e-01 | 0.116 |
| 79666 | PLEKHF2 | P11T-E | Human | Esophagus | ESCC | 8.13e-17 | 7.10e-01 | 0.1426 |
| 79666 | PLEKHF2 | P12T-E | Human | Esophagus | ESCC | 1.61e-52 | 1.22e+00 | 0.1122 |
| 79666 | PLEKHF2 | P15T-E | Human | Esophagus | ESCC | 1.97e-49 | 1.01e+00 | 0.1149 |
| 79666 | PLEKHF2 | P16T-E | Human | Esophagus | ESCC | 9.44e-34 | 6.08e-01 | 0.1153 |
| 79666 | PLEKHF2 | P17T-E | Human | Esophagus | ESCC | 1.55e-03 | 2.61e-01 | 0.1278 |
| 79666 | PLEKHF2 | P19T-E | Human | Esophagus | ESCC | 6.49e-05 | 3.66e-01 | 0.1662 |
| Page: 1 2 3 4 5 |
| Tissue | Expression Dynamics | Abbreviation |
| Esophagus | 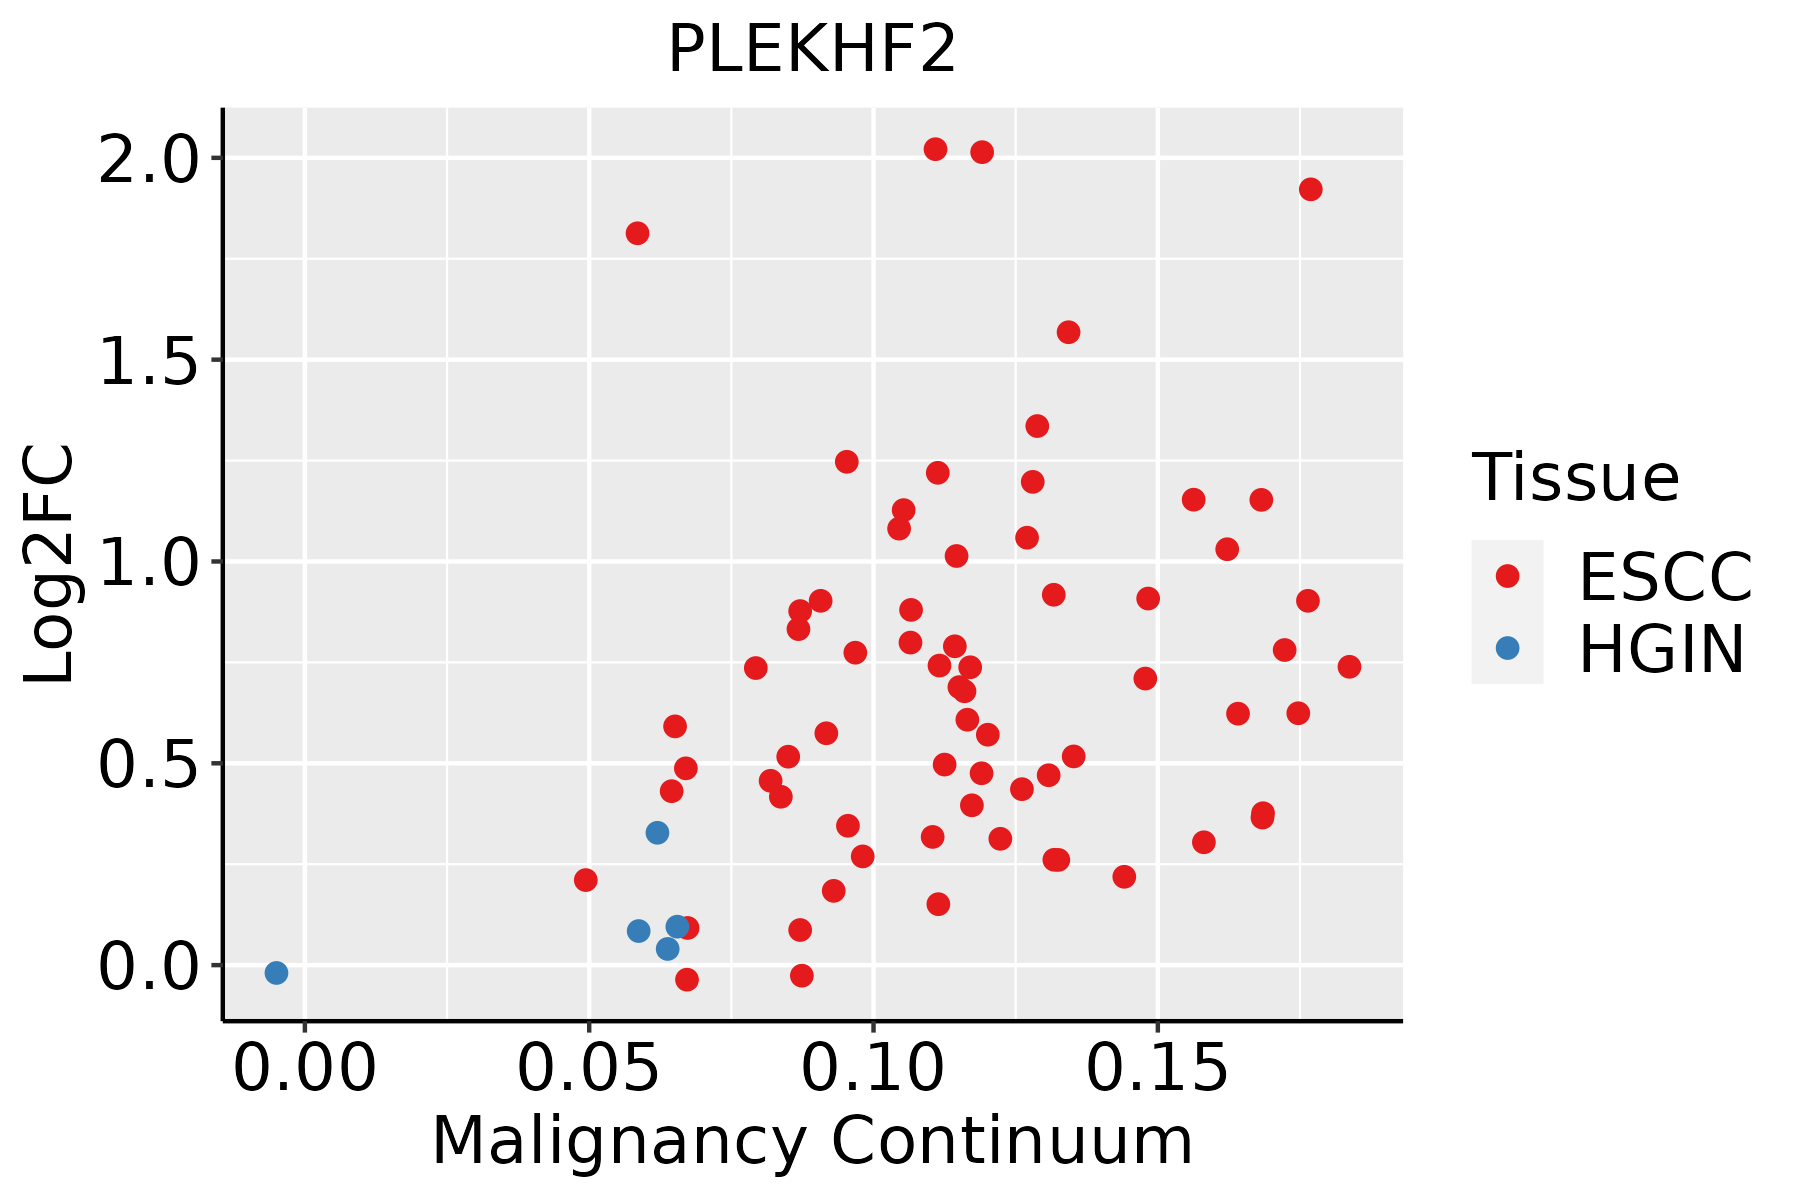 | ESCC: Esophageal squamous cell carcinoma |
| HGIN: High-grade intraepithelial neoplasias | ||
| LGIN: Low-grade intraepithelial neoplasias | ||
| Liver | 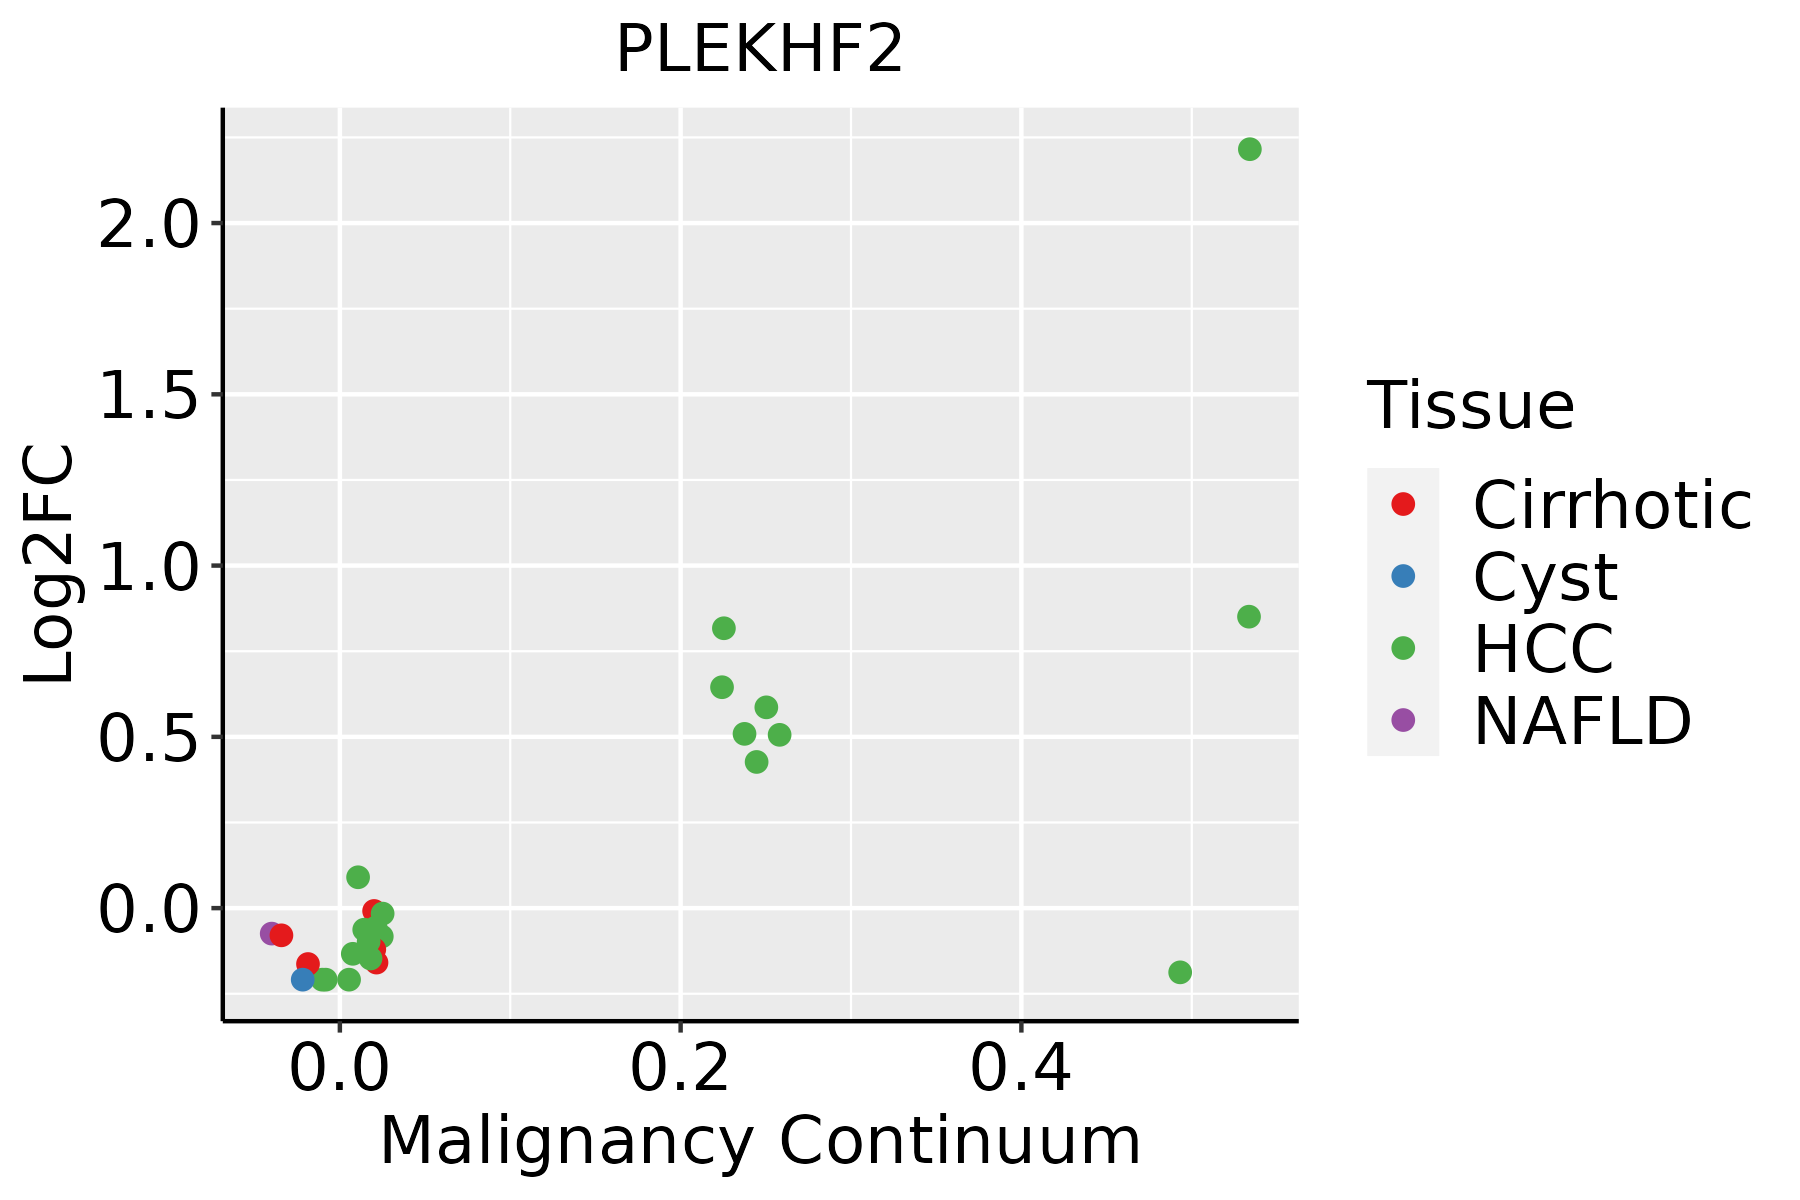 | HCC: Hepatocellular carcinoma |
| NAFLD: Non-alcoholic fatty liver disease | ||
| Oral Cavity |  | EOLP: Erosive Oral lichen planus |
| LP: leukoplakia | ||
| NEOLP: Non-erosive oral lichen planus | ||
| OSCC: Oral squamous cell carcinoma | ||
| Skin | 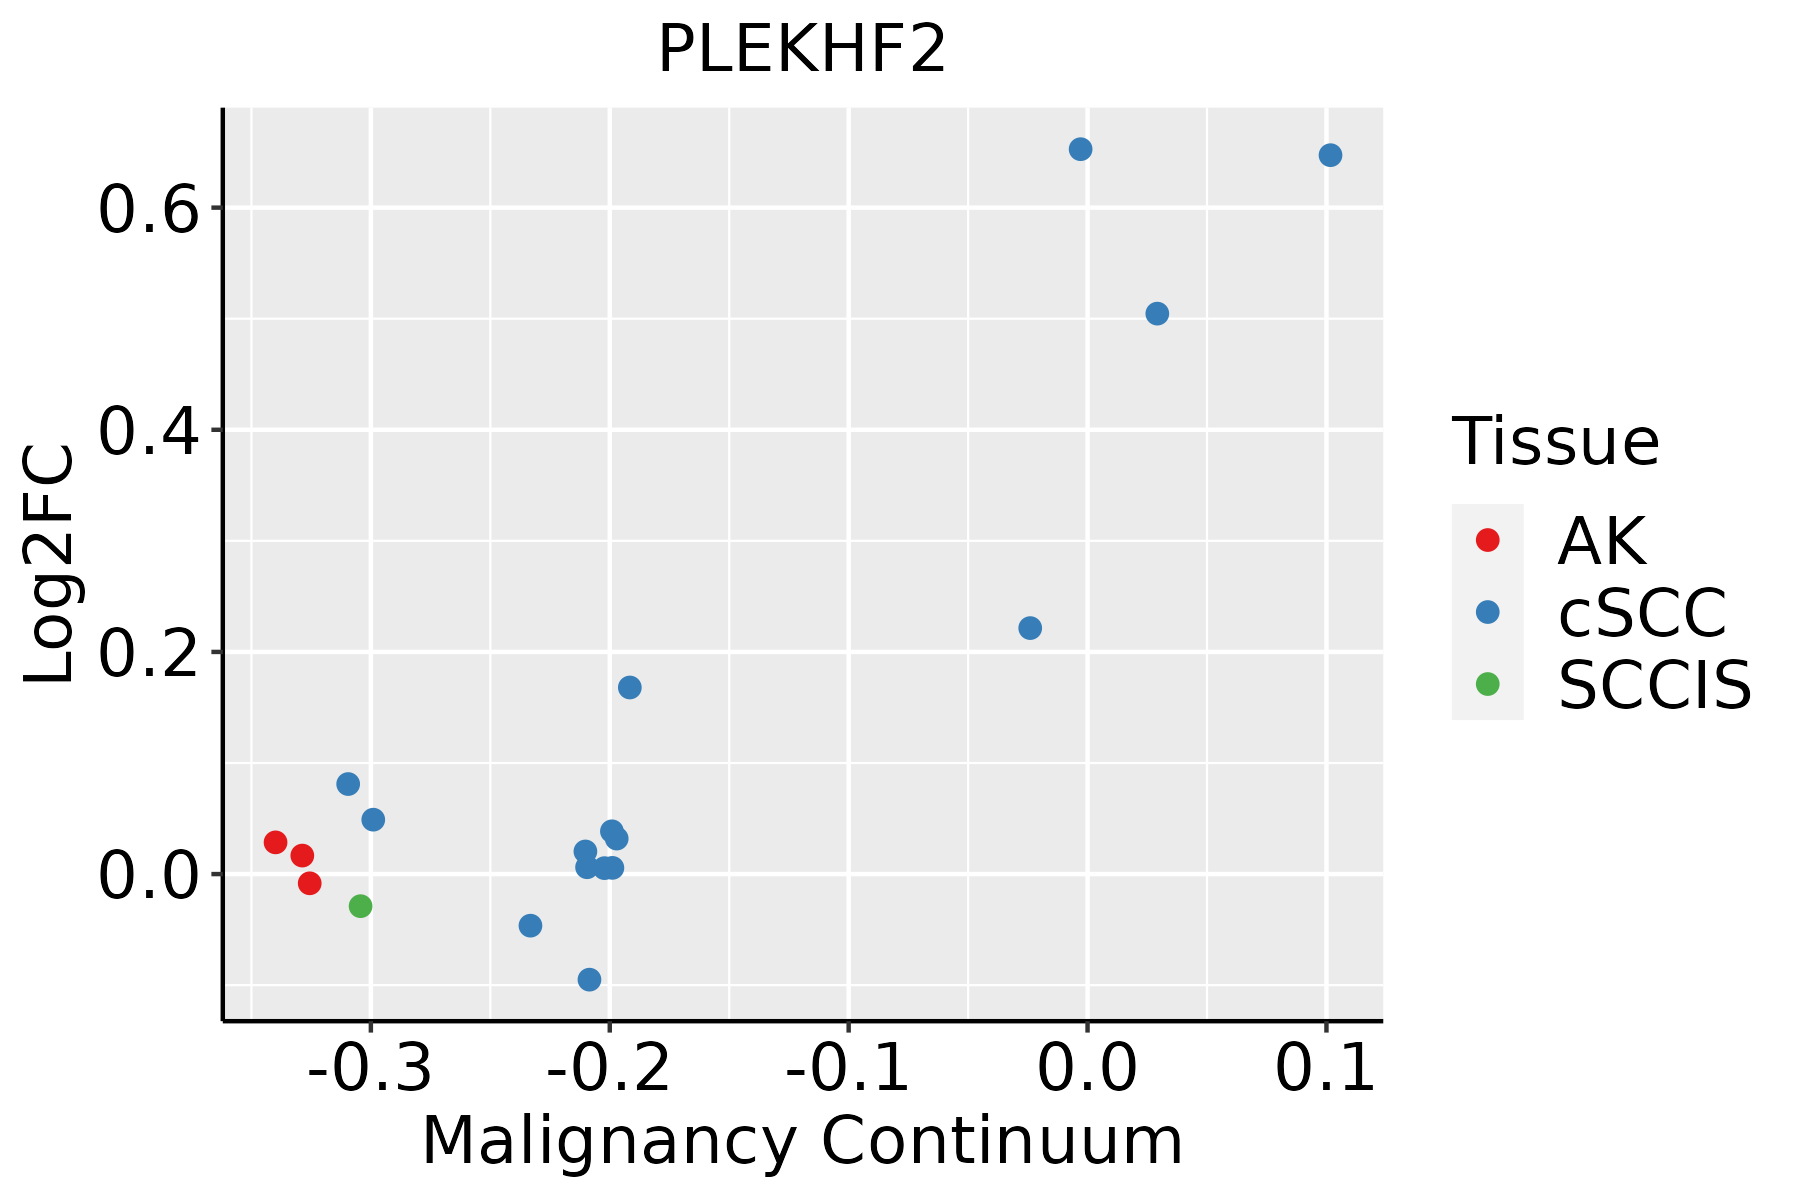 | AK: Actinic keratosis |
| cSCC: Cutaneous squamous cell carcinoma | ||
| SCCIS:squamous cell carcinoma in situ |
| ∗log2FC in expression of this searched gene in stem-like cells from each diseased tissue sample relative to stem-like cells in normal samples in each tissue plotted against the malignancy continuum. Samples are colored based on if they are from different disease stage. |
Top |
Malignant transformation related pathway analysis |
| Find out the enriched GO biological processes and KEGG pathways involved in transition from healthy to precancer to cancer |
| Tissue | Disease Stage | Enriched GO biological Processes |
| Colorectum | AD |  |
| Colorectum | SER |  |
| Colorectum | MSS |  |
| Colorectum | MSI-H |  |
| Colorectum | FAP |  |
| ∗Top 15 enriched GO BP terms are showed in the bar plot of each disease state in each tissue. Each row represents a significant GO biological process which is colored according to the -log10(p.adjust). |
| Page: 1 2 3 4 5 6 7 8 9 |
| GO ID | Tissue | Disease Stage | Description | Gene Ratio | Bg Ratio | pvalue | p.adjust | Count |
| Page: 1 |
| Pathway ID | Tissue | Disease Stage | Description | Gene Ratio | Bg Ratio | pvalue | p.adjust | qvalue | Count |
| Page: 1 |
Top |
Cell-cell communication analysis |
| Identification of potential cell-cell interactions between two cell types and their ligand-receptor pairs for different disease states |
| Ligand | Receptor | LRpair | Pathway | Tissue | Disease Stage |
| Page: 1 |
Top |
Single-cell gene regulatory network inference analysis |
| Find out the significant the regulons (TFs) and the target genes of each regulon across cell types for different disease states |
| TF | Cell Type | Tissue | Disease Stage | Target Gene | RSS | Regulon Activity |
| ∗The dot plots of a searched regulon are shown for all cell subpopulations in each disease state of each tissue based on the regulon specific score inferred using pySCENIC and by calculating the average expression. |
| Page: 1 |
Top |
Somatic mutation of malignant transformation related genes |
| Annotation of somatic variants for genes involved in malignant transformation |
| Hugo Symbol | Variant Class | Variant Classification | dbSNP RS | HGVSc | HGVSp | HGVSp Short | SWISSPROT | BIOTYPE | SIFT | PolyPhen | Tumor Sample Barcode | Tissue | Histology | Sex | Age | Stage | Therapy Types | Drugs | Outcome |
| PLEKHF2 | SNV | Missense_Mutation | novel | c.746N>G | p.Asp249Gly | p.D249G | Q9H8W4 | protein_coding | deleterious(0.03) | possibly_damaging(0.811) | TCGA-AN-A046-01 | Breast | breast invasive carcinoma | Female | >=65 | I/II | Unknown | Unknown | SD |
| PLEKHF2 | SNV | Missense_Mutation | c.359N>T | p.Ser120Leu | p.S120L | Q9H8W4 | protein_coding | tolerated(0.19) | benign(0.216) | TCGA-AO-A1KT-01 | Breast | breast invasive carcinoma | Female | >=65 | I/II | Chemotherapy | fluorouracil | SD | |
| PLEKHF2 | SNV | Missense_Mutation | c.270N>G | p.Ile90Met | p.I90M | Q9H8W4 | protein_coding | deleterious(0) | benign(0.215) | TCGA-E2-A1IN-01 | Breast | breast invasive carcinoma | Female | <65 | I/II | Hormone Therapy | arimidex | SD | |
| PLEKHF2 | SNV | Missense_Mutation | c.169N>G | p.Leu57Val | p.L57V | Q9H8W4 | protein_coding | deleterious(0) | probably_damaging(1) | TCGA-AA-3977-01 | Colorectum | colon adenocarcinoma | Male | >=65 | I/II | Unknown | Unknown | SD | |
| PLEKHF2 | SNV | Missense_Mutation | c.285N>G | p.Asp95Glu | p.D95E | Q9H8W4 | protein_coding | tolerated(1) | benign(0.003) | TCGA-CK-4951-01 | Colorectum | colon adenocarcinoma | Female | >=65 | I/II | Unknown | Unknown | PD | |
| PLEKHF2 | SNV | Missense_Mutation | novel | c.527G>A | p.Arg176His | p.R176H | Q9H8W4 | protein_coding | deleterious(0) | probably_damaging(1) | TCGA-EI-6917-01 | Colorectum | rectum adenocarcinoma | Male | <65 | III/IV | Chemotherapy | 5fluorouracil+oxaciplatina+l-folinian | SD |
| PLEKHF2 | SNV | Missense_Mutation | novel | c.178N>T | p.Asp60Tyr | p.D60Y | Q9H8W4 | protein_coding | deleterious(0) | probably_damaging(1) | TCGA-F5-6814-01 | Colorectum | rectum adenocarcinoma | Male | <65 | I/II | Unknown | Unknown | SD |
| PLEKHF2 | SNV | Missense_Mutation | rs550495503 | c.479G>A | p.Arg160His | p.R160H | Q9H8W4 | protein_coding | tolerated(0.62) | benign(0.054) | TCGA-A5-A0G2-01 | Endometrium | uterine corpus endometrioid carcinoma | Female | <65 | III/IV | Unknown | Unknown | SD |
| PLEKHF2 | SNV | Missense_Mutation | rs550495503 | c.479G>A | p.Arg160His | p.R160H | Q9H8W4 | protein_coding | tolerated(0.62) | benign(0.054) | TCGA-AP-A1DV-01 | Endometrium | uterine corpus endometrioid carcinoma | Female | <65 | I/II | Unknown | Unknown | SD |
| PLEKHF2 | SNV | Missense_Mutation | c.733N>T | p.Asp245Tyr | p.D245Y | Q9H8W4 | protein_coding | deleterious(0.01) | benign(0.284) | TCGA-B5-A11N-01 | Endometrium | uterine corpus endometrioid carcinoma | Female | >=65 | I/II | Unknown | Unknown | SD |
| Page: 1 2 3 |
Top |
Related drugs of malignant transformation related genes |
| Identification of chemicals and drugs interact with genes involved in malignant transfromation |
| (DGIdb 4.0) |
| Entrez ID | Symbol | Category | Interaction Types | Drug Claim Name | Drug Name | PMIDs |
| Page: 1 |

Copyright 2023-Present -The University of Texas Health Science Center at Houston |