
|
|||||
|
 | |
| |
| |
| |
| |
| |
|
Gene: PLEKHF1 |
Gene summary for PLEKHF1 |
| Gene information | Species | Human | Gene symbol | PLEKHF1 | Gene ID | 79156 |
| Gene name | pleckstrin homology and FYVE domain containing 1 | |
| Gene Alias | APPD | |
| Cytomap | 19q12 | |
| Gene Type | protein-coding | GO ID | GO:0006914 | UniProtAcc | Q96S99 |
Top |
Malignant transformation analysis |
| Identification of the aberrant gene expression in precancerous and cancerous lesions by comparing the gene expression of stem-like cells in diseased tissues with normal stem cells |
| Entrez ID | Symbol | Replicates | Species | Organ | Tissue | Adj P-value | Log2FC | Malignancy |
| 79156 | PLEKHF1 | LZE22T | Human | Esophagus | ESCC | 3.09e-02 | 3.31e-01 | 0.068 |
| 79156 | PLEKHF1 | P1T-E | Human | Esophagus | ESCC | 1.06e-07 | 4.15e-01 | 0.0875 |
| 79156 | PLEKHF1 | P2T-E | Human | Esophagus | ESCC | 8.57e-10 | 2.40e-01 | 0.1177 |
| 79156 | PLEKHF1 | P4T-E | Human | Esophagus | ESCC | 8.92e-06 | 1.11e-01 | 0.1323 |
| 79156 | PLEKHF1 | P5T-E | Human | Esophagus | ESCC | 3.24e-18 | 4.22e-01 | 0.1327 |
| 79156 | PLEKHF1 | P8T-E | Human | Esophagus | ESCC | 8.18e-17 | 4.36e-01 | 0.0889 |
| 79156 | PLEKHF1 | P9T-E | Human | Esophagus | ESCC | 3.07e-07 | 1.44e-01 | 0.1131 |
| 79156 | PLEKHF1 | P11T-E | Human | Esophagus | ESCC | 2.25e-16 | 9.94e-01 | 0.1426 |
| 79156 | PLEKHF1 | P15T-E | Human | Esophagus | ESCC | 8.45e-20 | 5.25e-01 | 0.1149 |
| 79156 | PLEKHF1 | P16T-E | Human | Esophagus | ESCC | 1.76e-06 | 1.02e-01 | 0.1153 |
| 79156 | PLEKHF1 | P17T-E | Human | Esophagus | ESCC | 1.35e-03 | 3.12e-01 | 0.1278 |
| 79156 | PLEKHF1 | P20T-E | Human | Esophagus | ESCC | 1.69e-11 | 3.20e-01 | 0.1124 |
| 79156 | PLEKHF1 | P21T-E | Human | Esophagus | ESCC | 6.54e-06 | 1.41e-01 | 0.1617 |
| 79156 | PLEKHF1 | P22T-E | Human | Esophagus | ESCC | 1.81e-17 | 1.82e-01 | 0.1236 |
| 79156 | PLEKHF1 | P23T-E | Human | Esophagus | ESCC | 4.04e-08 | 1.24e-01 | 0.108 |
| 79156 | PLEKHF1 | P24T-E | Human | Esophagus | ESCC | 2.51e-12 | 2.88e-01 | 0.1287 |
| 79156 | PLEKHF1 | P26T-E | Human | Esophagus | ESCC | 5.30e-08 | 3.69e-02 | 0.1276 |
| 79156 | PLEKHF1 | P27T-E | Human | Esophagus | ESCC | 2.03e-05 | 5.65e-02 | 0.1055 |
| 79156 | PLEKHF1 | P31T-E | Human | Esophagus | ESCC | 2.39e-10 | 2.18e-01 | 0.1251 |
| 79156 | PLEKHF1 | P32T-E | Human | Esophagus | ESCC | 7.50e-06 | 2.08e-01 | 0.1666 |
| Page: 1 2 3 |
| Tissue | Expression Dynamics | Abbreviation |
| Esophagus | 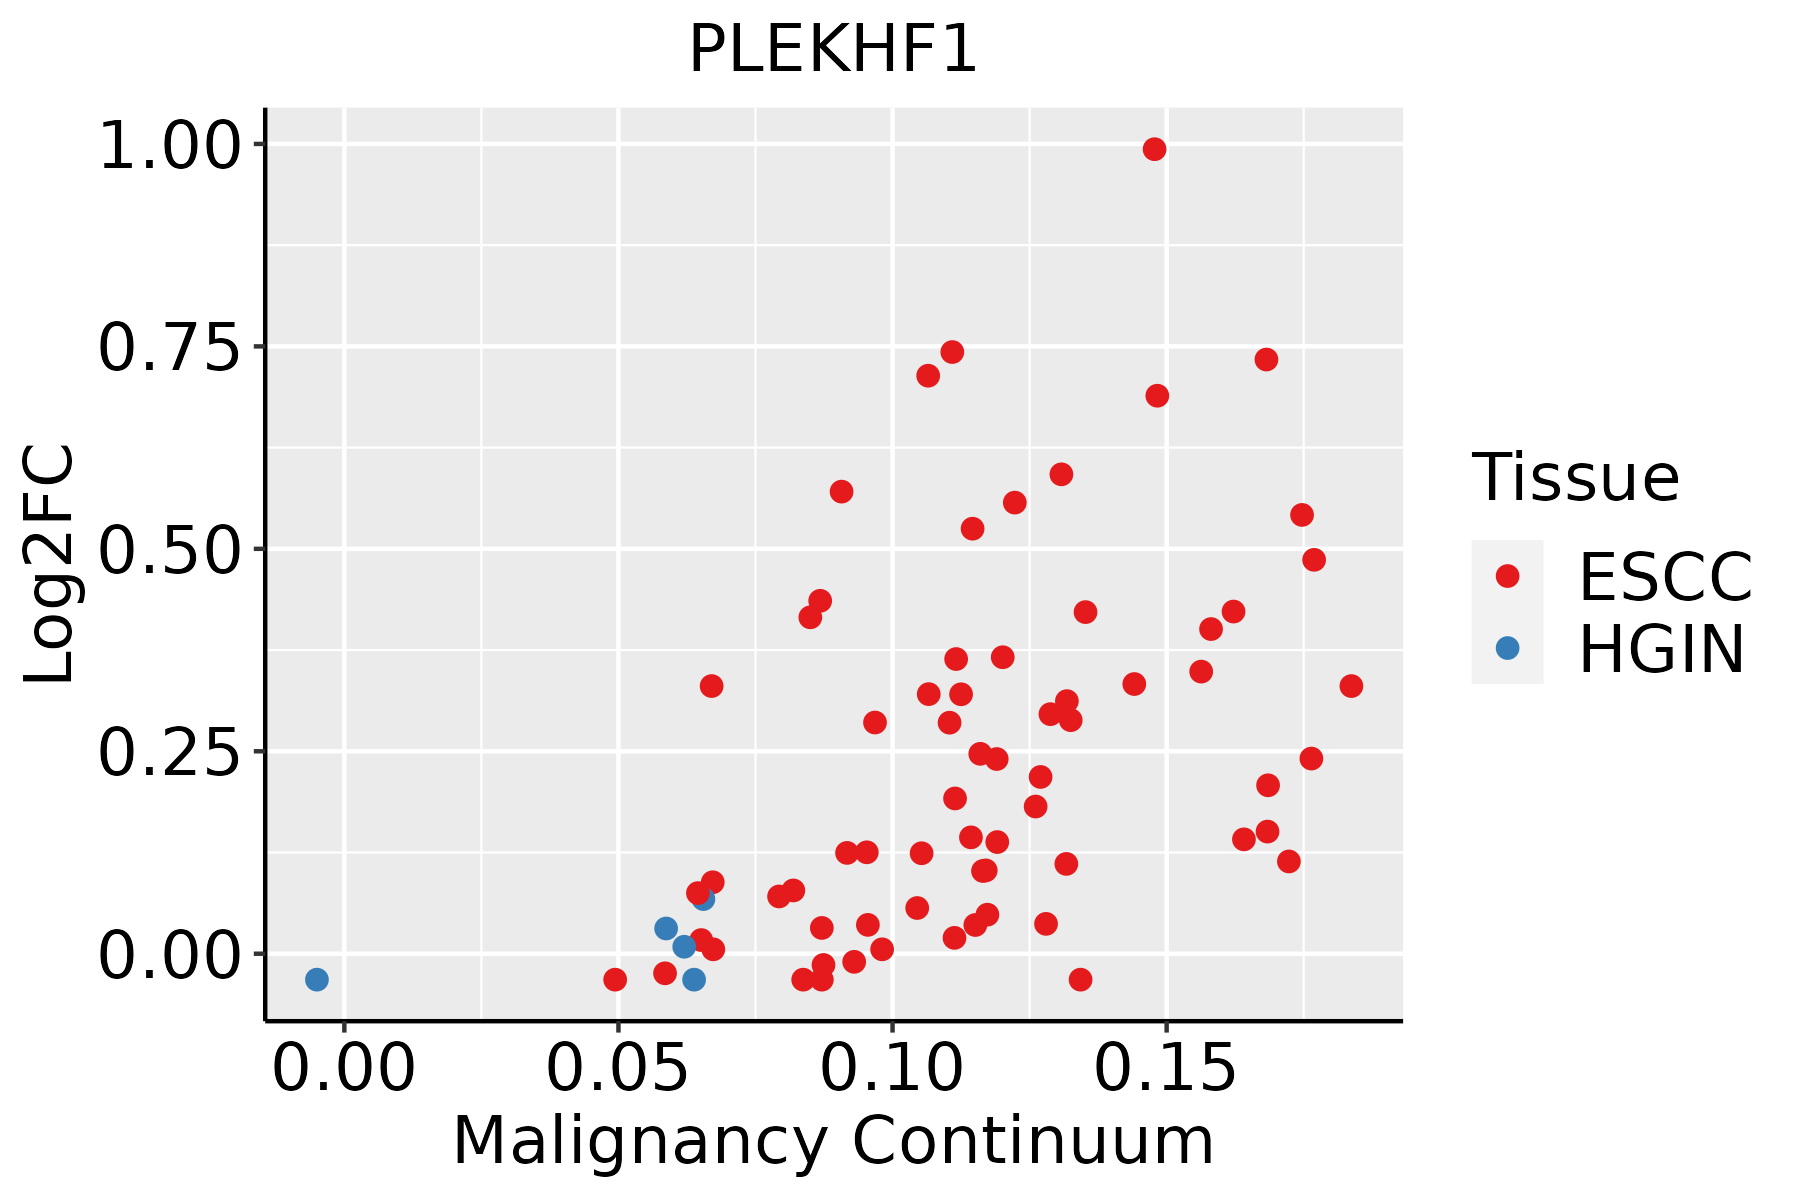 | ESCC: Esophageal squamous cell carcinoma |
| HGIN: High-grade intraepithelial neoplasias | ||
| LGIN: Low-grade intraepithelial neoplasias | ||
| Liver | 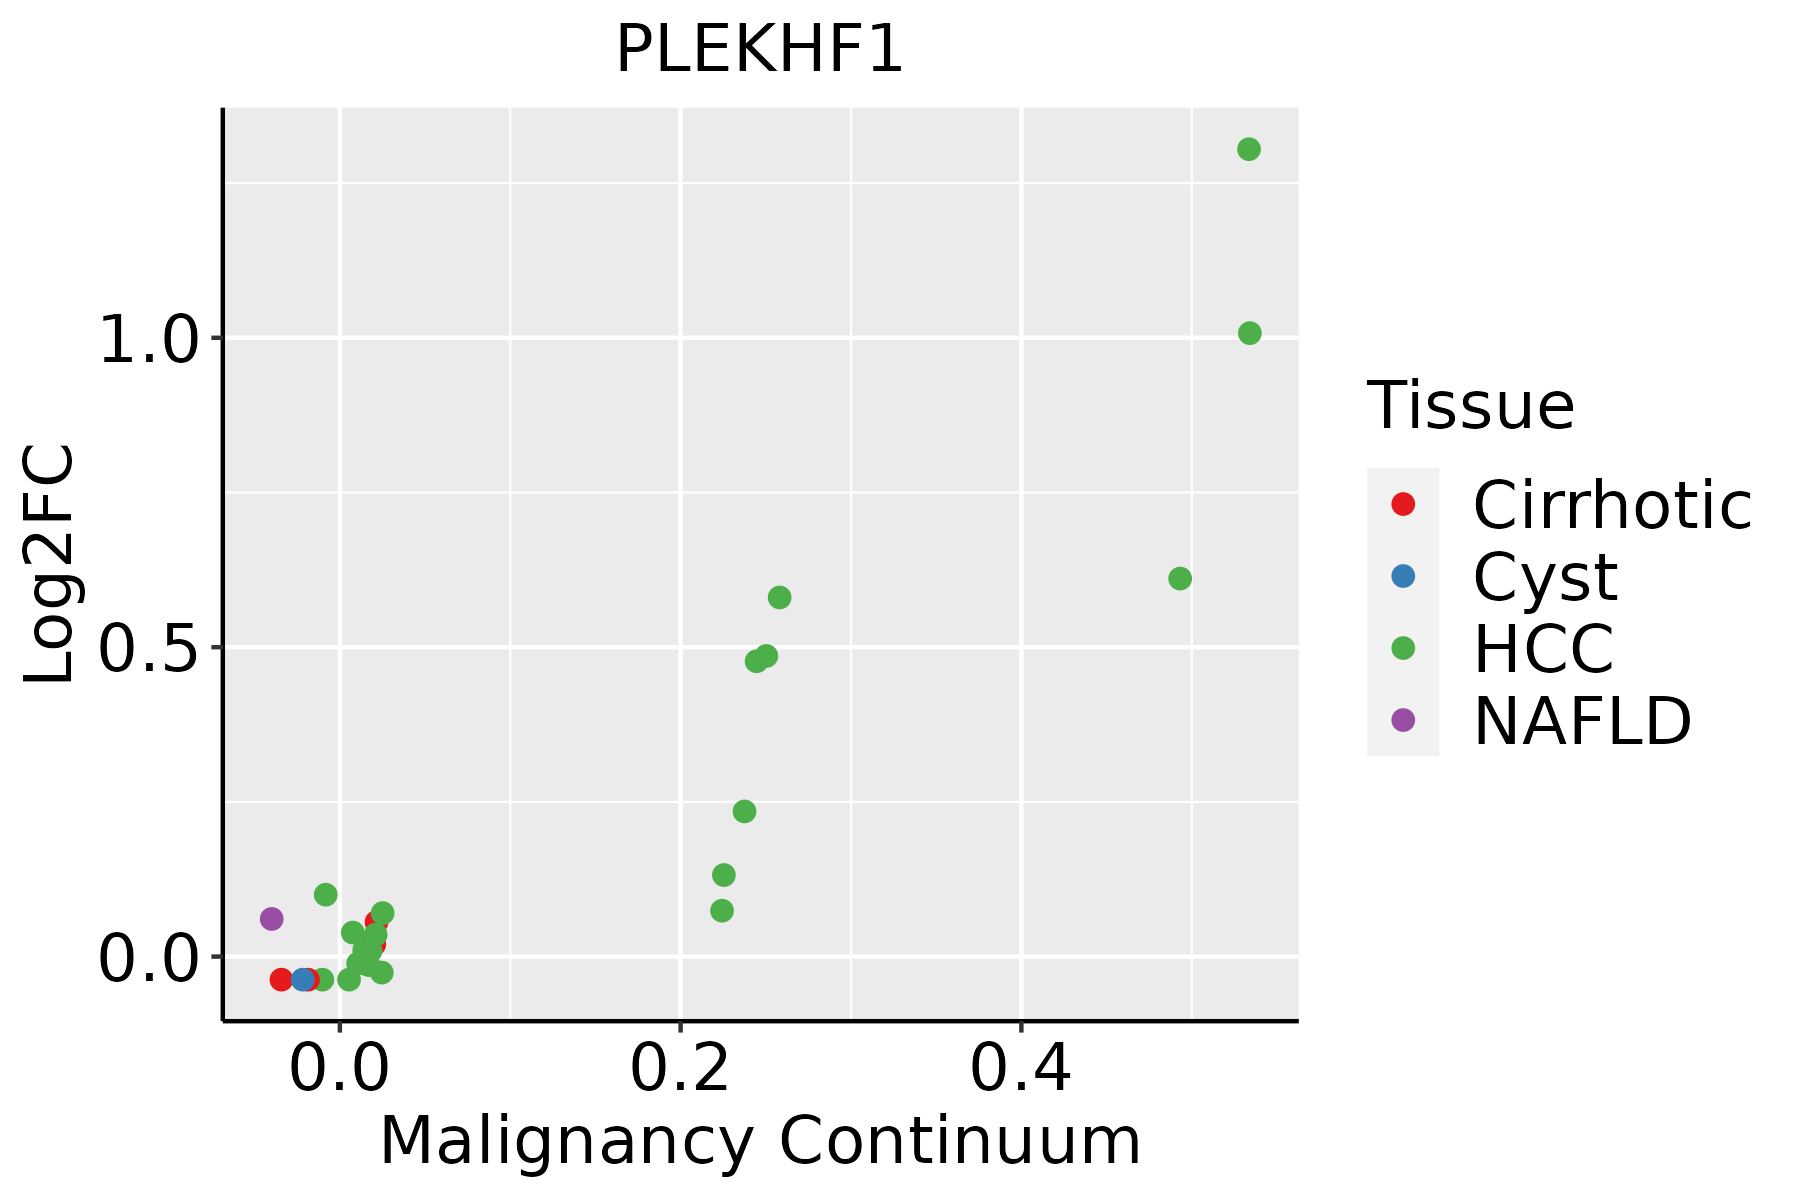 | HCC: Hepatocellular carcinoma |
| NAFLD: Non-alcoholic fatty liver disease | ||
| Oral Cavity |  | EOLP: Erosive Oral lichen planus |
| LP: leukoplakia | ||
| NEOLP: Non-erosive oral lichen planus | ||
| OSCC: Oral squamous cell carcinoma |
| ∗log2FC in expression of this searched gene in stem-like cells from each diseased tissue sample relative to stem-like cells in normal samples in each tissue plotted against the malignancy continuum. Samples are colored based on if they are from different disease stage. |
Top |
Malignant transformation related pathway analysis |
| Find out the enriched GO biological processes and KEGG pathways involved in transition from healthy to precancer to cancer |
| Tissue | Disease Stage | Enriched GO biological Processes |
| Colorectum | AD |  |
| Colorectum | SER |  |
| Colorectum | MSS |  |
| Colorectum | MSI-H |  |
| Colorectum | FAP |  |
| ∗Top 15 enriched GO BP terms are showed in the bar plot of each disease state in each tissue. Each row represents a significant GO biological process which is colored according to the -log10(p.adjust). |
| Page: 1 2 3 4 5 6 7 8 9 |
| GO ID | Tissue | Disease Stage | Description | Gene Ratio | Bg Ratio | pvalue | p.adjust | Count |
| GO:0097193111 | Esophagus | ESCC | intrinsic apoptotic signaling pathway | 222/8552 | 288/18723 | 5.87e-28 | 2.02e-25 | 222 |
| GO:2001233111 | Esophagus | ESCC | regulation of apoptotic signaling pathway | 256/8552 | 356/18723 | 4.11e-24 | 1.04e-21 | 256 |
| GO:0009896111 | Esophagus | ESCC | positive regulation of catabolic process | 332/8552 | 492/18723 | 4.36e-23 | 9.22e-21 | 332 |
| GO:0031331111 | Esophagus | ESCC | positive regulation of cellular catabolic process | 292/8552 | 427/18723 | 8.67e-22 | 1.53e-19 | 292 |
| GO:001605014 | Esophagus | ESCC | vesicle organization | 211/8552 | 300/18723 | 2.85e-18 | 2.87e-16 | 211 |
| GO:001050617 | Esophagus | ESCC | regulation of autophagy | 220/8552 | 317/18723 | 6.72e-18 | 6.36e-16 | 220 |
| GO:2001242111 | Esophagus | ESCC | regulation of intrinsic apoptotic signaling pathway | 128/8552 | 164/18723 | 1.75e-17 | 1.50e-15 | 128 |
| GO:0072659110 | Esophagus | ESCC | protein localization to plasma membrane | 193/8552 | 284/18723 | 1.95e-14 | 1.03e-12 | 193 |
| GO:199077819 | Esophagus | ESCC | protein localization to cell periphery | 217/8552 | 333/18723 | 4.08e-13 | 1.88e-11 | 217 |
| GO:2001235110 | Esophagus | ESCC | positive regulation of apoptotic signaling pathway | 92/8552 | 126/18723 | 3.91e-10 | 1.05e-08 | 92 |
| GO:000703214 | Esophagus | ESCC | endosome organization | 61/8552 | 82/18723 | 1.13e-07 | 1.85e-06 | 61 |
| GO:001050816 | Esophagus | ESCC | positive regulation of autophagy | 81/8552 | 124/18723 | 7.74e-06 | 7.65e-05 | 81 |
| GO:200124417 | Esophagus | ESCC | positive regulation of intrinsic apoptotic signaling pathway | 43/8552 | 58/18723 | 9.86e-06 | 9.37e-05 | 43 |
| GO:000989622 | Liver | HCC | positive regulation of catabolic process | 335/7958 | 492/18723 | 3.83e-31 | 1.87e-28 | 335 |
| GO:003133122 | Liver | HCC | positive regulation of cellular catabolic process | 295/7958 | 427/18723 | 3.20e-29 | 1.45e-26 | 295 |
| GO:001050621 | Liver | HCC | regulation of autophagy | 210/7958 | 317/18723 | 7.59e-18 | 8.45e-16 | 210 |
| GO:200123322 | Liver | HCC | regulation of apoptotic signaling pathway | 226/7958 | 356/18723 | 7.26e-16 | 5.68e-14 | 226 |
| GO:001605021 | Liver | HCC | vesicle organization | 194/7958 | 300/18723 | 5.58e-15 | 3.97e-13 | 194 |
| GO:009719322 | Liver | HCC | intrinsic apoptotic signaling pathway | 184/7958 | 288/18723 | 1.50e-13 | 8.32e-12 | 184 |
| GO:007265921 | Liver | HCC | protein localization to plasma membrane | 177/7958 | 284/18723 | 1.02e-11 | 4.18e-10 | 177 |
| Page: 1 2 |
| Pathway ID | Tissue | Disease Stage | Description | Gene Ratio | Bg Ratio | pvalue | p.adjust | qvalue | Count |
| Page: 1 |
Top |
Cell-cell communication analysis |
| Identification of potential cell-cell interactions between two cell types and their ligand-receptor pairs for different disease states |
| Ligand | Receptor | LRpair | Pathway | Tissue | Disease Stage |
| Page: 1 |
Top |
Single-cell gene regulatory network inference analysis |
| Find out the significant the regulons (TFs) and the target genes of each regulon across cell types for different disease states |
| TF | Cell Type | Tissue | Disease Stage | Target Gene | RSS | Regulon Activity |
| ∗The dot plots of a searched regulon are shown for all cell subpopulations in each disease state of each tissue based on the regulon specific score inferred using pySCENIC and by calculating the average expression. |
| Page: 1 |
Top |
Somatic mutation of malignant transformation related genes |
| Annotation of somatic variants for genes involved in malignant transformation |
| Hugo Symbol | Variant Class | Variant Classification | dbSNP RS | HGVSc | HGVSp | HGVSp Short | SWISSPROT | BIOTYPE | SIFT | PolyPhen | Tumor Sample Barcode | Tissue | Histology | Sex | Age | Stage | Therapy Types | Drugs | Outcome |
| PLEKHF1 | SNV | Missense_Mutation | rs780377669 | c.355N>T | p.Arg119Cys | p.R119C | Q96S99 | protein_coding | deleterious(0) | probably_damaging(0.985) | TCGA-AC-A62X-01 | Breast | breast invasive carcinoma | Female | >=65 | I/II | Unknown | Unknown | SD |
| PLEKHF1 | deletion | Frame_Shift_Del | novel | c.6delN | p.Asp3ThrfsTer40 | p.D3Tfs*40 | Q96S99 | protein_coding | TCGA-D8-A27V-01 | Breast | breast invasive carcinoma | Female | <65 | I/II | Hormone Therapy | tamoxiphen | SD | ||
| PLEKHF1 | SNV | Missense_Mutation | rs867833514 | c.296N>A | p.Arg99His | p.R99H | Q96S99 | protein_coding | deleterious(0.04) | probably_damaging(0.953) | TCGA-2W-A8YY-01 | Cervix | cervical & endocervical cancer | Female | <65 | I/II | Chemotherapy | cisplatin | CR |
| PLEKHF1 | SNV | Missense_Mutation | novel | c.239N>C | p.Ile80Thr | p.I80T | Q96S99 | protein_coding | deleterious(0) | probably_damaging(0.988) | TCGA-MA-AA3X-01 | Cervix | cervical & endocervical cancer | Female | <65 | III/IV | Chemotherapy | cisplatin | CR |
| PLEKHF1 | SNV | Missense_Mutation | c.583N>T | p.Arg195Cys | p.R195C | Q96S99 | protein_coding | tolerated(0.11) | benign(0.111) | TCGA-5M-AAT5-01 | Colorectum | colon adenocarcinoma | Unknown | Unknown | I/II | Unknown | Unknown | Unknown | |
| PLEKHF1 | SNV | Missense_Mutation | c.370N>T | p.Ser124Cys | p.S124C | Q96S99 | protein_coding | tolerated(0.06) | benign(0.033) | TCGA-AZ-6601-01 | Colorectum | colon adenocarcinoma | Male | >=65 | I/II | Unknown | Unknown | PD | |
| PLEKHF1 | deletion | Frame_Shift_Del | c.240delN | p.Leu82TrpfsTer20 | p.L82Wfs*20 | Q96S99 | protein_coding | TCGA-D5-6540-01 | Colorectum | colon adenocarcinoma | Male | >=65 | I/II | Unknown | Unknown | SD | |||
| PLEKHF1 | SNV | Missense_Mutation | rs531732264 | c.751G>A | p.Glu251Lys | p.E251K | Q96S99 | protein_coding | tolerated(0.1) | benign(0.225) | TCGA-AP-A0LM-01 | Endometrium | uterine corpus endometrioid carcinoma | Female | <65 | III/IV | Chemotherapy | cisplatin | SD |
| PLEKHF1 | SNV | Missense_Mutation | rs867833514 | c.296N>A | p.Arg99His | p.R99H | Q96S99 | protein_coding | deleterious(0.04) | probably_damaging(0.953) | TCGA-AX-A2HD-01 | Endometrium | uterine corpus endometrioid carcinoma | Female | >=65 | III/IV | Unknown | Unknown | SD |
| PLEKHF1 | SNV | Missense_Mutation | novel | c.466G>A | p.Asp156Asn | p.D156N | Q96S99 | protein_coding | tolerated(0.52) | benign(0.115) | TCGA-B5-A3FC-01 | Endometrium | uterine corpus endometrioid carcinoma | Female | <65 | I/II | Unknown | Unknown | SD |
| Page: 1 2 3 |
Top |
Related drugs of malignant transformation related genes |
| Identification of chemicals and drugs interact with genes involved in malignant transfromation |
| (DGIdb 4.0) |
| Entrez ID | Symbol | Category | Interaction Types | Drug Claim Name | Drug Name | PMIDs |
| Page: 1 |

Copyright 2023-Present -The University of Texas Health Science Center at Houston |