
|
|||||
|
 | |
| |
| |
| |
| |
| |
|
Gene: PLEKHB2 |
Gene summary for PLEKHB2 |
| Gene information | Species | Human | Gene symbol | PLEKHB2 | Gene ID | 55041 |
| Gene name | pleckstrin homology domain containing B2 | |
| Gene Alias | EVT2 | |
| Cytomap | 2q21.1 | |
| Gene Type | protein-coding | GO ID | GO:0008150 | UniProtAcc | A0A024QZ35 |
Top |
Malignant transformation analysis |
| Identification of the aberrant gene expression in precancerous and cancerous lesions by comparing the gene expression of stem-like cells in diseased tissues with normal stem cells |
| Entrez ID | Symbol | Replicates | Species | Organ | Tissue | Adj P-value | Log2FC | Malignancy |
| 55041 | PLEKHB2 | HTA11_2487_2000001011 | Human | Colorectum | SER | 9.01e-03 | 3.74e-01 | -0.1808 |
| 55041 | PLEKHB2 | HTA11_347_2000001011 | Human | Colorectum | AD | 2.48e-17 | 6.71e-01 | -0.1954 |
| 55041 | PLEKHB2 | HTA11_411_2000001011 | Human | Colorectum | SER | 5.61e-04 | 9.20e-01 | -0.2602 |
| 55041 | PLEKHB2 | HTA11_1391_2000001011 | Human | Colorectum | AD | 4.13e-03 | 3.34e-01 | -0.059 |
| 55041 | PLEKHB2 | HTA11_2992_2000001011 | Human | Colorectum | SER | 4.60e-03 | 6.92e-01 | -0.1706 |
| 55041 | PLEKHB2 | HTA11_5212_2000001011 | Human | Colorectum | AD | 5.33e-03 | 6.03e-01 | -0.2061 |
| 55041 | PLEKHB2 | A015-C-203 | Human | Colorectum | FAP | 8.18e-07 | -1.58e-01 | -0.1294 |
| 55041 | PLEKHB2 | A001-C-108 | Human | Colorectum | FAP | 6.65e-03 | -1.22e-01 | -0.0272 |
| 55041 | PLEKHB2 | A015-C-106 | Human | Colorectum | FAP | 1.21e-02 | -1.27e-01 | -0.0511 |
| 55041 | PLEKHB2 | A002-C-114 | Human | Colorectum | FAP | 1.30e-05 | -2.34e-01 | -0.1561 |
| 55041 | PLEKHB2 | A015-C-104 | Human | Colorectum | FAP | 2.25e-07 | -1.89e-01 | -0.1899 |
| 55041 | PLEKHB2 | A002-C-116 | Human | Colorectum | FAP | 1.43e-04 | -1.40e-01 | -0.0452 |
| 55041 | PLEKHB2 | F034 | Human | Colorectum | FAP | 5.86e-03 | -1.50e-01 | -0.0665 |
| 55041 | PLEKHB2 | CRC-3-11773 | Human | Colorectum | CRC | 1.19e-03 | 3.01e-01 | 0.2564 |
| 55041 | PLEKHB2 | LZE4T | Human | Esophagus | ESCC | 4.99e-05 | 2.15e-01 | 0.0811 |
| 55041 | PLEKHB2 | LZE8T | Human | Esophagus | ESCC | 7.39e-04 | 1.32e-01 | 0.067 |
| 55041 | PLEKHB2 | LZE20T | Human | Esophagus | ESCC | 2.53e-04 | 4.39e-02 | 0.0662 |
| 55041 | PLEKHB2 | LZE24T | Human | Esophagus | ESCC | 2.05e-13 | 3.06e-01 | 0.0596 |
| 55041 | PLEKHB2 | LZE21T | Human | Esophagus | ESCC | 7.47e-05 | 1.53e-02 | 0.0655 |
| 55041 | PLEKHB2 | LZE6T | Human | Esophagus | ESCC | 1.07e-08 | 3.14e-02 | 0.0845 |
| Page: 1 2 3 4 5 6 7 |
| Tissue | Expression Dynamics | Abbreviation |
| Colorectum (GSE201348) |  | FAP: Familial adenomatous polyposis |
| CRC: Colorectal cancer | ||
| Colorectum (HTA11) | 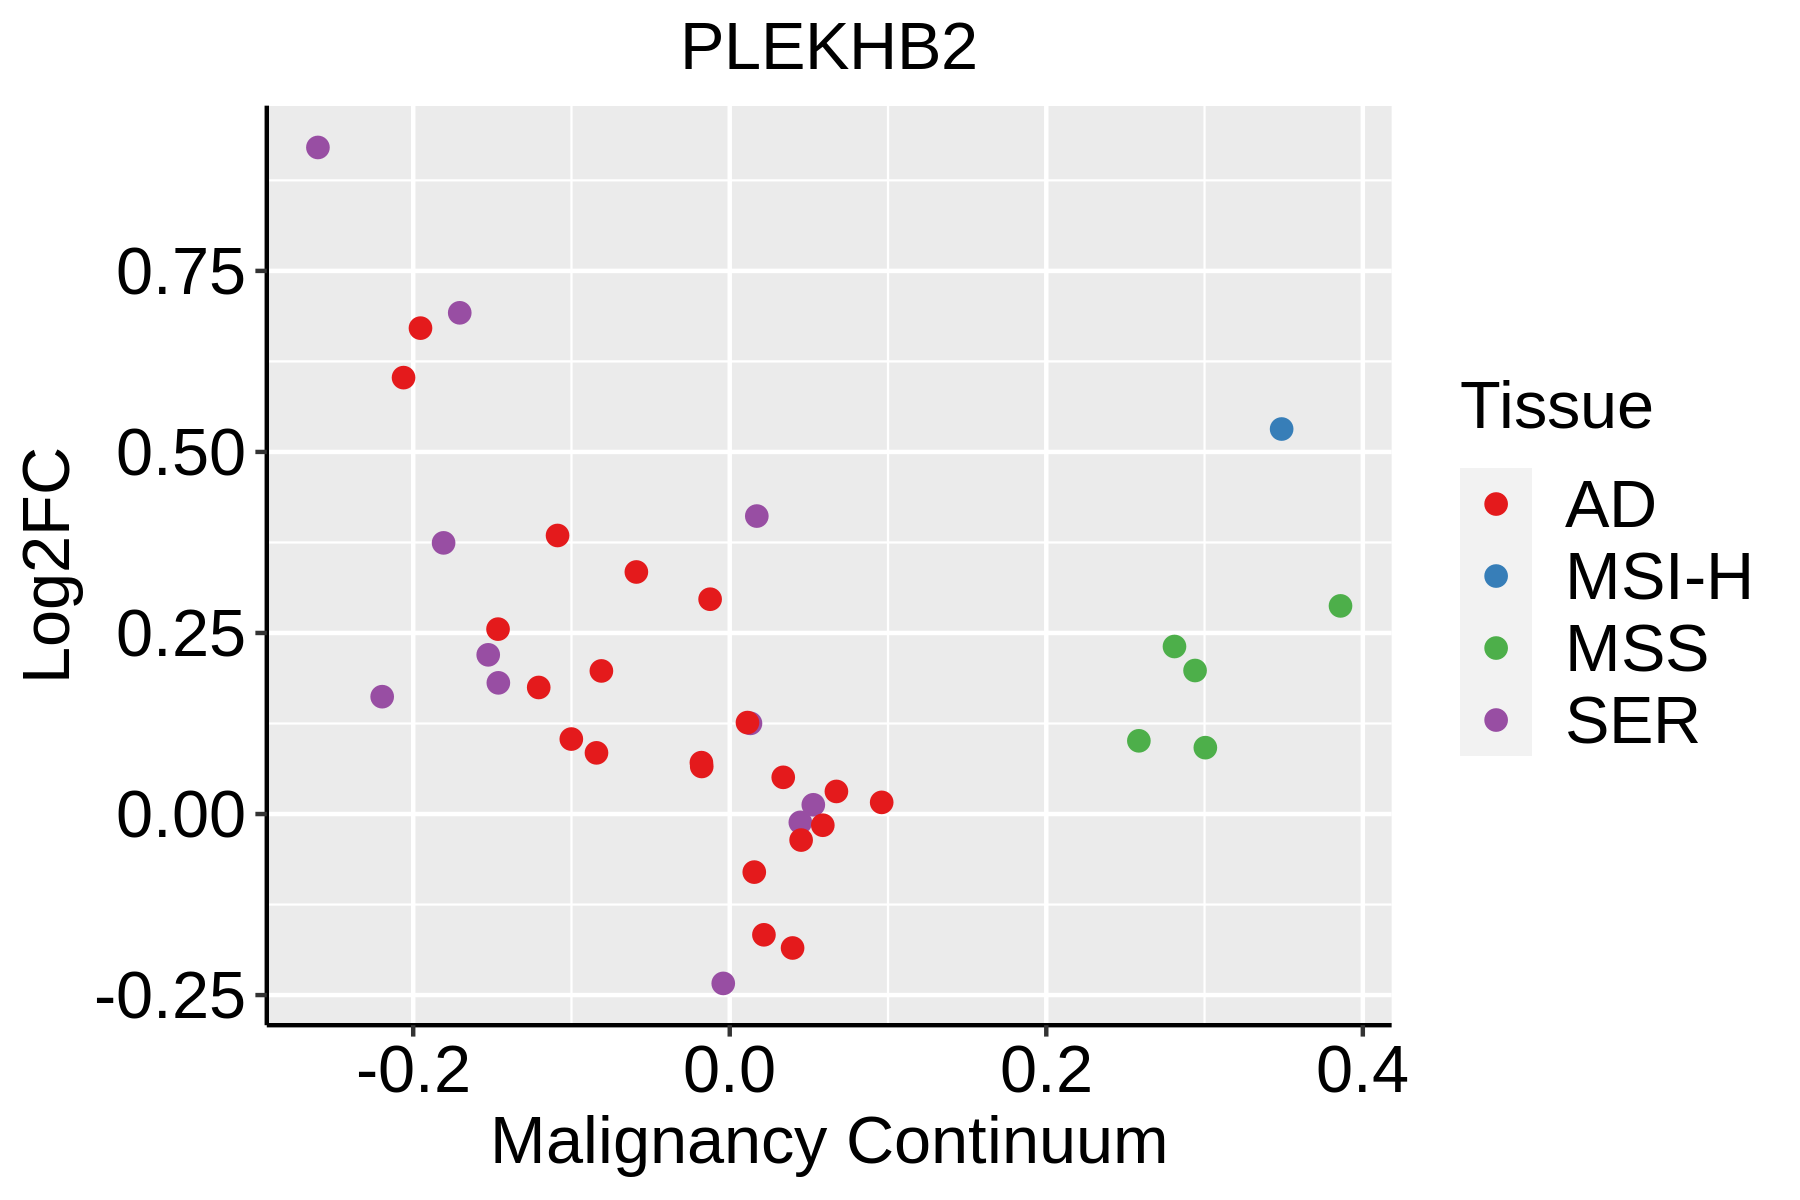 | AD: Adenomas |
| SER: Sessile serrated lesions | ||
| MSI-H: Microsatellite-high colorectal cancer | ||
| MSS: Microsatellite stable colorectal cancer | ||
| Esophagus |  | ESCC: Esophageal squamous cell carcinoma |
| HGIN: High-grade intraepithelial neoplasias | ||
| LGIN: Low-grade intraepithelial neoplasias | ||
| Liver |  | HCC: Hepatocellular carcinoma |
| NAFLD: Non-alcoholic fatty liver disease | ||
| Oral Cavity | 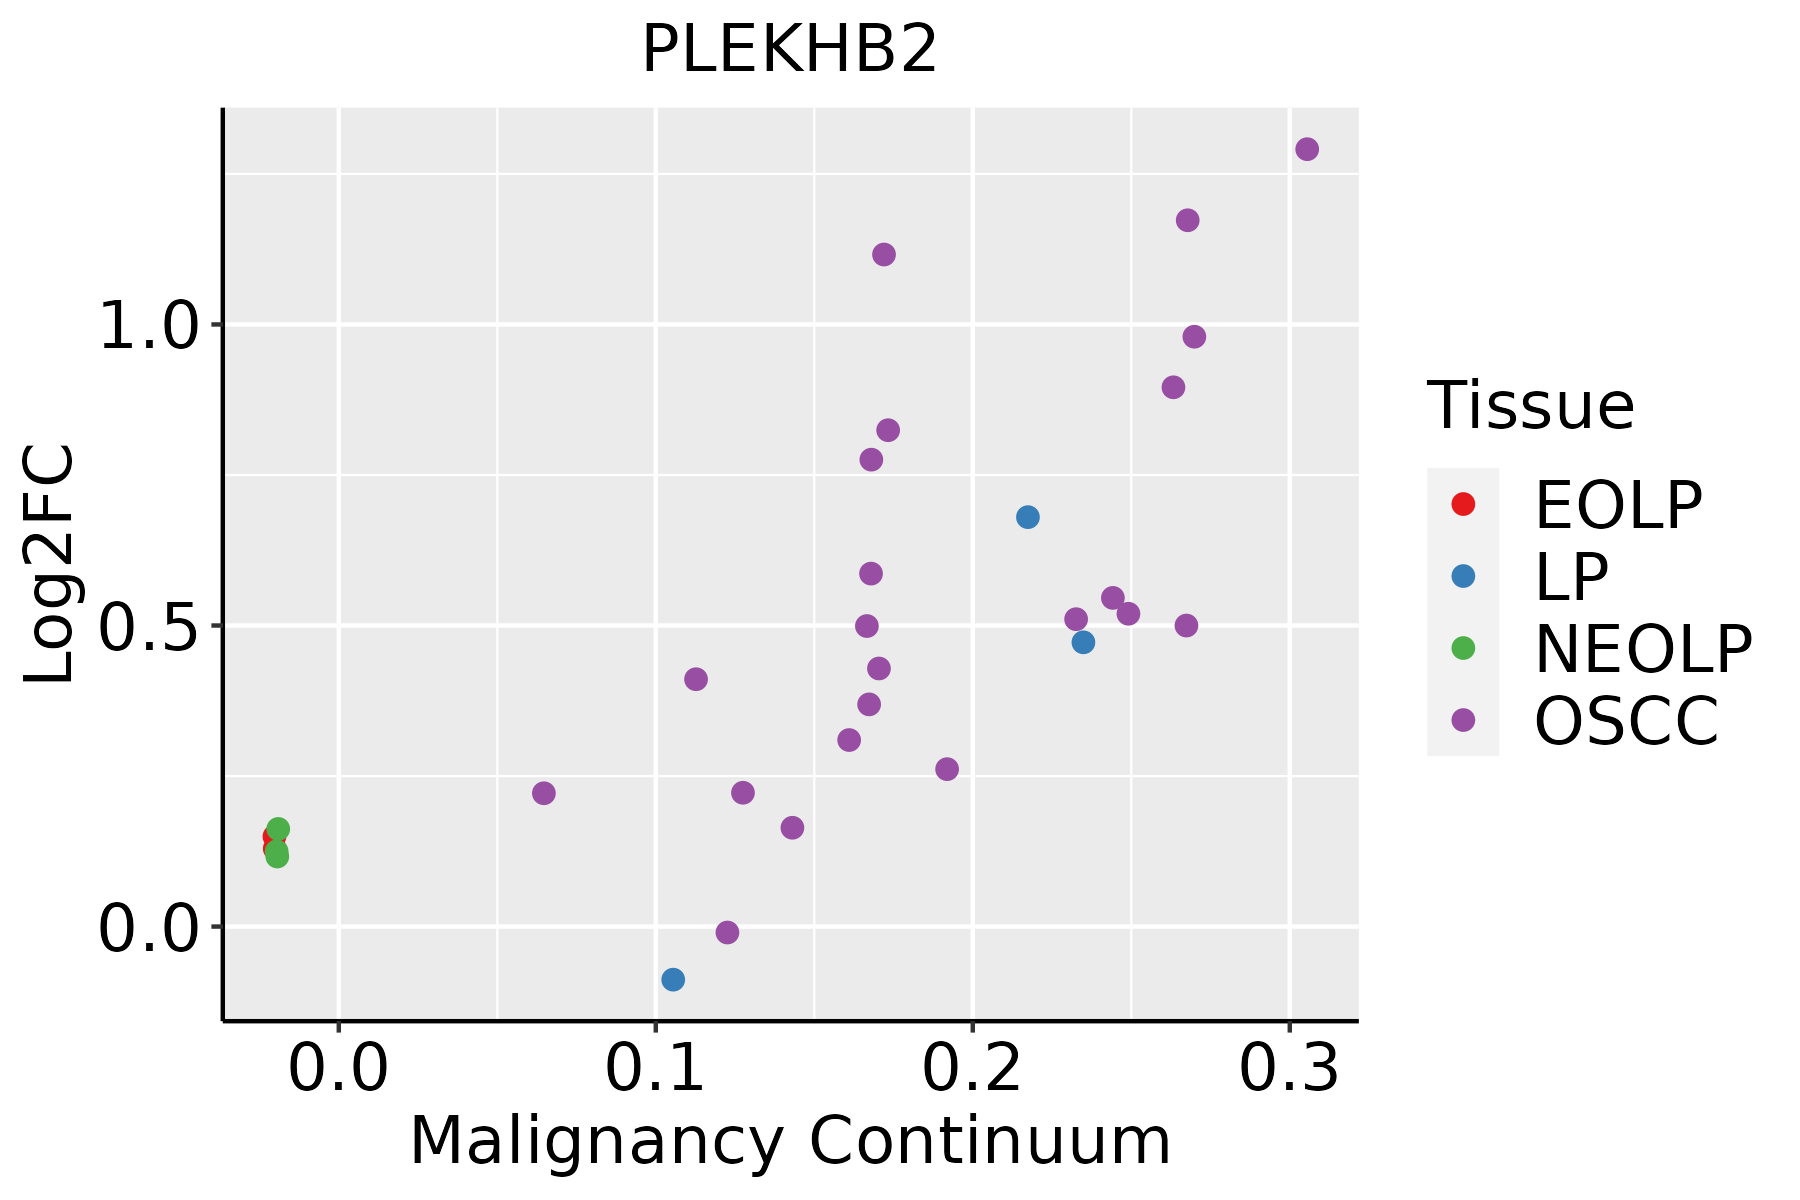 | EOLP: Erosive Oral lichen planus |
| LP: leukoplakia | ||
| NEOLP: Non-erosive oral lichen planus | ||
| OSCC: Oral squamous cell carcinoma | ||
| Prostate | 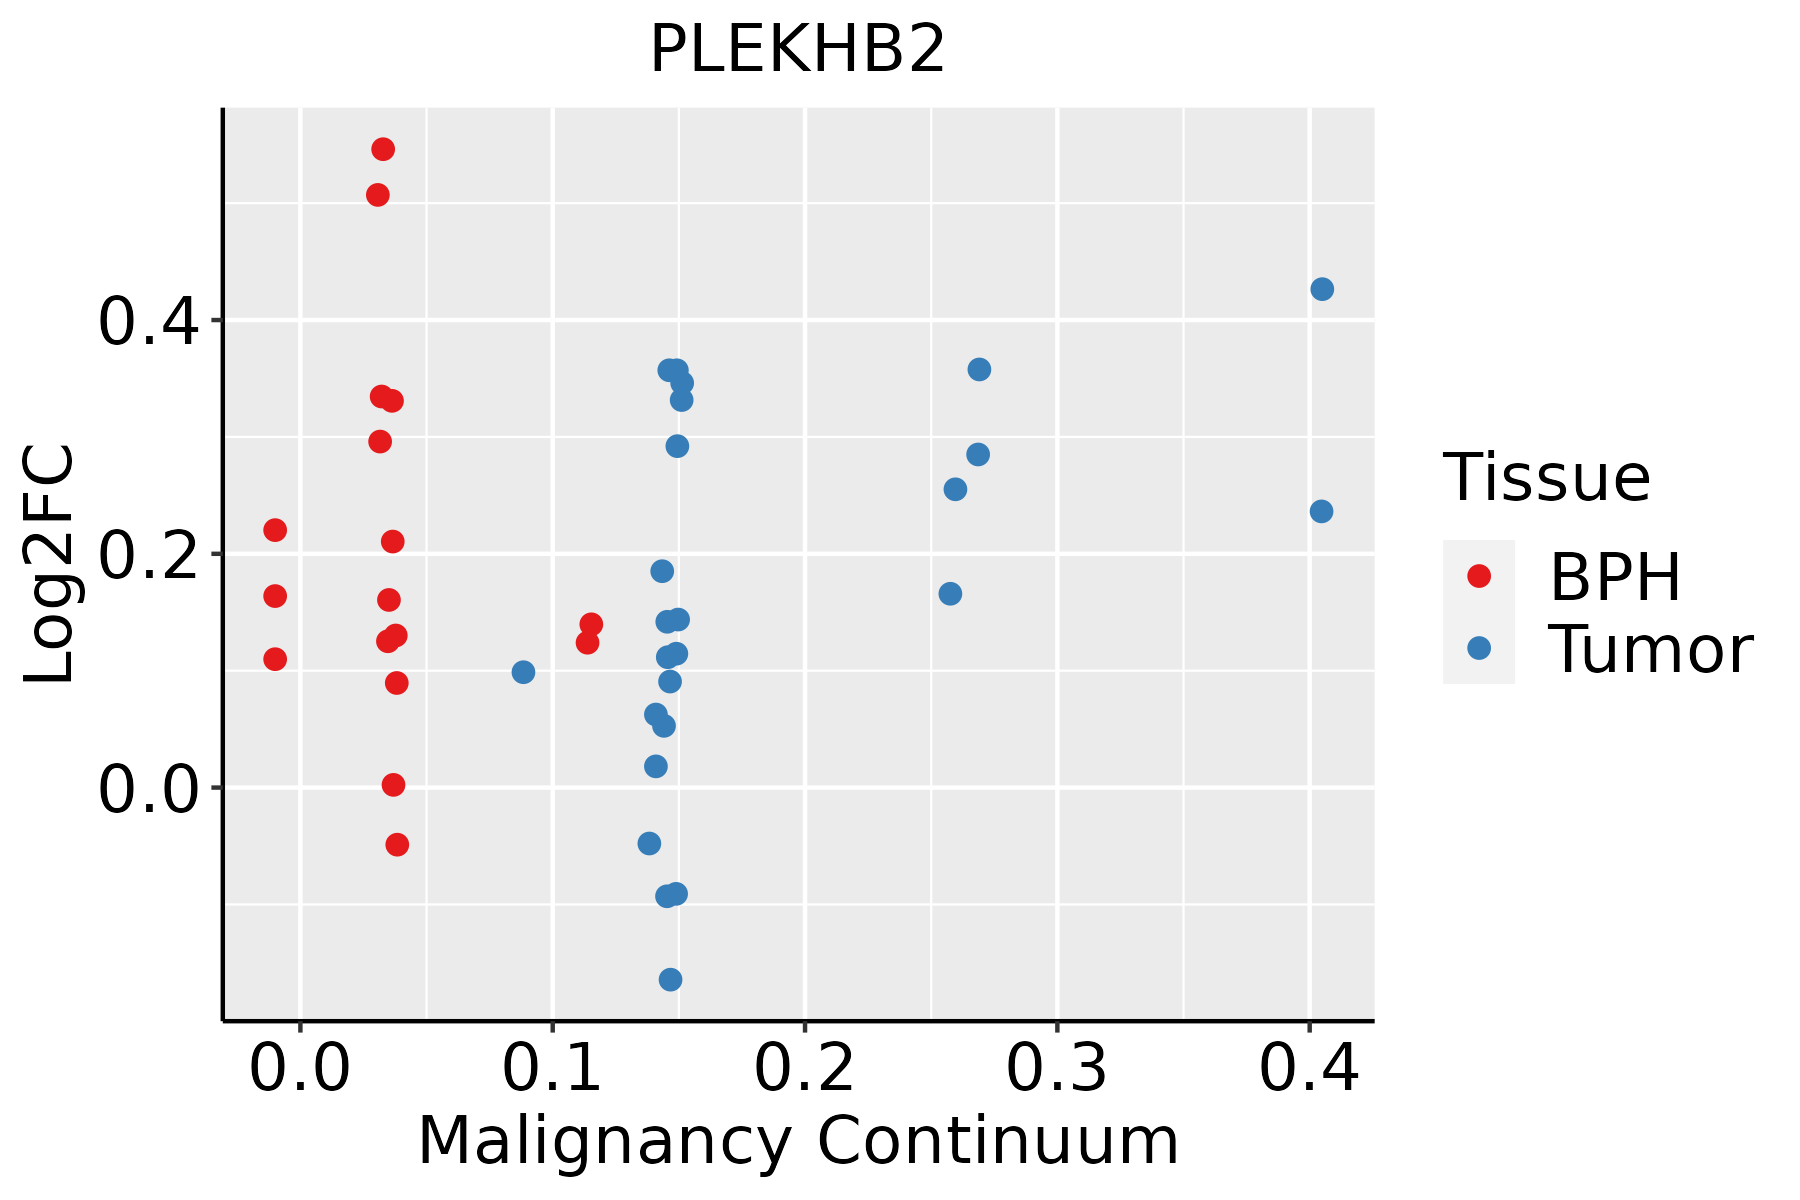 | BPH: Benign Prostatic Hyperplasia |
| Thyroid | 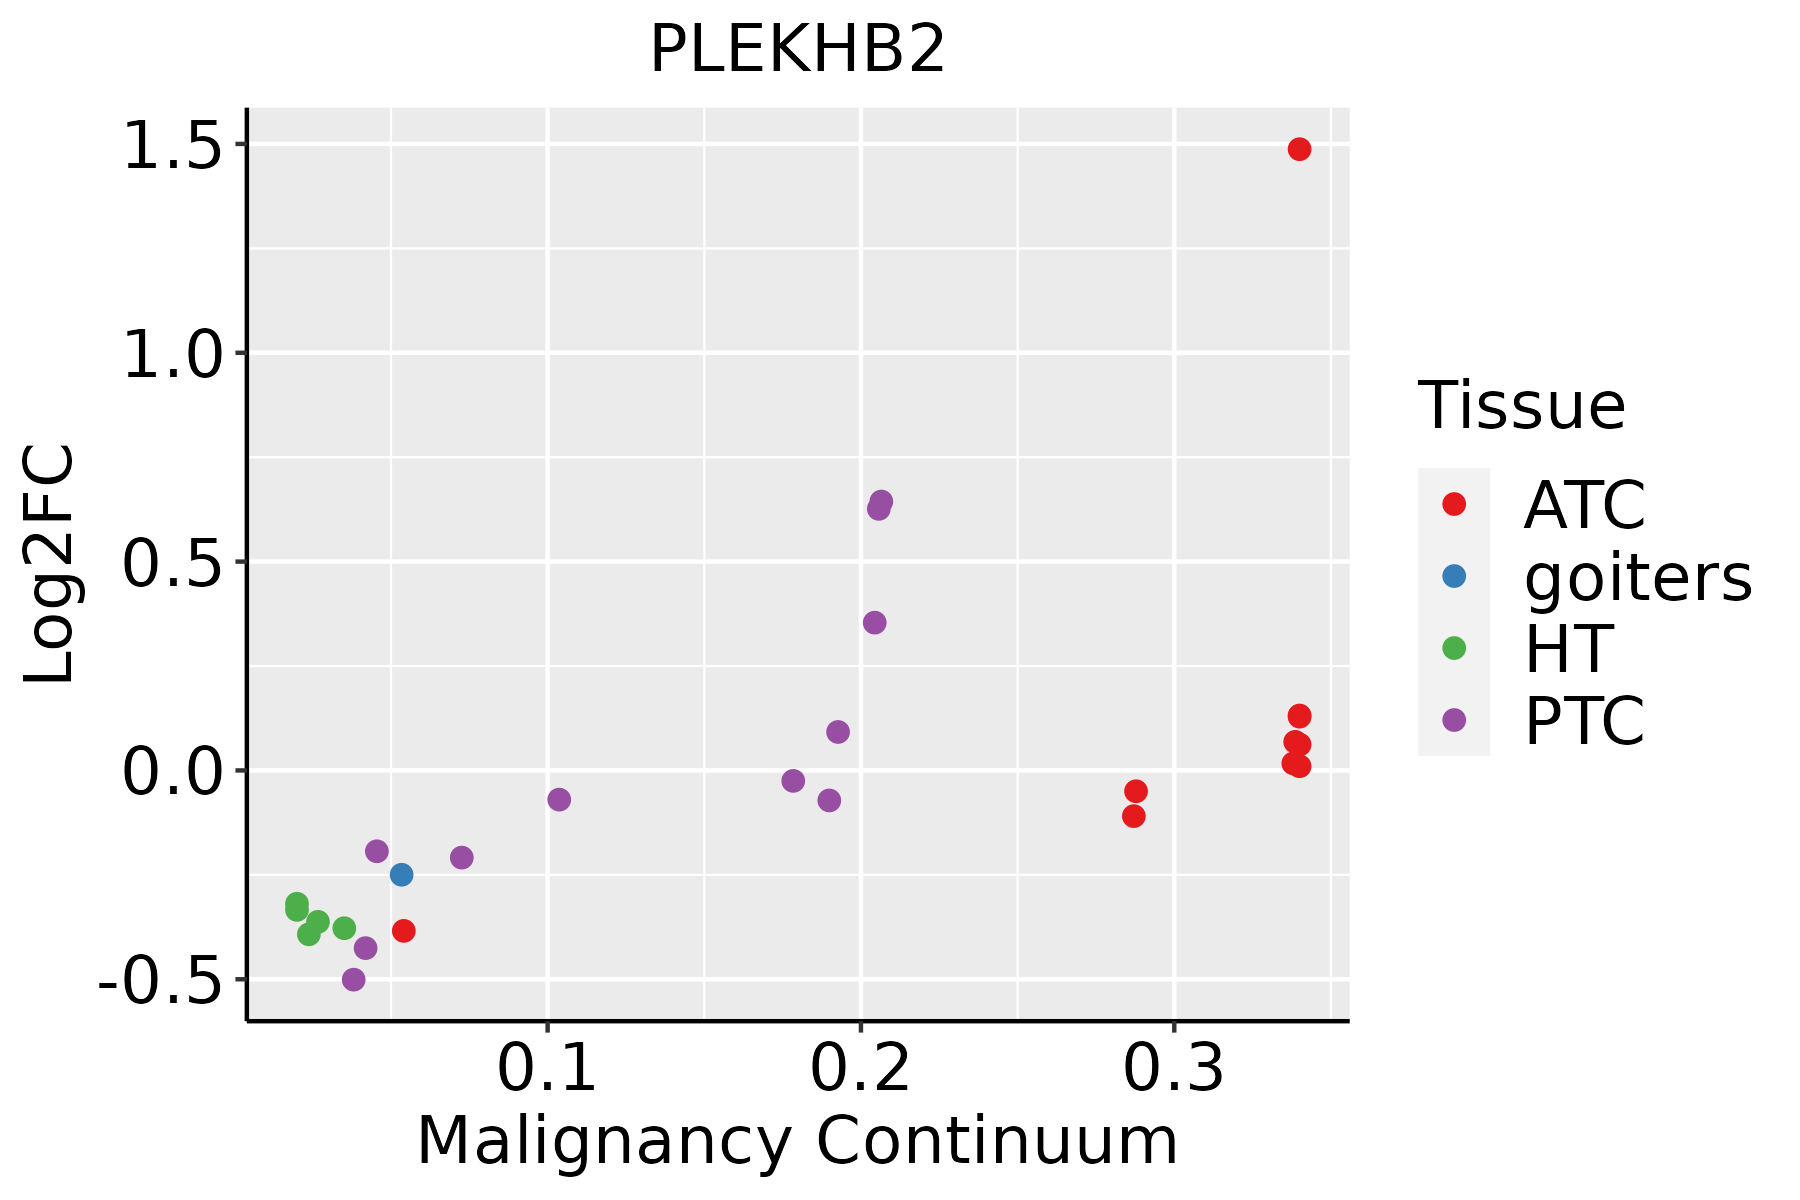 | ATC: Anaplastic thyroid cancer |
| HT: Hashimoto's thyroiditis | ||
| PTC: Papillary thyroid cancer |
| ∗log2FC in expression of this searched gene in stem-like cells from each diseased tissue sample relative to stem-like cells in normal samples in each tissue plotted against the malignancy continuum. Samples are colored based on if they are from different disease stage. |
Top |
Malignant transformation related pathway analysis |
| Find out the enriched GO biological processes and KEGG pathways involved in transition from healthy to precancer to cancer |
| Tissue | Disease Stage | Enriched GO biological Processes |
| Colorectum | AD |  |
| Colorectum | SER |  |
| Colorectum | MSS |  |
| Colorectum | MSI-H |  |
| Colorectum | FAP |  |
| ∗Top 15 enriched GO BP terms are showed in the bar plot of each disease state in each tissue. Each row represents a significant GO biological process which is colored according to the -log10(p.adjust). |
| Page: 1 2 3 4 5 6 7 8 9 |
| GO ID | Tissue | Disease Stage | Description | Gene Ratio | Bg Ratio | pvalue | p.adjust | Count |
| Page: 1 |
| Pathway ID | Tissue | Disease Stage | Description | Gene Ratio | Bg Ratio | pvalue | p.adjust | qvalue | Count |
| Page: 1 |
Top |
Cell-cell communication analysis |
| Identification of potential cell-cell interactions between two cell types and their ligand-receptor pairs for different disease states |
| Ligand | Receptor | LRpair | Pathway | Tissue | Disease Stage |
| Page: 1 |
Top |
Single-cell gene regulatory network inference analysis |
| Find out the significant the regulons (TFs) and the target genes of each regulon across cell types for different disease states |
| TF | Cell Type | Tissue | Disease Stage | Target Gene | RSS | Regulon Activity |
| ∗The dot plots of a searched regulon are shown for all cell subpopulations in each disease state of each tissue based on the regulon specific score inferred using pySCENIC and by calculating the average expression. |
| Page: 1 |
Top |
Somatic mutation of malignant transformation related genes |
| Annotation of somatic variants for genes involved in malignant transformation |
| Hugo Symbol | Variant Class | Variant Classification | dbSNP RS | HGVSc | HGVSp | HGVSp Short | SWISSPROT | BIOTYPE | SIFT | PolyPhen | Tumor Sample Barcode | Tissue | Histology | Sex | Age | Stage | Therapy Types | Drugs | Outcome |
| PLEKHB2 | SNV | Missense_Mutation | c.633N>G | p.Asn211Lys | p.N211K | protein_coding | deleterious(0.03) | possibly_damaging(0.573) | TCGA-A2-A04P-01 | Breast | breast invasive carcinoma | Female | <65 | III/IV | Chemotherapy | taxol | PD | ||
| PLEKHB2 | SNV | Missense_Mutation | c.162N>G | p.Ile54Met | p.I54M | protein_coding | deleterious(0.03) | possibly_damaging(0.824) | TCGA-AC-A23H-01 | Breast | breast invasive carcinoma | Female | >=65 | I/II | Unknown | Unknown | PD | ||
| PLEKHB2 | SNV | Missense_Mutation | c.147N>A | p.Met49Ile | p.M49I | protein_coding | tolerated(0.43) | benign(0.14) | TCGA-E2-A1IL-01 | Breast | breast invasive carcinoma | Female | >=65 | I/II | Hormone Therapy | arimidex | SD | ||
| PLEKHB2 | insertion | Frame_Shift_Ins | novel | c.653_654insTGATGTT | p.Met219AspfsTer27 | p.M219Dfs*27 | protein_coding | TCGA-A8-A08H-01 | Breast | breast invasive carcinoma | Female | >=65 | I/II | Unknown | Unknown | SD | |||
| PLEKHB2 | insertion | Frame_Shift_Ins | novel | c.654_655insGGTAGGTTAGGCGTATTAA | p.Met219GlyfsTer31 | p.M219Gfs*31 | protein_coding | TCGA-A8-A08H-01 | Breast | breast invasive carcinoma | Female | >=65 | I/II | Unknown | Unknown | SD | |||
| PLEKHB2 | SNV | Missense_Mutation | rs771487921 | c.173N>T | p.Thr58Met | p.T58M | protein_coding | tolerated(0.17) | benign(0.023) | TCGA-EA-A3HS-01 | Cervix | cervical & endocervical cancer | Female | <65 | I/II | Unknown | Unknown | SD | |
| PLEKHB2 | SNV | Missense_Mutation | rs150558543 | c.169C>T | p.Arg57Cys | p.R57C | protein_coding | deleterious(0.03) | benign(0.034) | TCGA-AA-3977-01 | Colorectum | colon adenocarcinoma | Male | >=65 | I/II | Unknown | Unknown | SD | |
| PLEKHB2 | SNV | Missense_Mutation | rs368388748 | c.634G>A | p.Asp212Asn | p.D212N | protein_coding | tolerated(0.12) | probably_damaging(0.987) | TCGA-AA-3984-01 | Colorectum | colon adenocarcinoma | Female | <65 | I/II | Unknown | Unknown | SD | |
| PLEKHB2 | SNV | Missense_Mutation | novel | c.316N>T | p.Asp106Tyr | p.D106Y | protein_coding | deleterious(0) | probably_damaging(0.985) | TCGA-A5-A0G2-01 | Endometrium | uterine corpus endometrioid carcinoma | Female | <65 | III/IV | Unknown | Unknown | SD | |
| PLEKHB2 | SNV | Missense_Mutation | novel | c.334N>A | p.Ala112Thr | p.A112T | protein_coding | tolerated(0.27) | benign(0.012) | TCGA-A5-A0G2-01 | Endometrium | uterine corpus endometrioid carcinoma | Female | <65 | III/IV | Unknown | Unknown | SD |
| Page: 1 2 3 4 |
Top |
Related drugs of malignant transformation related genes |
| Identification of chemicals and drugs interact with genes involved in malignant transfromation |
| (DGIdb 4.0) |
| Entrez ID | Symbol | Category | Interaction Types | Drug Claim Name | Drug Name | PMIDs |
| Page: 1 |

Copyright 2023-Present -The University of Texas Health Science Center at Houston |