
|
|||||
|
 | |
| |
| |
| |
| |
| |
|
Gene: PLEKHA8 |
Gene summary for PLEKHA8 |
| Gene information | Species | Human | Gene symbol | PLEKHA8 | Gene ID | 84725 |
| Gene name | pleckstrin homology domain containing A8 | |
| Gene Alias | FAPP2 | |
| Cytomap | 7p14.3 | |
| Gene Type | protein-coding | GO ID | GO:0006810 | UniProtAcc | Q96JA3 |
Top |
Malignant transformation analysis |
| Identification of the aberrant gene expression in precancerous and cancerous lesions by comparing the gene expression of stem-like cells in diseased tissues with normal stem cells |
| Entrez ID | Symbol | Replicates | Species | Organ | Tissue | Adj P-value | Log2FC | Malignancy |
| 84725 | PLEKHA8 | HCC1_Meng | Human | Liver | HCC | 3.03e-11 | 1.92e-02 | 0.0246 |
| 84725 | PLEKHA8 | HCC2_Meng | Human | Liver | HCC | 1.20e-02 | 1.08e-02 | 0.0107 |
| 84725 | PLEKHA8 | HCC2 | Human | Liver | HCC | 2.25e-02 | 1.29e+00 | 0.5341 |
| 84725 | PLEKHA8 | S014 | Human | Liver | HCC | 2.27e-03 | 2.30e-01 | 0.2254 |
| 84725 | PLEKHA8 | S027 | Human | Liver | HCC | 1.98e-05 | 5.08e-01 | 0.2446 |
| 84725 | PLEKHA8 | S028 | Human | Liver | HCC | 4.35e-13 | 6.02e-01 | 0.2503 |
| 84725 | PLEKHA8 | S029 | Human | Liver | HCC | 4.77e-16 | 6.11e-01 | 0.2581 |
| 84725 | PLEKHA8 | male-WTA | Human | Thyroid | PTC | 2.94e-03 | 6.32e-02 | 0.1037 |
| 84725 | PLEKHA8 | PTC05 | Human | Thyroid | PTC | 3.56e-04 | 1.39e-01 | 0.2065 |
| 84725 | PLEKHA8 | PTC06 | Human | Thyroid | PTC | 4.79e-09 | 2.58e-01 | 0.2057 |
| 84725 | PLEKHA8 | PTC07 | Human | Thyroid | PTC | 1.58e-02 | 6.25e-02 | 0.2044 |
| 84725 | PLEKHA8 | ATC09 | Human | Thyroid | ATC | 7.42e-06 | 2.03e-01 | 0.2871 |
| 84725 | PLEKHA8 | ATC12 | Human | Thyroid | ATC | 1.30e-03 | 1.12e-01 | 0.34 |
| 84725 | PLEKHA8 | ATC13 | Human | Thyroid | ATC | 3.33e-30 | 5.44e-01 | 0.34 |
| 84725 | PLEKHA8 | ATC1 | Human | Thyroid | ATC | 5.40e-04 | 1.91e-01 | 0.2878 |
| 84725 | PLEKHA8 | ATC2 | Human | Thyroid | ATC | 2.29e-08 | 7.61e-01 | 0.34 |
| 84725 | PLEKHA8 | ATC4 | Human | Thyroid | ATC | 2.23e-06 | 1.46e-01 | 0.34 |
| 84725 | PLEKHA8 | ATC5 | Human | Thyroid | ATC | 2.25e-31 | 5.85e-01 | 0.34 |
| Page: 1 |
| Tissue | Expression Dynamics | Abbreviation |
| Liver | 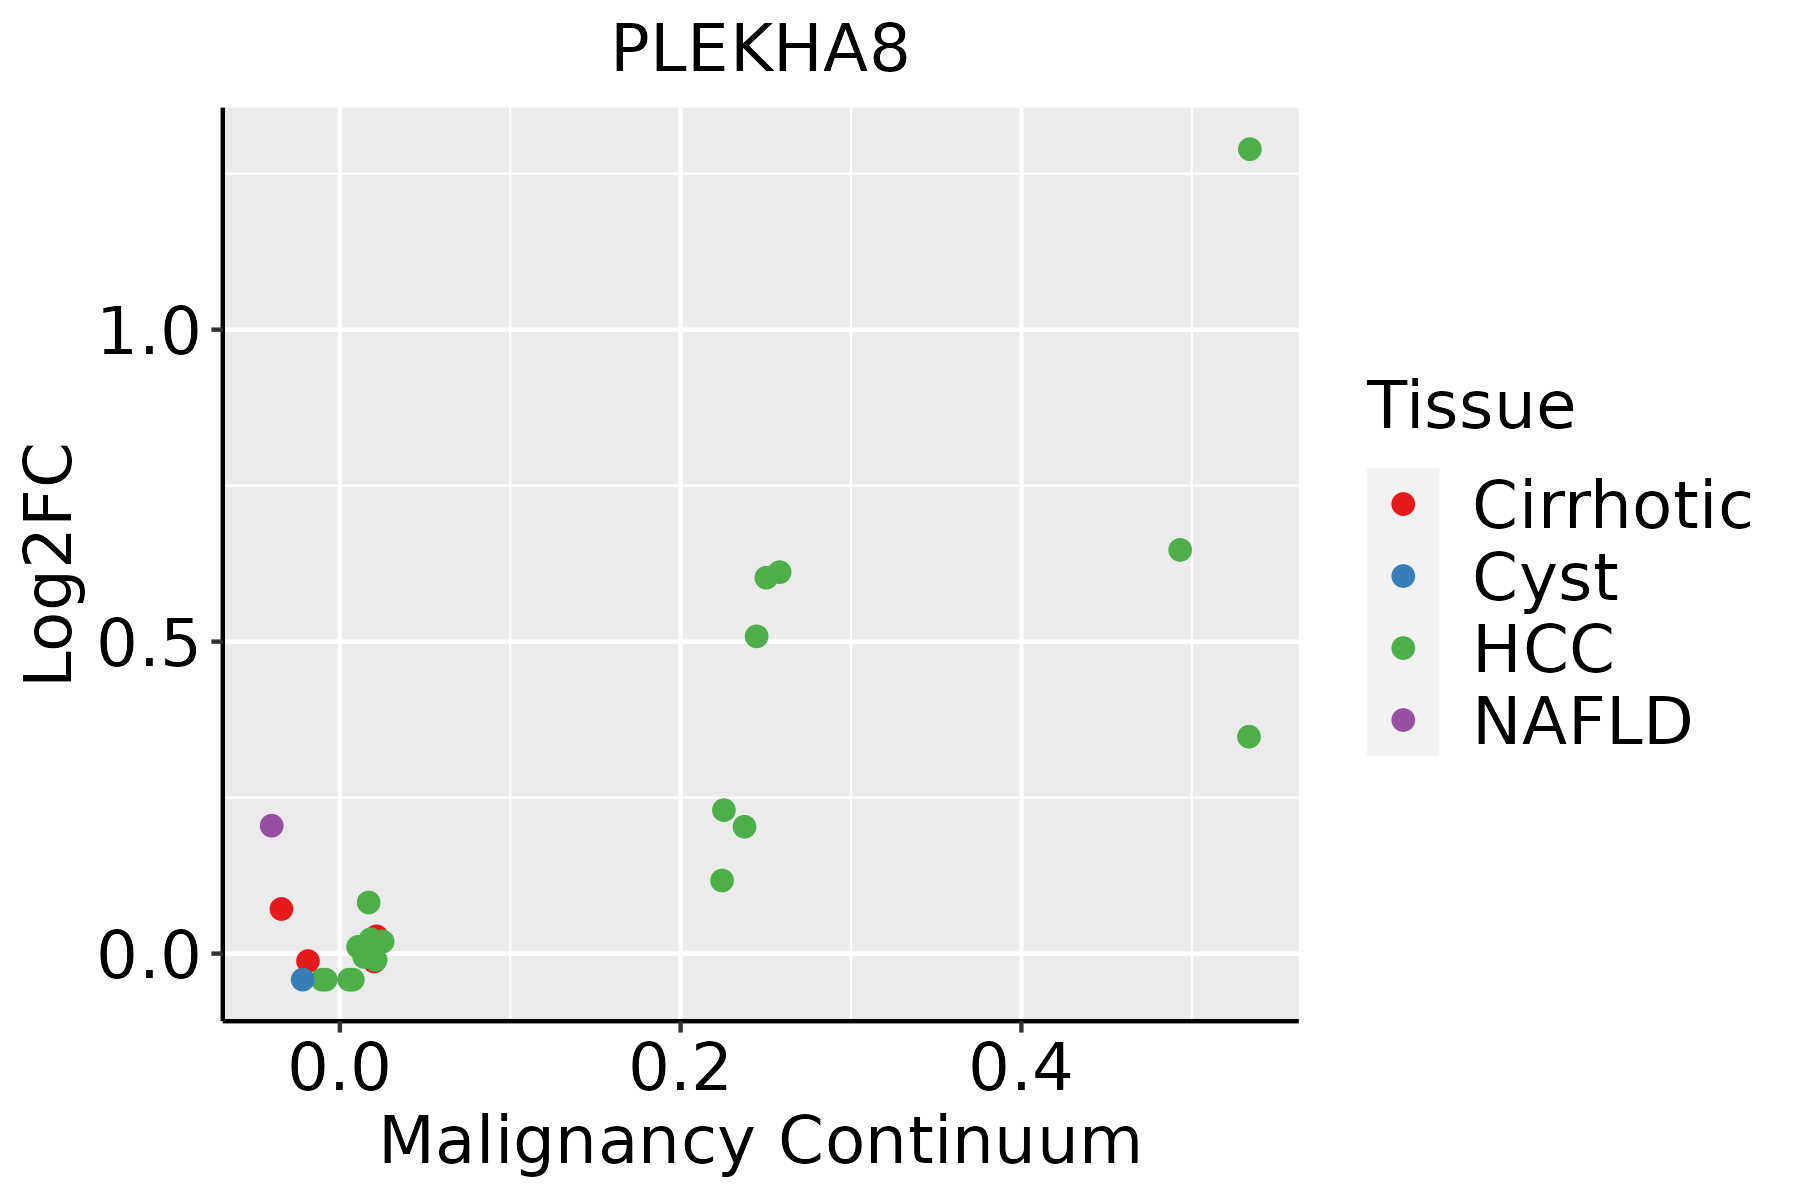 | HCC: Hepatocellular carcinoma |
| NAFLD: Non-alcoholic fatty liver disease | ||
| Thyroid |  | ATC: Anaplastic thyroid cancer |
| HT: Hashimoto's thyroiditis | ||
| PTC: Papillary thyroid cancer |
| ∗log2FC in expression of this searched gene in stem-like cells from each diseased tissue sample relative to stem-like cells in normal samples in each tissue plotted against the malignancy continuum. Samples are colored based on if they are from different disease stage. |
Top |
Malignant transformation related pathway analysis |
| Find out the enriched GO biological processes and KEGG pathways involved in transition from healthy to precancer to cancer |
| Tissue | Disease Stage | Enriched GO biological Processes |
| Colorectum | AD |  |
| Colorectum | SER |  |
| Colorectum | MSS |  |
| Colorectum | MSI-H |  |
| Colorectum | FAP |  |
| ∗Top 15 enriched GO BP terms are showed in the bar plot of each disease state in each tissue. Each row represents a significant GO biological process which is colored according to the -log10(p.adjust). |
| Page: 1 2 3 4 5 6 7 8 9 |
| GO ID | Tissue | Disease Stage | Description | Gene Ratio | Bg Ratio | pvalue | p.adjust | Count |
| GO:001087621 | Liver | HCC | lipid localization | 228/7958 | 448/18723 | 1.80e-04 | 1.41e-03 | 228 |
| GO:01200092 | Liver | HCC | intermembrane lipid transfer | 33/7958 | 48/18723 | 2.12e-04 | 1.63e-03 | 33 |
| GO:1901264 | Liver | HCC | carbohydrate derivative transport | 48/7958 | 80/18723 | 1.19e-03 | 6.62e-03 | 48 |
| GO:000686921 | Liver | HCC | lipid transport | 198/7958 | 398/18723 | 1.92e-03 | 9.78e-03 | 198 |
| Page: 1 |
| Pathway ID | Tissue | Disease Stage | Description | Gene Ratio | Bg Ratio | pvalue | p.adjust | qvalue | Count |
| Page: 1 |
Top |
Cell-cell communication analysis |
| Identification of potential cell-cell interactions between two cell types and their ligand-receptor pairs for different disease states |
| Ligand | Receptor | LRpair | Pathway | Tissue | Disease Stage |
| Page: 1 |
Top |
Single-cell gene regulatory network inference analysis |
| Find out the significant the regulons (TFs) and the target genes of each regulon across cell types for different disease states |
| TF | Cell Type | Tissue | Disease Stage | Target Gene | RSS | Regulon Activity |
| ∗The dot plots of a searched regulon are shown for all cell subpopulations in each disease state of each tissue based on the regulon specific score inferred using pySCENIC and by calculating the average expression. |
| Page: 1 |
Top |
Somatic mutation of malignant transformation related genes |
| Annotation of somatic variants for genes involved in malignant transformation |
| Hugo Symbol | Variant Class | Variant Classification | dbSNP RS | HGVSc | HGVSp | HGVSp Short | SWISSPROT | BIOTYPE | SIFT | PolyPhen | Tumor Sample Barcode | Tissue | Histology | Sex | Age | Stage | Therapy Types | Drugs | Outcome |
| PLEKHA8 | SNV | Missense_Mutation | c.436G>A | p.Glu146Lys | p.E146K | Q96JA3 | protein_coding | tolerated(0.11) | benign(0.003) | TCGA-3C-AALI-01 | Breast | breast invasive carcinoma | Female | <65 | I/II | Unspecific | Poly E | Complete Response | |
| PLEKHA8 | SNV | Missense_Mutation | c.725N>T | p.Ser242Phe | p.S242F | Q96JA3 | protein_coding | deleterious(0.02) | benign(0.017) | TCGA-AN-A041-01 | Breast | breast invasive carcinoma | Female | <65 | I/II | Unknown | Unknown | SD | |
| PLEKHA8 | SNV | Missense_Mutation | rs555138725 | c.965N>C | p.Ile322Thr | p.I322T | Q96JA3 | protein_coding | deleterious(0) | possibly_damaging(0.856) | TCGA-B6-A401-01 | Breast | breast invasive carcinoma | Female | <65 | I/II | Chemotherapy | cyclophosphamide | SD |
| PLEKHA8 | SNV | Missense_Mutation | rs764315108 | c.749N>C | p.Ile250Thr | p.I250T | Q96JA3 | protein_coding | tolerated(0.65) | benign(0) | TCGA-BH-A18G-01 | Breast | breast invasive carcinoma | Female | >=65 | I/II | Unknown | Unknown | SD |
| PLEKHA8 | SNV | Missense_Mutation | novel | c.1378N>T | p.Ala460Ser | p.A460S | Q96JA3 | protein_coding | tolerated(0.19) | possibly_damaging(0.601) | TCGA-EW-A2FS-01 | Breast | breast invasive carcinoma | Female | <65 | I/II | Hormone Therapy | goserelin | SD |
| PLEKHA8 | insertion | Nonsense_Mutation | novel | c.108_109insGTGCTTTTTGTACGTTTAGTGAGATGA | p.Ala36_Trp37insValLeuPheValArgLeuValArgTer | p.A36_W37insVLFVRLVR* | Q96JA3 | protein_coding | TCGA-BH-A0E7-01 | Breast | breast invasive carcinoma | Female | >=65 | I/II | Hormone Therapy | arimidex | SD | ||
| PLEKHA8 | SNV | Missense_Mutation | c.1165G>A | p.Glu389Lys | p.E389K | Q96JA3 | protein_coding | deleterious(0) | probably_damaging(0.954) | TCGA-JX-A3Q0-01 | Cervix | cervical & endocervical cancer | Female | <65 | III/IV | Unknown | Unknown | SD | |
| PLEKHA8 | SNV | Missense_Mutation | novel | c.1120N>G | p.Thr374Ala | p.T374A | Q96JA3 | protein_coding | deleterious(0.01) | benign(0.41) | TCGA-A6-4105-01 | Colorectum | colon adenocarcinoma | Male | >=65 | I/II | Unknown | Unknown | PD |
| PLEKHA8 | SNV | Missense_Mutation | c.847N>T | p.Asp283Tyr | p.D283Y | Q96JA3 | protein_coding | deleterious(0.02) | benign(0.029) | TCGA-A6-5656-01 | Colorectum | colon adenocarcinoma | Male | >=65 | I/II | Unknown | Unknown | SD | |
| PLEKHA8 | SNV | Missense_Mutation | novel | c.611N>G | p.Ile204Ser | p.I204S | Q96JA3 | protein_coding | tolerated(0.49) | benign(0.005) | TCGA-AA-A00N-01 | Colorectum | colon adenocarcinoma | Male | >=65 | I/II | Unknown | Unknown | PD |
| Page: 1 2 3 4 5 |
Top |
Related drugs of malignant transformation related genes |
| Identification of chemicals and drugs interact with genes involved in malignant transfromation |
| (DGIdb 4.0) |
| Entrez ID | Symbol | Category | Interaction Types | Drug Claim Name | Drug Name | PMIDs |
| Page: 1 |

Copyright 2023-Present -The University of Texas Health Science Center at Houston |