
|
|||||
|
 | |
| |
| |
| |
| |
| |
|
Gene: PLEKHA3 |
Gene summary for PLEKHA3 |
| Gene information | Species | Human | Gene symbol | PLEKHA3 | Gene ID | 65977 |
| Gene name | pleckstrin homology domain containing A3 | |
| Gene Alias | FAPP1 | |
| Cytomap | 2q31.2 | |
| Gene Type | protein-coding | GO ID | GO:0006810 | UniProtAcc | Q9HB20 |
Top |
Malignant transformation analysis |
| Identification of the aberrant gene expression in precancerous and cancerous lesions by comparing the gene expression of stem-like cells in diseased tissues with normal stem cells |
| Entrez ID | Symbol | Replicates | Species | Organ | Tissue | Adj P-value | Log2FC | Malignancy |
| 65977 | PLEKHA3 | LZE4T | Human | Esophagus | ESCC | 8.56e-07 | 7.93e-02 | 0.0811 |
| 65977 | PLEKHA3 | LZE7T | Human | Esophagus | ESCC | 7.72e-04 | 7.36e-02 | 0.0667 |
| 65977 | PLEKHA3 | LZE20T | Human | Esophagus | ESCC | 4.08e-04 | 2.74e-02 | 0.0662 |
| 65977 | PLEKHA3 | LZE24T | Human | Esophagus | ESCC | 1.19e-11 | 2.27e-01 | 0.0596 |
| 65977 | PLEKHA3 | P1T-E | Human | Esophagus | ESCC | 3.63e-07 | 1.74e-01 | 0.0875 |
| 65977 | PLEKHA3 | P2T-E | Human | Esophagus | ESCC | 1.26e-20 | 3.07e-01 | 0.1177 |
| 65977 | PLEKHA3 | P4T-E | Human | Esophagus | ESCC | 2.03e-29 | 6.43e-01 | 0.1323 |
| 65977 | PLEKHA3 | P5T-E | Human | Esophagus | ESCC | 1.30e-13 | 3.51e-01 | 0.1327 |
| 65977 | PLEKHA3 | P8T-E | Human | Esophagus | ESCC | 7.17e-13 | 2.08e-01 | 0.0889 |
| 65977 | PLEKHA3 | P9T-E | Human | Esophagus | ESCC | 3.33e-15 | 2.47e-01 | 0.1131 |
| 65977 | PLEKHA3 | P10T-E | Human | Esophagus | ESCC | 8.97e-21 | 2.41e-01 | 0.116 |
| 65977 | PLEKHA3 | P11T-E | Human | Esophagus | ESCC | 7.21e-14 | 3.62e-01 | 0.1426 |
| 65977 | PLEKHA3 | P12T-E | Human | Esophagus | ESCC | 2.41e-17 | 3.29e-01 | 0.1122 |
| 65977 | PLEKHA3 | P15T-E | Human | Esophagus | ESCC | 5.84e-11 | 2.28e-01 | 0.1149 |
| 65977 | PLEKHA3 | P16T-E | Human | Esophagus | ESCC | 8.34e-08 | 1.42e-01 | 0.1153 |
| 65977 | PLEKHA3 | P17T-E | Human | Esophagus | ESCC | 5.43e-05 | 1.66e-01 | 0.1278 |
| 65977 | PLEKHA3 | P20T-E | Human | Esophagus | ESCC | 2.44e-16 | 2.60e-01 | 0.1124 |
| 65977 | PLEKHA3 | P21T-E | Human | Esophagus | ESCC | 2.86e-11 | 1.57e-01 | 0.1617 |
| 65977 | PLEKHA3 | P22T-E | Human | Esophagus | ESCC | 4.76e-14 | 1.50e-01 | 0.1236 |
| 65977 | PLEKHA3 | P23T-E | Human | Esophagus | ESCC | 2.54e-23 | 4.79e-01 | 0.108 |
| Page: 1 2 3 4 5 |
| Tissue | Expression Dynamics | Abbreviation |
| Esophagus | 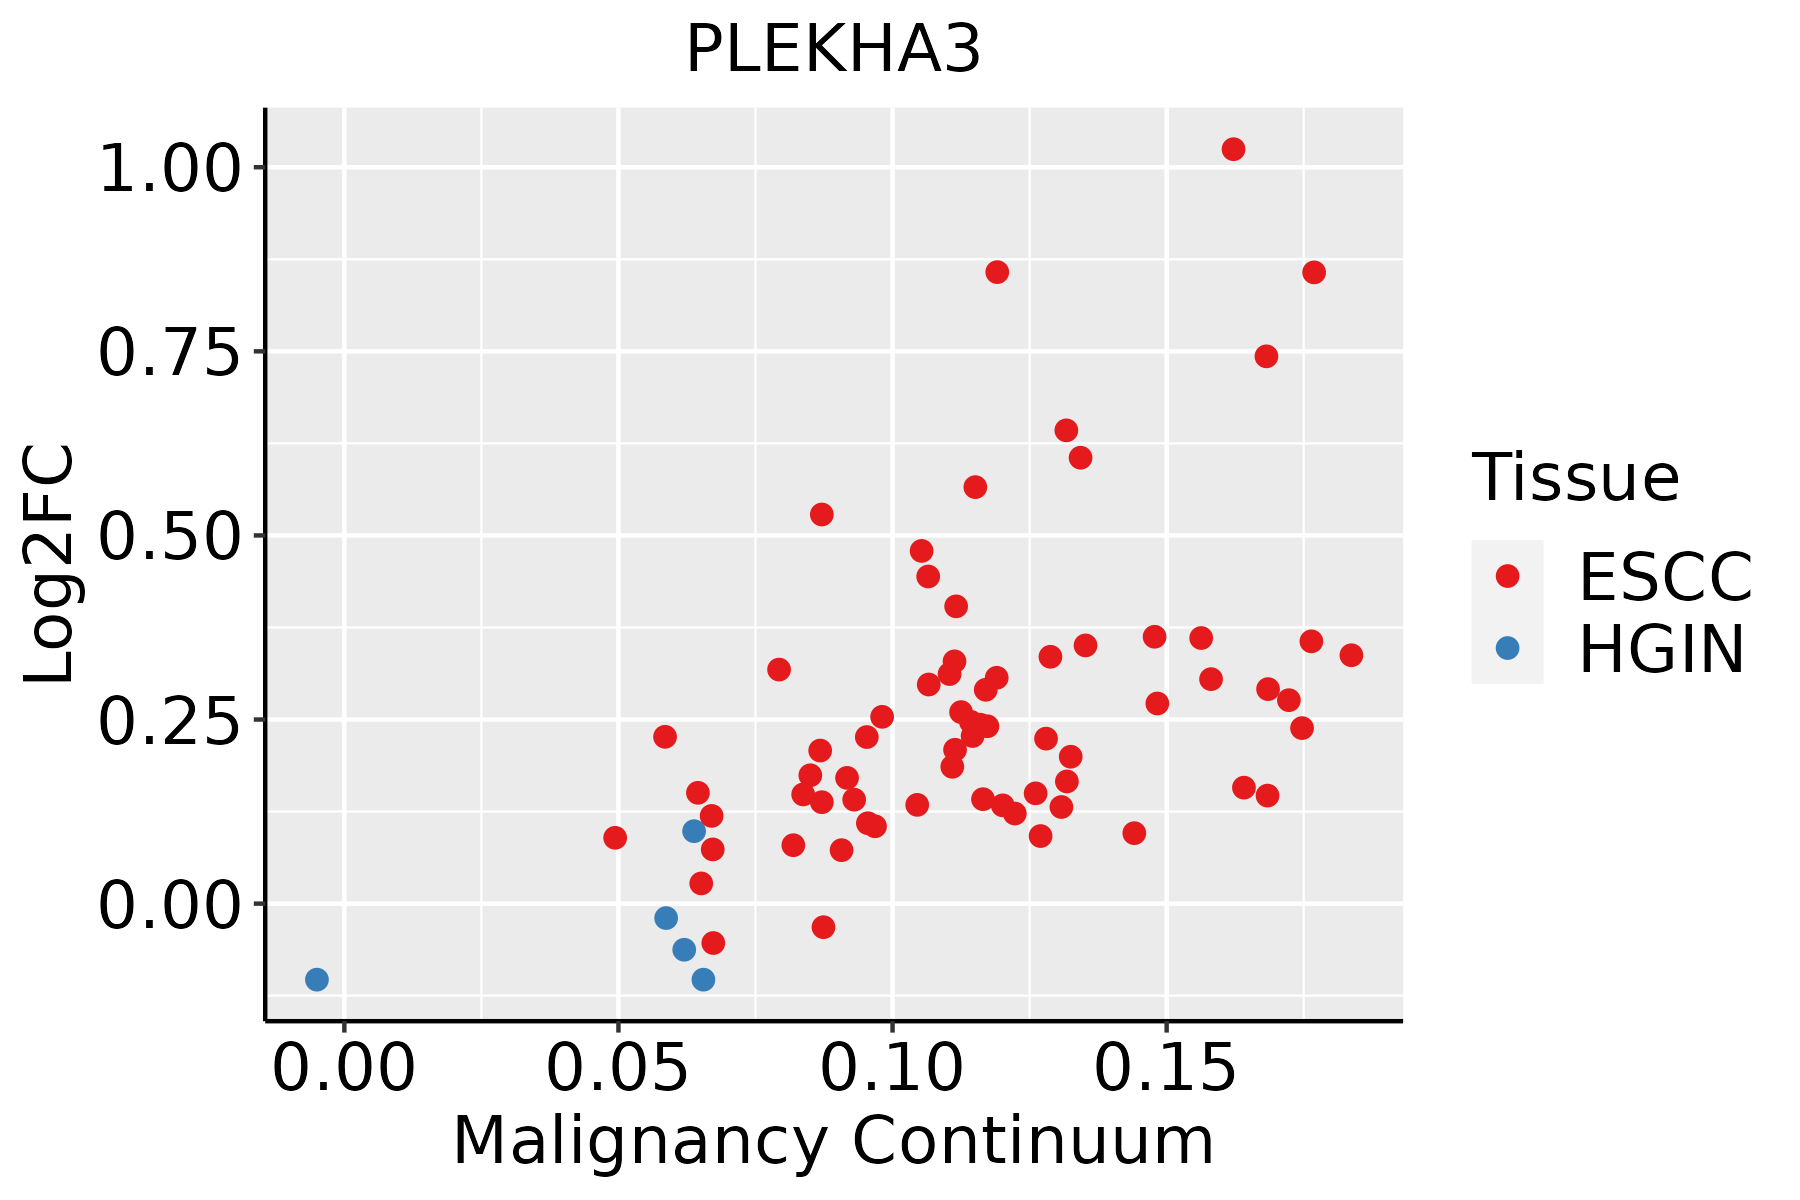 | ESCC: Esophageal squamous cell carcinoma |
| HGIN: High-grade intraepithelial neoplasias | ||
| LGIN: Low-grade intraepithelial neoplasias | ||
| Liver | 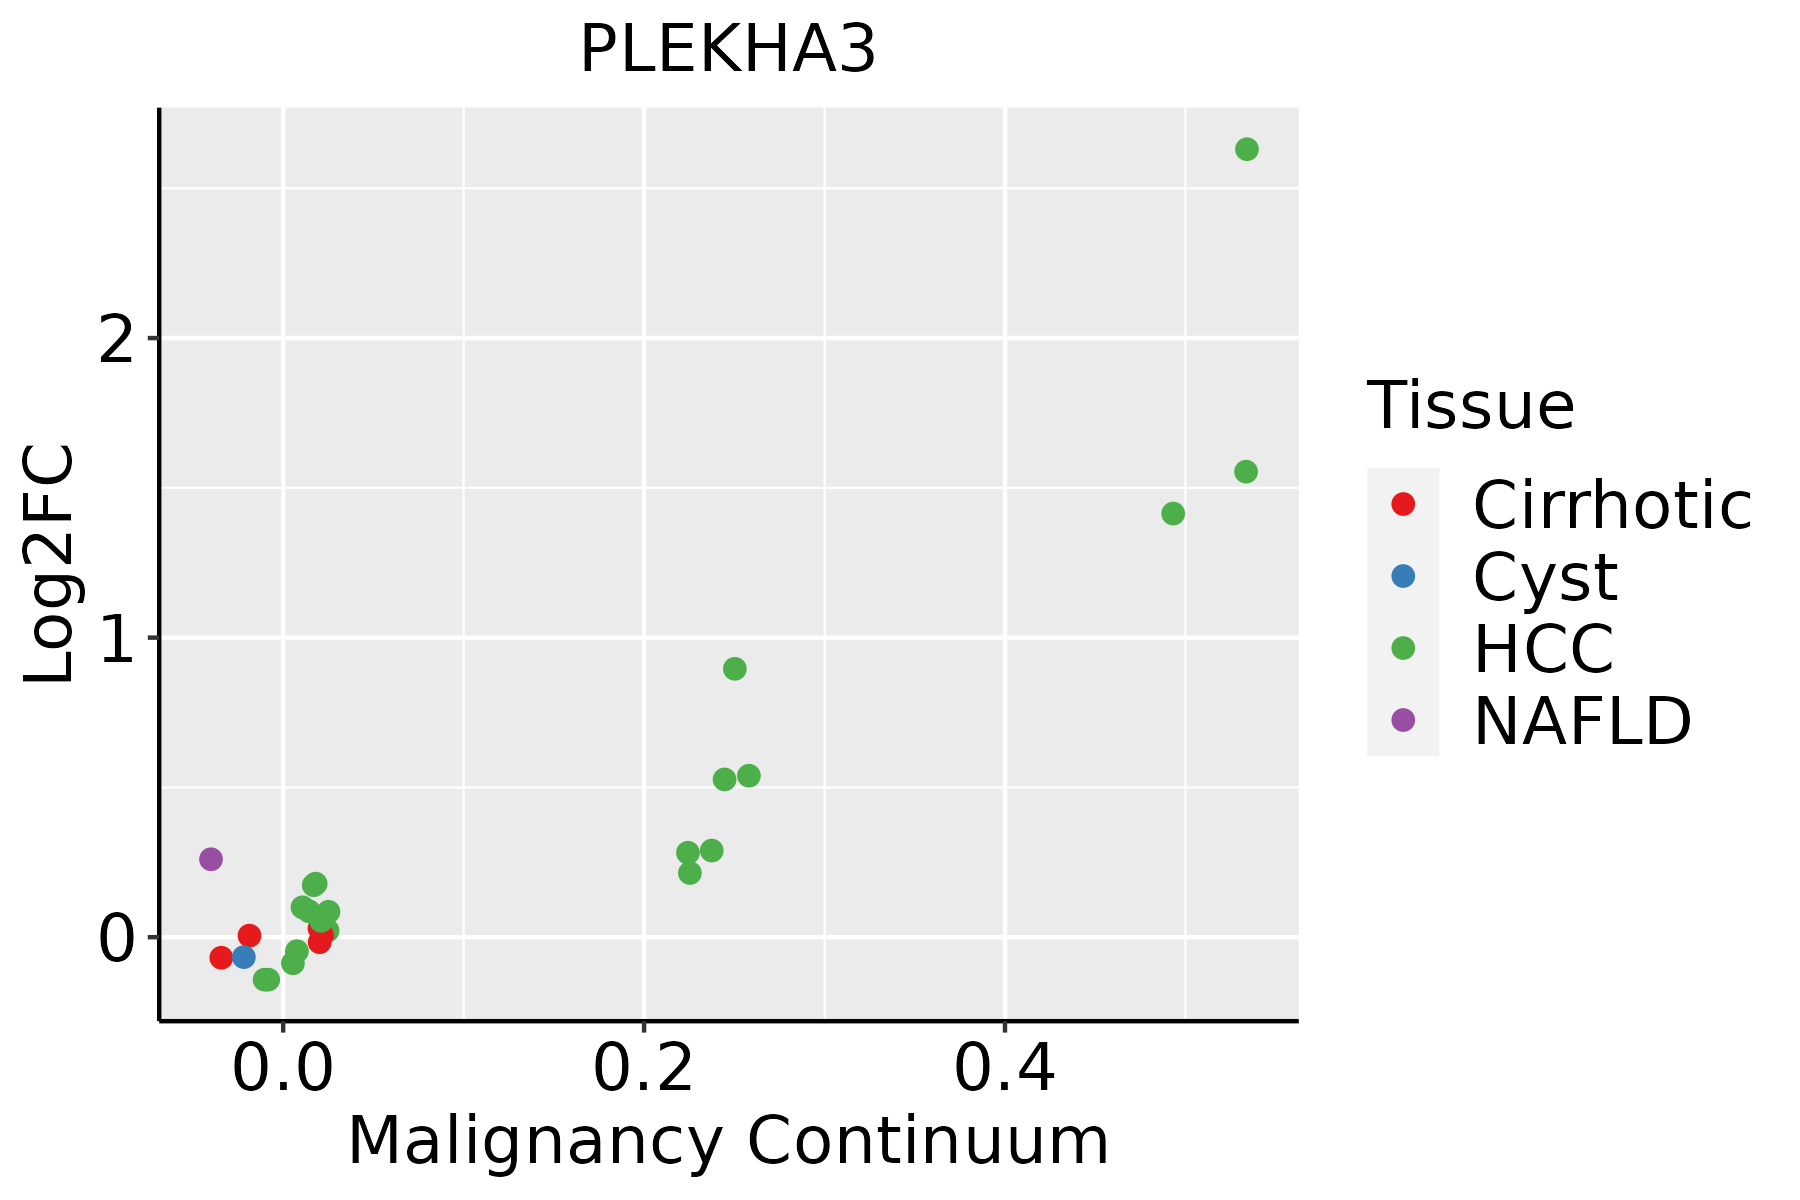 | HCC: Hepatocellular carcinoma |
| NAFLD: Non-alcoholic fatty liver disease | ||
| Oral Cavity |  | EOLP: Erosive Oral lichen planus |
| LP: leukoplakia | ||
| NEOLP: Non-erosive oral lichen planus | ||
| OSCC: Oral squamous cell carcinoma | ||
| Thyroid | 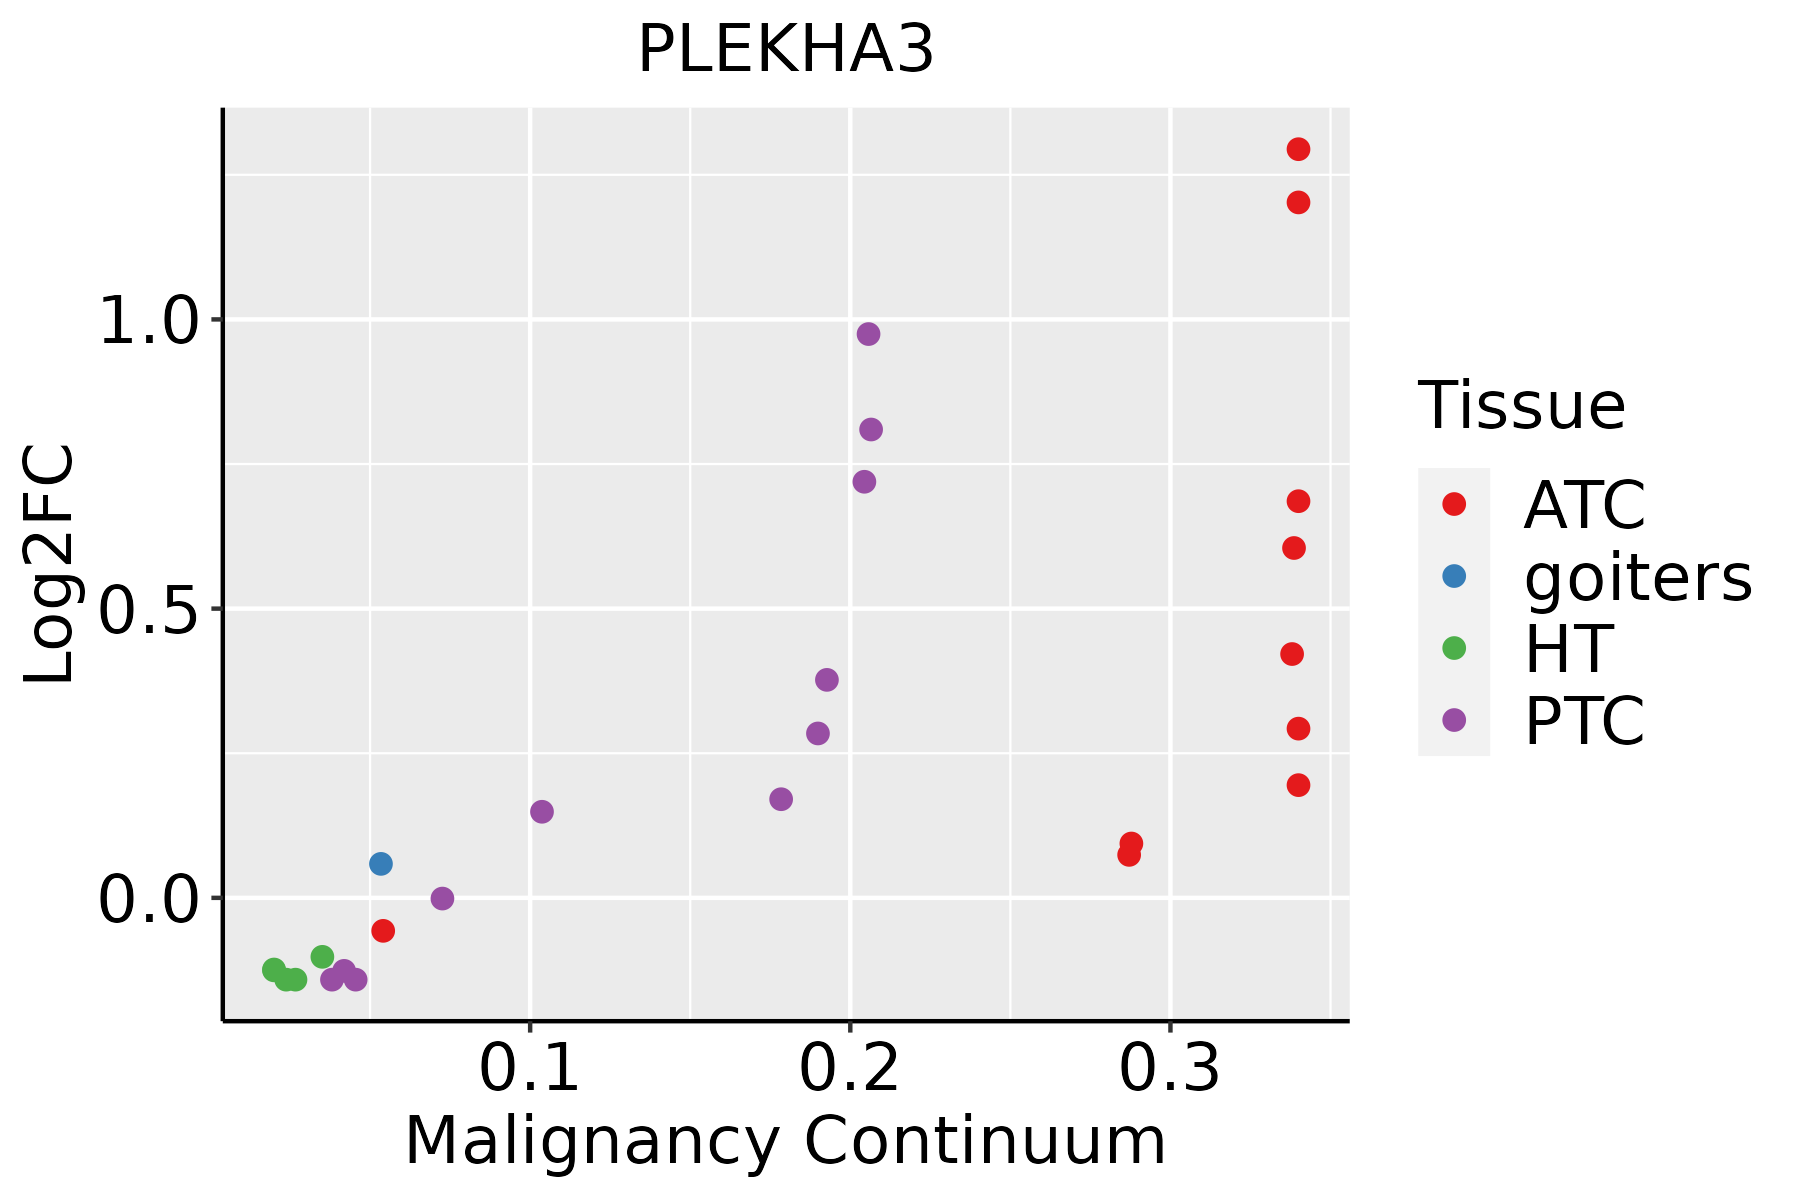 | ATC: Anaplastic thyroid cancer |
| HT: Hashimoto's thyroiditis | ||
| PTC: Papillary thyroid cancer |
| ∗log2FC in expression of this searched gene in stem-like cells from each diseased tissue sample relative to stem-like cells in normal samples in each tissue plotted against the malignancy continuum. Samples are colored based on if they are from different disease stage. |
Top |
Malignant transformation related pathway analysis |
| Find out the enriched GO biological processes and KEGG pathways involved in transition from healthy to precancer to cancer |
| Tissue | Disease Stage | Enriched GO biological Processes |
| Colorectum | AD |  |
| Colorectum | SER |  |
| Colorectum | MSS |  |
| Colorectum | MSI-H |  |
| Colorectum | FAP |  |
| ∗Top 15 enriched GO BP terms are showed in the bar plot of each disease state in each tissue. Each row represents a significant GO biological process which is colored according to the -log10(p.adjust). |
| Page: 1 2 3 4 5 6 7 8 9 |
| GO ID | Tissue | Disease Stage | Description | Gene Ratio | Bg Ratio | pvalue | p.adjust | Count |
| GO:001087621 | Liver | HCC | lipid localization | 228/7958 | 448/18723 | 1.80e-04 | 1.41e-03 | 228 |
| GO:01200092 | Liver | HCC | intermembrane lipid transfer | 33/7958 | 48/18723 | 2.12e-04 | 1.63e-03 | 33 |
| GO:000686921 | Liver | HCC | lipid transport | 198/7958 | 398/18723 | 1.92e-03 | 9.78e-03 | 198 |
| GO:00157483 | Oral cavity | EOLP | organophosphate ester transport | 28/2218 | 140/18723 | 3.66e-03 | 2.05e-02 | 28 |
| Page: 1 |
| Pathway ID | Tissue | Disease Stage | Description | Gene Ratio | Bg Ratio | pvalue | p.adjust | qvalue | Count |
| Page: 1 |
Top |
Cell-cell communication analysis |
| Identification of potential cell-cell interactions between two cell types and their ligand-receptor pairs for different disease states |
| Ligand | Receptor | LRpair | Pathway | Tissue | Disease Stage |
| Page: 1 |
Top |
Single-cell gene regulatory network inference analysis |
| Find out the significant the regulons (TFs) and the target genes of each regulon across cell types for different disease states |
| TF | Cell Type | Tissue | Disease Stage | Target Gene | RSS | Regulon Activity |
| ∗The dot plots of a searched regulon are shown for all cell subpopulations in each disease state of each tissue based on the regulon specific score inferred using pySCENIC and by calculating the average expression. |
| Page: 1 |
Top |
Somatic mutation of malignant transformation related genes |
| Annotation of somatic variants for genes involved in malignant transformation |
| Hugo Symbol | Variant Class | Variant Classification | dbSNP RS | HGVSc | HGVSp | HGVSp Short | SWISSPROT | BIOTYPE | SIFT | PolyPhen | Tumor Sample Barcode | Tissue | Histology | Sex | Age | Stage | Therapy Types | Drugs | Outcome |
| PLEKHA3 | SNV | Missense_Mutation | c.883C>T | p.Leu295Phe | p.L295F | Q9HB20 | protein_coding | tolerated_low_confidence(0.06) | benign(0.001) | TCGA-5L-AAT1-01 | Breast | breast invasive carcinoma | Female | <65 | III/IV | Hormone Therapy | letrozol | SD | |
| PLEKHA3 | SNV | Missense_Mutation | novel | c.16N>C | p.Tyr6His | p.Y6H | Q9HB20 | protein_coding | tolerated(0.14) | benign(0.106) | TCGA-AN-A046-01 | Breast | breast invasive carcinoma | Female | >=65 | I/II | Unknown | Unknown | SD |
| PLEKHA3 | SNV | Missense_Mutation | novel | c.160N>A | p.His54Asn | p.H54N | Q9HB20 | protein_coding | tolerated(0.09) | benign(0.377) | TCGA-AN-A046-01 | Breast | breast invasive carcinoma | Female | >=65 | I/II | Unknown | Unknown | SD |
| PLEKHA3 | SNV | Missense_Mutation | c.595T>C | p.Ser199Pro | p.S199P | Q9HB20 | protein_coding | tolerated(0.05) | benign(0.012) | TCGA-AA-3506-01 | Colorectum | colon adenocarcinoma | Male | >=65 | I/II | Unknown | Unknown | SD | |
| PLEKHA3 | SNV | Missense_Mutation | c.25N>G | p.Thr9Ala | p.T9A | Q9HB20 | protein_coding | deleterious(0.01) | benign(0.089) | TCGA-AA-A010-01 | Colorectum | colon adenocarcinoma | Female | <65 | I/II | Chemotherapy | folinic | CR | |
| PLEKHA3 | SNV | Missense_Mutation | c.335N>T | p.Ser112Leu | p.S112L | Q9HB20 | protein_coding | tolerated(0.12) | benign(0.087) | TCGA-AZ-6598-01 | Colorectum | colon adenocarcinoma | Female | >=65 | I/II | Unknown | Unknown | SD | |
| PLEKHA3 | SNV | Missense_Mutation | novel | c.426N>T | p.Glu142Asp | p.E142D | Q9HB20 | protein_coding | tolerated(0.4) | benign(0) | TCGA-AG-A002-01 | Colorectum | rectum adenocarcinoma | Male | <65 | I/II | Unknown | Unknown | SD |
| PLEKHA3 | SNV | Missense_Mutation | novel | c.148G>A | p.Glu50Lys | p.E50K | Q9HB20 | protein_coding | deleterious(0) | probably_damaging(0.997) | TCGA-EI-6917-01 | Colorectum | rectum adenocarcinoma | Male | <65 | III/IV | Chemotherapy | 5fluorouracil+oxaciplatina+l-folinian | SD |
| PLEKHA3 | insertion | Frame_Shift_Ins | novel | c.488_489insT | p.Asn164Ter | p.N164* | Q9HB20 | protein_coding | TCGA-CM-5861-01 | Colorectum | colon adenocarcinoma | Female | <65 | I/II | Unknown | Unknown | PD | ||
| PLEKHA3 | SNV | Missense_Mutation | novel | c.34N>A | p.Leu12Ile | p.L12I | Q9HB20 | protein_coding | tolerated(0.29) | benign(0.003) | TCGA-AP-A1DV-01 | Endometrium | uterine corpus endometrioid carcinoma | Female | <65 | I/II | Unknown | Unknown | SD |
| Page: 1 2 3 4 |
Top |
Related drugs of malignant transformation related genes |
| Identification of chemicals and drugs interact with genes involved in malignant transfromation |
| (DGIdb 4.0) |
| Entrez ID | Symbol | Category | Interaction Types | Drug Claim Name | Drug Name | PMIDs |
| Page: 1 |

Copyright 2023-Present -The University of Texas Health Science Center at Houston |