
|
|||||
|
 | |
| |
| |
| |
| |
| |
|
Gene: PLEKHA2 |
Gene summary for PLEKHA2 |
| Gene information | Species | Human | Gene symbol | PLEKHA2 | Gene ID | 59339 |
| Gene name | pleckstrin homology domain containing A2 | |
| Gene Alias | TAPP2 | |
| Cytomap | 8p11.22 | |
| Gene Type | protein-coding | GO ID | GO:0001952 | UniProtAcc | A8K727 |
Top |
Malignant transformation analysis |
| Identification of the aberrant gene expression in precancerous and cancerous lesions by comparing the gene expression of stem-like cells in diseased tissues with normal stem cells |
| Entrez ID | Symbol | Replicates | Species | Organ | Tissue | Adj P-value | Log2FC | Malignancy |
| 59339 | PLEKHA2 | LZE4T | Human | Esophagus | ESCC | 6.97e-03 | 1.26e-01 | 0.0811 |
| 59339 | PLEKHA2 | LZE8T | Human | Esophagus | ESCC | 4.91e-06 | 1.34e-01 | 0.067 |
| 59339 | PLEKHA2 | LZE20T | Human | Esophagus | ESCC | 6.23e-04 | 1.84e-01 | 0.0662 |
| 59339 | PLEKHA2 | LZE24T | Human | Esophagus | ESCC | 1.23e-10 | 1.45e-01 | 0.0596 |
| 59339 | PLEKHA2 | P2T-E | Human | Esophagus | ESCC | 2.69e-13 | 2.80e-01 | 0.1177 |
| 59339 | PLEKHA2 | P4T-E | Human | Esophagus | ESCC | 1.72e-07 | 1.23e-01 | 0.1323 |
| 59339 | PLEKHA2 | P5T-E | Human | Esophagus | ESCC | 7.79e-08 | 3.02e-03 | 0.1327 |
| 59339 | PLEKHA2 | P8T-E | Human | Esophagus | ESCC | 2.28e-11 | 2.77e-01 | 0.0889 |
| 59339 | PLEKHA2 | P10T-E | Human | Esophagus | ESCC | 7.34e-09 | 3.59e-02 | 0.116 |
| 59339 | PLEKHA2 | P11T-E | Human | Esophagus | ESCC | 7.13e-03 | 2.13e-01 | 0.1426 |
| 59339 | PLEKHA2 | P12T-E | Human | Esophagus | ESCC | 1.94e-07 | 1.67e-02 | 0.1122 |
| 59339 | PLEKHA2 | P15T-E | Human | Esophagus | ESCC | 3.21e-02 | -1.03e-02 | 0.1149 |
| 59339 | PLEKHA2 | P16T-E | Human | Esophagus | ESCC | 1.87e-06 | 2.19e-02 | 0.1153 |
| 59339 | PLEKHA2 | P20T-E | Human | Esophagus | ESCC | 1.35e-03 | 8.20e-03 | 0.1124 |
| 59339 | PLEKHA2 | P21T-E | Human | Esophagus | ESCC | 2.24e-11 | 1.14e-01 | 0.1617 |
| 59339 | PLEKHA2 | P22T-E | Human | Esophagus | ESCC | 6.93e-10 | 8.61e-02 | 0.1236 |
| 59339 | PLEKHA2 | P23T-E | Human | Esophagus | ESCC | 5.89e-03 | 1.04e-01 | 0.108 |
| 59339 | PLEKHA2 | P24T-E | Human | Esophagus | ESCC | 4.02e-04 | 1.50e-02 | 0.1287 |
| 59339 | PLEKHA2 | P26T-E | Human | Esophagus | ESCC | 8.57e-12 | 5.83e-02 | 0.1276 |
| 59339 | PLEKHA2 | P27T-E | Human | Esophagus | ESCC | 1.45e-03 | 2.31e-02 | 0.1055 |
| Page: 1 2 3 4 |
| Tissue | Expression Dynamics | Abbreviation |
| Esophagus |  | ESCC: Esophageal squamous cell carcinoma |
| HGIN: High-grade intraepithelial neoplasias | ||
| LGIN: Low-grade intraepithelial neoplasias | ||
| Liver |  | HCC: Hepatocellular carcinoma |
| NAFLD: Non-alcoholic fatty liver disease | ||
| Oral Cavity | 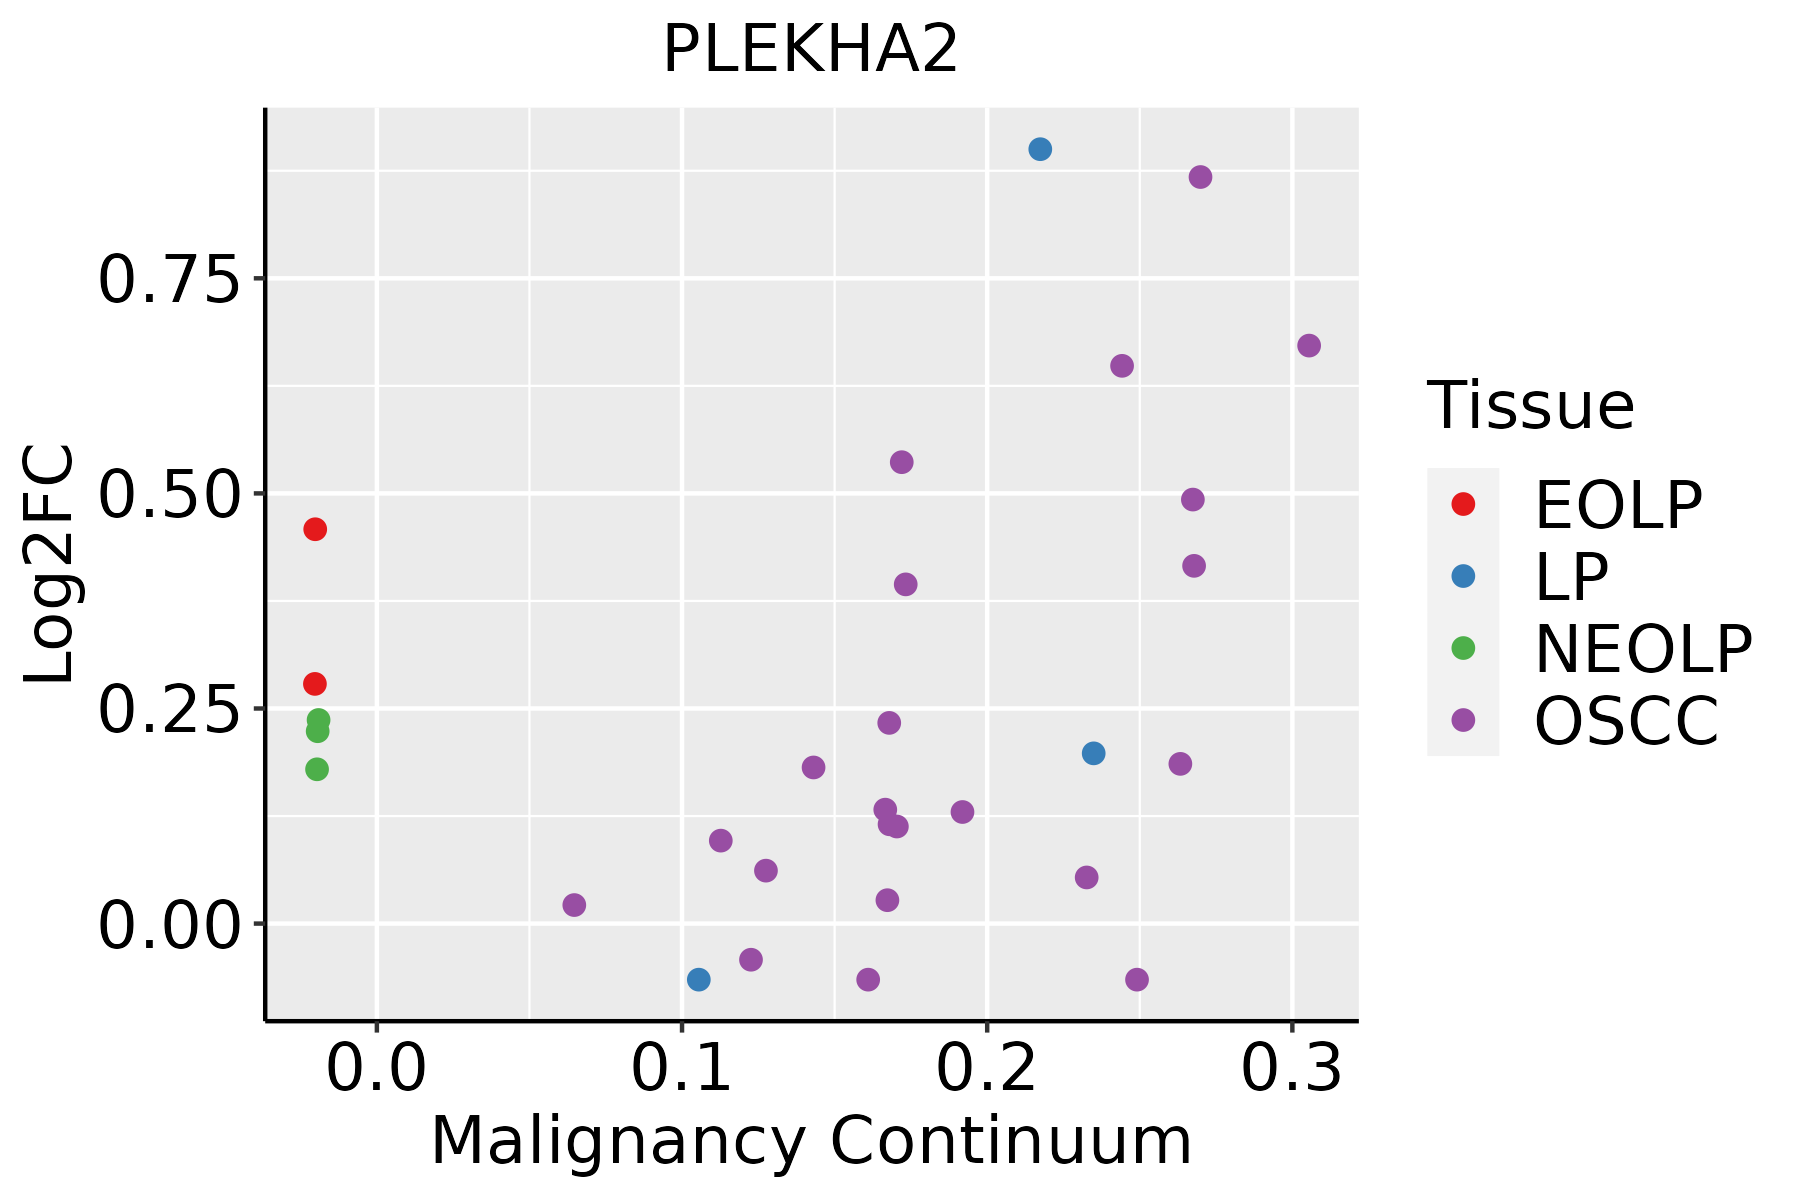 | EOLP: Erosive Oral lichen planus |
| LP: leukoplakia | ||
| NEOLP: Non-erosive oral lichen planus | ||
| OSCC: Oral squamous cell carcinoma | ||
| Thyroid |  | ATC: Anaplastic thyroid cancer |
| HT: Hashimoto's thyroiditis | ||
| PTC: Papillary thyroid cancer |
| ∗log2FC in expression of this searched gene in stem-like cells from each diseased tissue sample relative to stem-like cells in normal samples in each tissue plotted against the malignancy continuum. Samples are colored based on if they are from different disease stage. |
Top |
Malignant transformation related pathway analysis |
| Find out the enriched GO biological processes and KEGG pathways involved in transition from healthy to precancer to cancer |
| Tissue | Disease Stage | Enriched GO biological Processes |
| Colorectum | AD |  |
| Colorectum | SER |  |
| Colorectum | MSS |  |
| Colorectum | MSI-H |  |
| Colorectum | FAP |  |
| ∗Top 15 enriched GO BP terms are showed in the bar plot of each disease state in each tissue. Each row represents a significant GO biological process which is colored according to the -log10(p.adjust). |
| Page: 1 2 3 4 5 6 7 8 9 |
| GO ID | Tissue | Disease Stage | Description | Gene Ratio | Bg Ratio | pvalue | p.adjust | Count |
| GO:003158919 | Esophagus | ESCC | cell-substrate adhesion | 221/8552 | 363/18723 | 3.06e-09 | 6.62e-08 | 221 |
| GO:001081020 | Esophagus | ESCC | regulation of cell-substrate adhesion | 144/8552 | 221/18723 | 3.55e-09 | 7.45e-08 | 144 |
| GO:004578527 | Esophagus | ESCC | positive regulation of cell adhesion | 255/8552 | 437/18723 | 5.07e-08 | 9.11e-07 | 255 |
| GO:001081126 | Esophagus | ESCC | positive regulation of cell-substrate adhesion | 84/8552 | 123/18723 | 3.18e-07 | 4.50e-06 | 84 |
| GO:000195217 | Esophagus | ESCC | regulation of cell-matrix adhesion | 85/8552 | 128/18723 | 1.70e-06 | 2.02e-05 | 85 |
| GO:000716018 | Esophagus | ESCC | cell-matrix adhesion | 141/8552 | 233/18723 | 3.33e-06 | 3.71e-05 | 141 |
| GO:000195418 | Esophagus | ESCC | positive regulation of cell-matrix adhesion | 40/8552 | 58/18723 | 2.83e-04 | 1.71e-03 | 40 |
| GO:001081022 | Liver | HCC | regulation of cell-substrate adhesion | 123/7958 | 221/18723 | 5.15e-05 | 4.90e-04 | 123 |
| GO:003158922 | Liver | HCC | cell-substrate adhesion | 188/7958 | 363/18723 | 2.00e-04 | 1.55e-03 | 188 |
| GO:000195221 | Liver | HCC | regulation of cell-matrix adhesion | 74/7958 | 128/18723 | 3.34e-04 | 2.34e-03 | 74 |
| GO:001081122 | Liver | HCC | positive regulation of cell-substrate adhesion | 70/7958 | 123/18723 | 8.74e-04 | 5.18e-03 | 70 |
| GO:000716021 | Liver | HCC | cell-matrix adhesion | 123/7958 | 233/18723 | 9.34e-04 | 5.47e-03 | 123 |
| GO:000195421 | Liver | HCC | positive regulation of cell-matrix adhesion | 36/7958 | 58/18723 | 2.07e-03 | 1.04e-02 | 36 |
| GO:004578512 | Liver | HCC | positive regulation of cell adhesion | 215/7958 | 437/18723 | 2.53e-03 | 1.22e-02 | 215 |
| GO:003158917 | Oral cavity | OSCC | cell-substrate adhesion | 193/7305 | 363/18723 | 2.48e-08 | 4.82e-07 | 193 |
| GO:001081019 | Oral cavity | OSCC | regulation of cell-substrate adhesion | 126/7305 | 221/18723 | 4.02e-08 | 7.55e-07 | 126 |
| GO:004578520 | Oral cavity | OSCC | positive regulation of cell adhesion | 225/7305 | 437/18723 | 6.06e-08 | 1.09e-06 | 225 |
| GO:000195215 | Oral cavity | OSCC | regulation of cell-matrix adhesion | 78/7305 | 128/18723 | 4.05e-07 | 6.02e-06 | 78 |
| GO:000716016 | Oral cavity | OSCC | cell-matrix adhesion | 125/7305 | 233/18723 | 3.76e-06 | 4.45e-05 | 125 |
| GO:001081120 | Oral cavity | OSCC | positive regulation of cell-substrate adhesion | 71/7305 | 123/18723 | 1.96e-05 | 1.87e-04 | 71 |
| Page: 1 2 3 |
| Pathway ID | Tissue | Disease Stage | Description | Gene Ratio | Bg Ratio | pvalue | p.adjust | qvalue | Count |
| Page: 1 |
Top |
Cell-cell communication analysis |
| Identification of potential cell-cell interactions between two cell types and their ligand-receptor pairs for different disease states |
| Ligand | Receptor | LRpair | Pathway | Tissue | Disease Stage |
| Page: 1 |
Top |
Single-cell gene regulatory network inference analysis |
| Find out the significant the regulons (TFs) and the target genes of each regulon across cell types for different disease states |
| TF | Cell Type | Tissue | Disease Stage | Target Gene | RSS | Regulon Activity |
| ∗The dot plots of a searched regulon are shown for all cell subpopulations in each disease state of each tissue based on the regulon specific score inferred using pySCENIC and by calculating the average expression. |
| Page: 1 |
Top |
Somatic mutation of malignant transformation related genes |
| Annotation of somatic variants for genes involved in malignant transformation |
| Hugo Symbol | Variant Class | Variant Classification | dbSNP RS | HGVSc | HGVSp | HGVSp Short | SWISSPROT | BIOTYPE | SIFT | PolyPhen | Tumor Sample Barcode | Tissue | Histology | Sex | Age | Stage | Therapy Types | Drugs | Outcome |
| PLEKHA2 | SNV | Missense_Mutation | rs757735976 | c.280N>A | p.Gln94Lys | p.Q94K | protein_coding | deleterious(0.03) | probably_damaging(0.97) | TCGA-C8-A273-01 | Breast | breast invasive carcinoma | Female | <65 | I/II | Hormone Therapy | tamoxiphen | SD | |
| PLEKHA2 | SNV | Missense_Mutation | rs757735976 | c.280N>A | p.Gln94Lys | p.Q94K | protein_coding | deleterious(0.03) | probably_damaging(0.97) | TCGA-D8-A1Y3-01 | Breast | breast invasive carcinoma | Female | <65 | III/IV | Chemotherapy | doxorubicine+cyclophosphamide | SD | |
| PLEKHA2 | SNV | Missense_Mutation | novel | c.303N>A | p.Met101Ile | p.M101I | protein_coding | deleterious(0) | benign(0.003) | TCGA-E2-A2P5-01 | Breast | breast invasive carcinoma | Female | >=65 | III/IV | Hormone Therapy | arimidex | PD | |
| PLEKHA2 | insertion | Frame_Shift_Ins | novel | c.523_524insC | p.His176ProfsTer26 | p.H176Pfs*26 | protein_coding | TCGA-A2-A04V-01 | Breast | breast invasive carcinoma | Female | <65 | I/II | Chemotherapy | cytoxan | PD | |||
| PLEKHA2 | insertion | Frame_Shift_Ins | novel | c.149_150insCACTTTTTTTTTTTTTTTT | p.Met51ThrfsTer53 | p.M51Tfs*53 | protein_coding | TCGA-AR-A0TY-01 | Breast | breast invasive carcinoma | Female | <65 | I/II | Unspecific | Paclitaxel | PD | |||
| PLEKHA2 | insertion | Frame_Shift_Ins | novel | c.151_152insGAGATAGGGTCTTGCTGTGTTG | p.Met51ArgfsTer54 | p.M51Rfs*54 | protein_coding | TCGA-AR-A0TY-01 | Breast | breast invasive carcinoma | Female | <65 | I/II | Unspecific | Paclitaxel | PD | |||
| PLEKHA2 | SNV | Missense_Mutation | rs201962945 | c.490N>A | p.Gly164Ser | p.G164S | protein_coding | tolerated(0.11) | benign(0.116) | TCGA-A6-2682-01 | Colorectum | colon adenocarcinoma | Male | >=65 | III/IV | Chemotherapy | 5 | PD | |
| PLEKHA2 | SNV | Missense_Mutation | novel | c.1162G>A | p.Ala388Thr | p.A388T | protein_coding | tolerated(0.62) | benign(0) | TCGA-AA-A022-01 | Colorectum | colon adenocarcinoma | Female | >=65 | I/II | Unknown | Unknown | SD | |
| PLEKHA2 | SNV | Missense_Mutation | novel | c.44N>T | p.Asp15Val | p.D15V | protein_coding | deleterious(0) | probably_damaging(1) | TCGA-AD-6964-01 | Colorectum | colon adenocarcinoma | Male | <65 | III/IV | Chemotherapy | folfox | PD | |
| PLEKHA2 | SNV | Missense_Mutation | novel | c.883N>A | p.Ala295Thr | p.A295T | protein_coding | deleterious(0.03) | benign(0.012) | TCGA-AD-A5EJ-01 | Colorectum | colon adenocarcinoma | Female | >=65 | I/II | Unknown | Unknown | SD |
| Page: 1 2 3 4 |
Top |
Related drugs of malignant transformation related genes |
| Identification of chemicals and drugs interact with genes involved in malignant transfromation |
| (DGIdb 4.0) |
| Entrez ID | Symbol | Category | Interaction Types | Drug Claim Name | Drug Name | PMIDs |
| Page: 1 |

Copyright 2023-Present -The University of Texas Health Science Center at Houston |