Schematic overview of the cellular and molecular mechanisms involved in the cancer progression, including the proposed cellular and molecular mechanisms in cancer cells trajectory. AT1: alveolar type 1 cells; AT2: alveolar type 2 cells; AAH: atypical adenomatous hyperplasia; AIS: adenocarcinoma in situ; MIA: minimally invasive adenocarcinoma; IA: invasive adenocarcinoma; EMT: epithelial-mesenchymal transition

Home

Download

Statistics

Help

Contact

Center for Computational Systems Medicine
leaf

Gene summary

leaf

Malignant transformation analysis

leaf

Malignant transformation related pathway analysis

leaf

Cell-cell communication analysis

leaf

Single-cell gene regulatory network inference analysis

leaf

Somatic mutation of malignant transformation related genes

leaf

Related drugs of malignant transformation related genes

Gene: PLEC

Gene summary for PLEC

check button Gene summary.

Gene informationSpeciesHuman
Gene symbol

PLEC

Gene ID

5339

Gene nameplectin
Gene AliasEBS1
Cytomap8q24.3
Gene Typeprotein-coding
GO ID

GO:0000902

UniProtAcc

Q15149


Top

Malignant transformation analysis

check button Identification of the aberrant gene expression in precancerous and cancerous lesions by comparing the gene expression of stem-like cells in diseased tissues with normal stem cells
check button Malignant transformation involving gene list.
Entrez IDSymbolReplicatesSpeciesOrganTissueAdj P-valueLog2FCMalignancy
5339PLECHTA11_3410_2000001011HumanColorectumAD2.08e-041.89e-010.0155
5339PLECHTA11_2487_2000001011HumanColorectumSER1.71e-291.45e+00-0.1808
5339PLECHTA11_1938_2000001011HumanColorectumAD3.33e-106.94e-01-0.0811
5339PLECHTA11_78_2000001011HumanColorectumAD4.24e-033.71e-01-0.1088
5339PLECHTA11_347_2000001011HumanColorectumAD5.76e-226.54e-01-0.1954
5339PLECHTA11_411_2000001011HumanColorectumSER2.24e-081.69e+00-0.2602
5339PLECHTA11_2112_2000001011HumanColorectumSER1.17e-061.25e+00-0.2196
5339PLECHTA11_3361_2000001011HumanColorectumAD1.56e-097.41e-01-0.1207
5339PLECHTA11_696_2000001011HumanColorectumAD3.82e-136.87e-01-0.1464
5339PLECHTA11_866_2000001011HumanColorectumAD1.92e-053.40e-01-0.1001
5339PLECHTA11_1391_2000001011HumanColorectumAD1.86e-096.64e-01-0.059
5339PLECHTA11_5212_2000001011HumanColorectumAD2.26e-024.57e-01-0.2061
5339PLECHTA11_8622_2000001021HumanColorectumSER3.41e-024.13e-010.0528
5339PLECHTA11_10623_2000001011HumanColorectumAD1.76e-026.26e-01-0.0177
5339PLECHTA11_7696_3000711011HumanColorectumAD7.02e-104.81e-010.0674
5339PLECHTA11_7469_2000001011HumanColorectumAD6.23e-066.30e-01-0.0124
5339PLECHTA11_99999971662_82457HumanColorectumMSS1.36e-157.26e-010.3859
5339PLECHTA11_99999974143_84620HumanColorectumMSS8.10e-104.77e-010.3005
5339PLECA015-C-203HumanColorectumFAP5.95e-041.32e-01-0.1294
5339PLECA015-C-104HumanColorectumFAP9.51e-051.01e-01-0.1899
Page: 1 2 3 4 5 6 7 8 9 10 

check button Transcriptomic changes along malignancy continuum.
TissueExpression DynamicsAbbreviation
Colorectum (GSE201348)The image shows the transcriptomic changes along malignancy continuum.log2FC in expression of this searched gene in stem-like cells from each diseased tissue sample relative to stem-like cells in normal samples in each tissue plotted against the malignancy continuum. Samples are colored based on if they are from different disease stage.
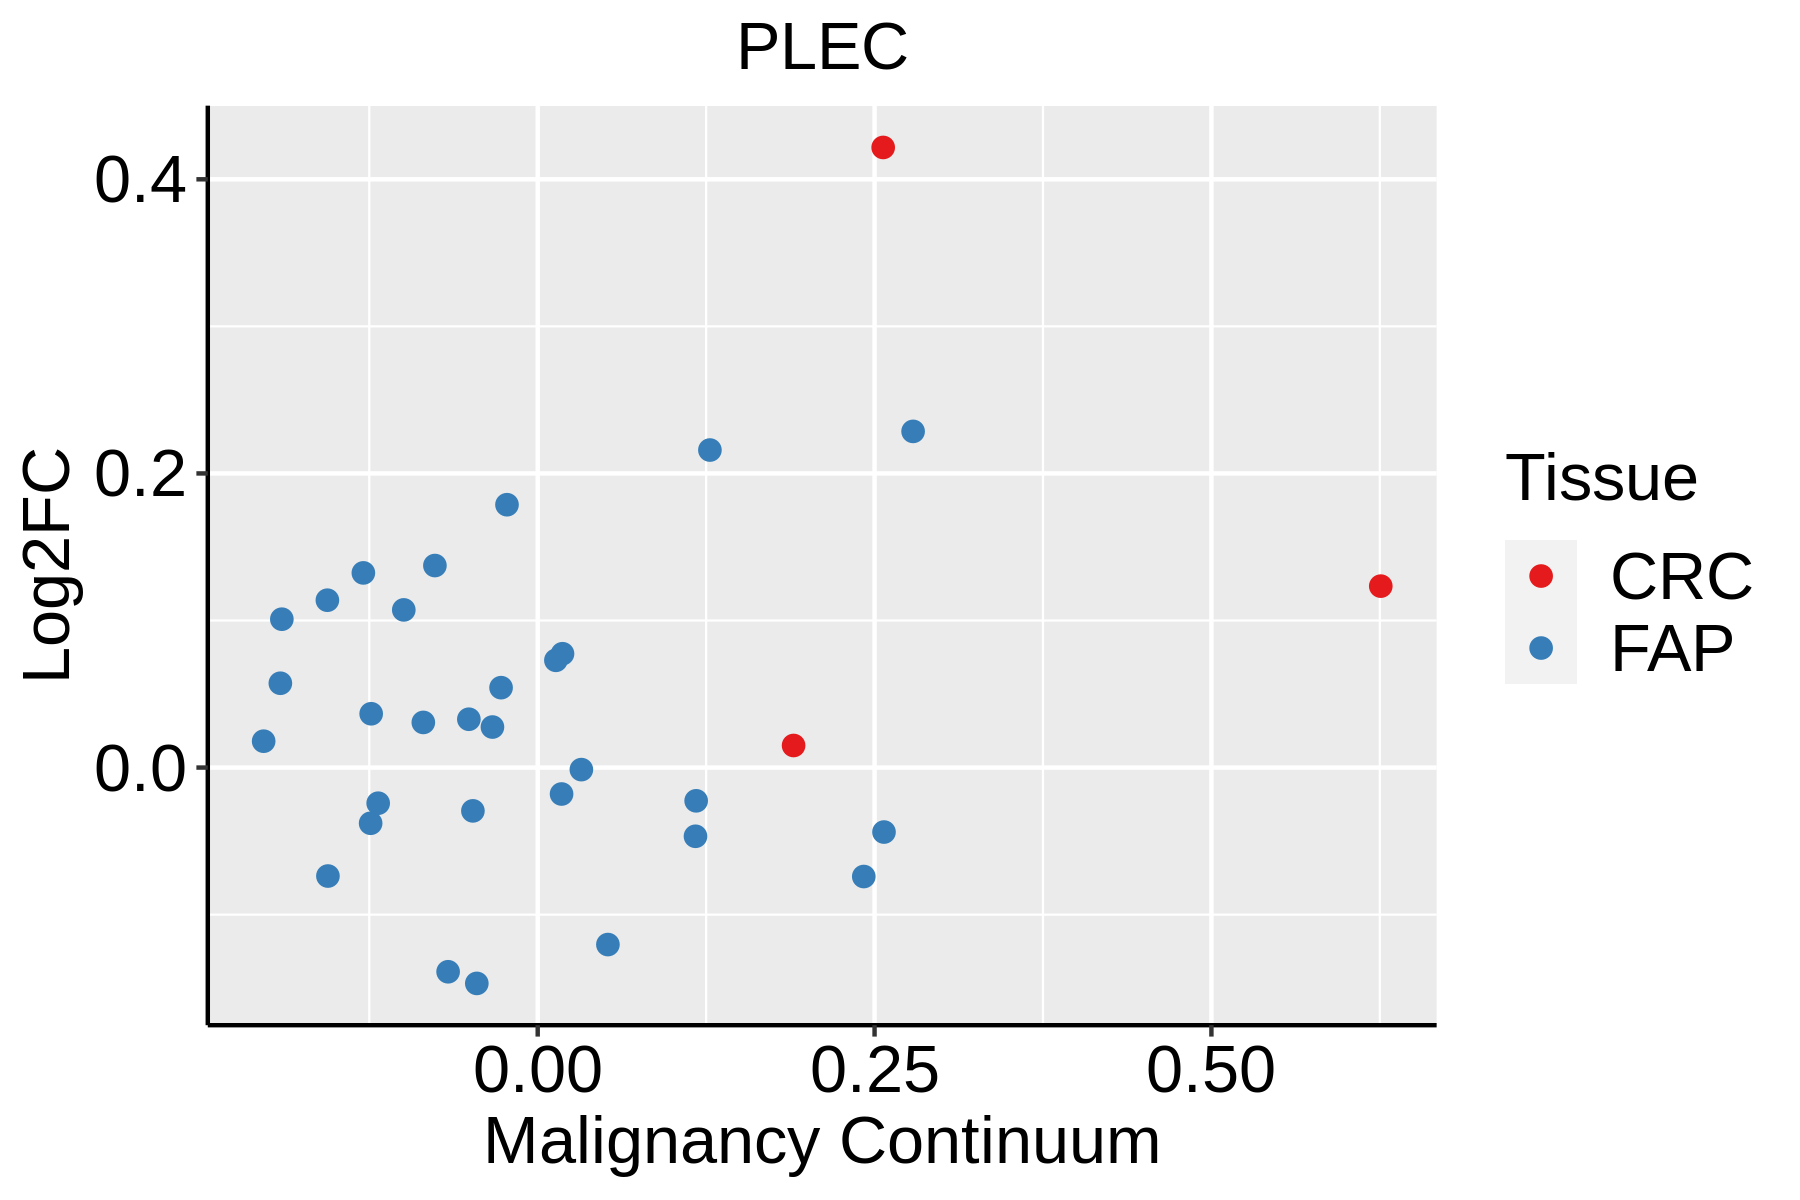
FAP: Familial adenomatous polyposis
CRC: Colorectal cancer
Colorectum (HTA11)The image shows the transcriptomic changes along malignancy continuum.log2FC in expression of this searched gene in stem-like cells from each diseased tissue sample relative to stem-like cells in normal samples in each tissue plotted against the malignancy continuum. Samples are colored based on if they are from different disease stage.AD: Adenomas
SER: Sessile serrated lesions
MSI-H: Microsatellite-high colorectal cancer
MSS: Microsatellite stable colorectal cancer
EsophagusThe image shows the transcriptomic changes along malignancy continuum.log2FC in expression of this searched gene in stem-like cells from each diseased tissue sample relative to stem-like cells in normal samples in each tissue plotted against the malignancy continuum. Samples are colored based on if they are from different disease stage.
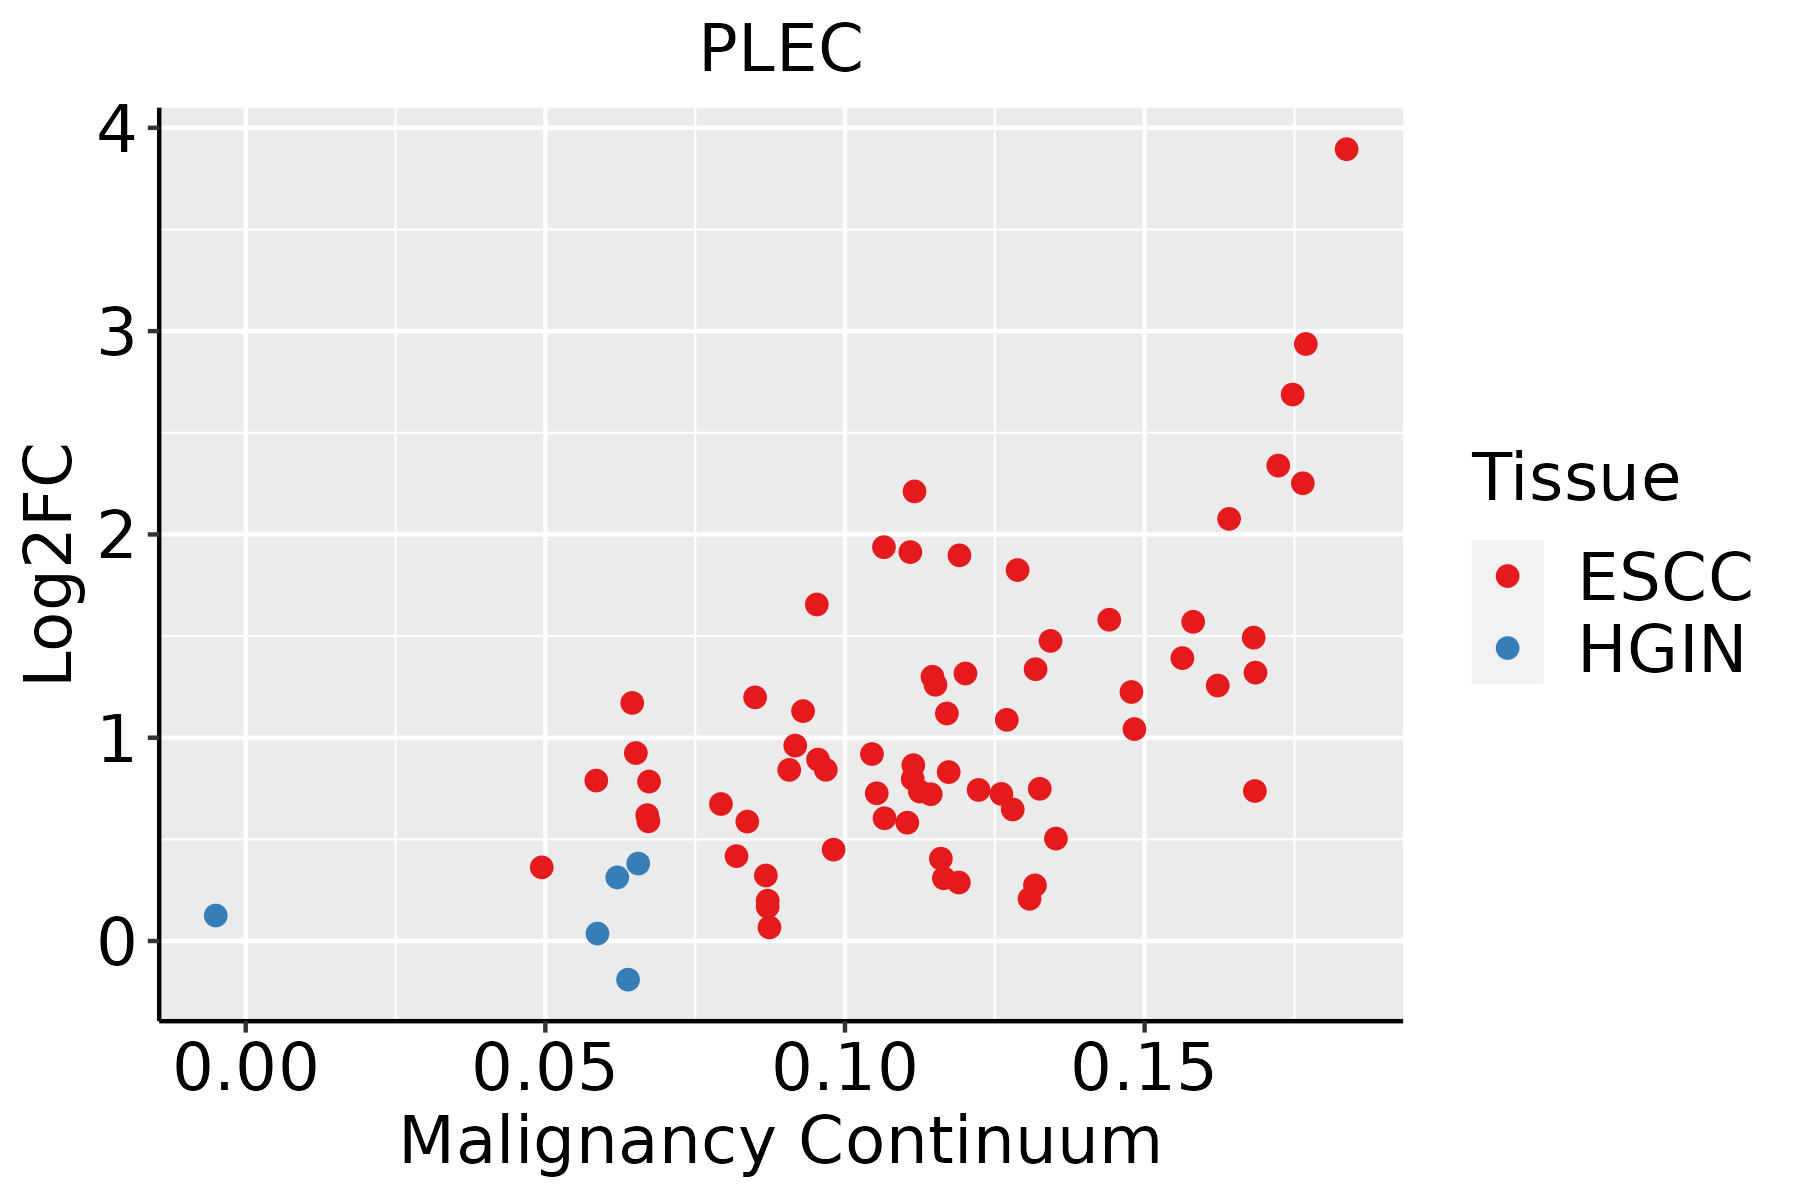
ESCC: Esophageal squamous cell carcinoma
HGIN: High-grade intraepithelial neoplasias
LGIN: Low-grade intraepithelial neoplasias
GCThe image shows the transcriptomic changes along malignancy continuum.log2FC in expression of this searched gene in stem-like cells from each diseased tissue sample relative to stem-like cells in normal samples in each tissue plotted against the malignancy continuum. Samples are colored based on if they are from different disease stage.
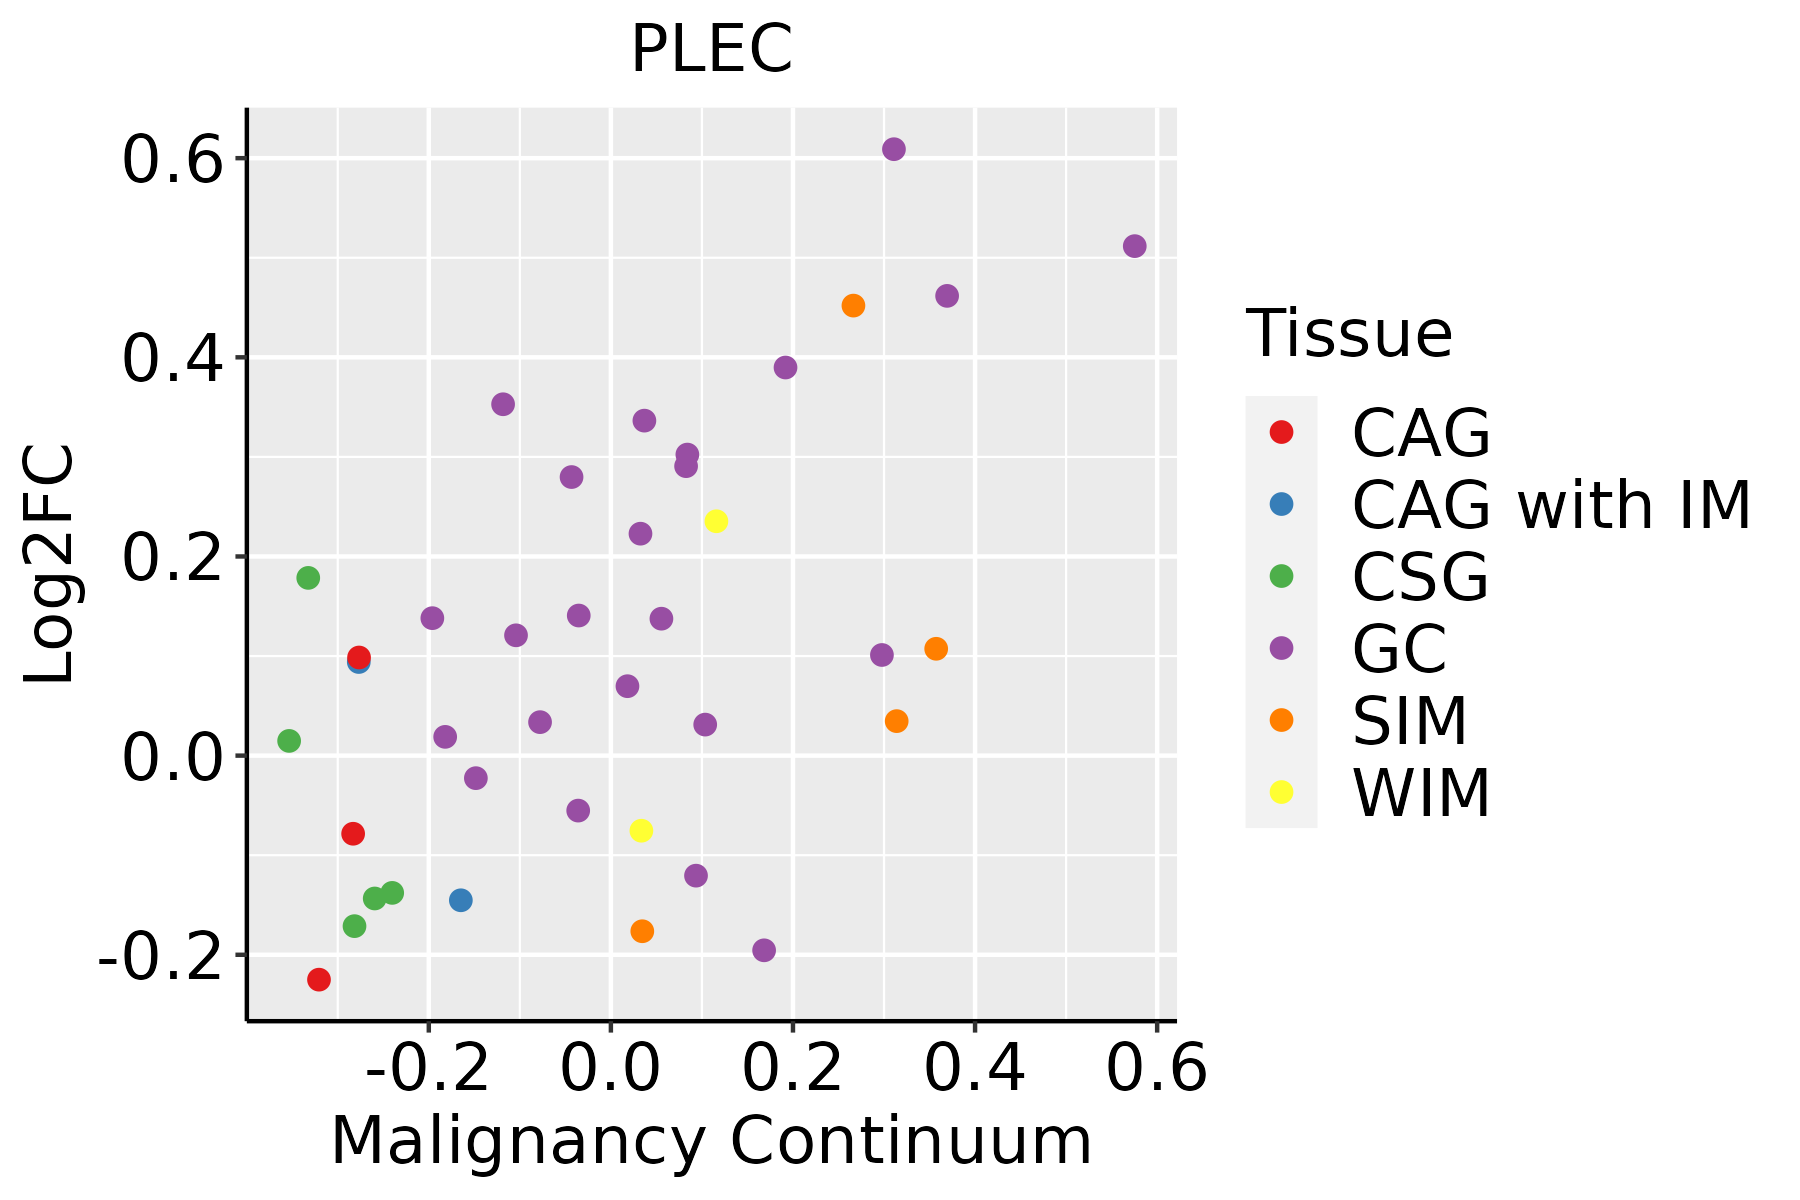
CAG: Chronic atrophic gastritis
CAG with IM: Chronic atrophic gastritis with intestinal metaplasia
CSG: Chronic superficial gastritis
GC: Gastric cancer
SIM: Severe intestinal metaplasia
WIM: Wild intestinal metaplasia
LiverThe image shows the transcriptomic changes along malignancy continuum.log2FC in expression of this searched gene in stem-like cells from each diseased tissue sample relative to stem-like cells in normal samples in each tissue plotted against the malignancy continuum. Samples are colored based on if they are from different disease stage.HCC: Hepatocellular carcinoma
NAFLD: Non-alcoholic fatty liver disease
Oral CavityThe image shows the transcriptomic changes along malignancy continuum.log2FC in expression of this searched gene in stem-like cells from each diseased tissue sample relative to stem-like cells in normal samples in each tissue plotted against the malignancy continuum. Samples are colored based on if they are from different disease stage.
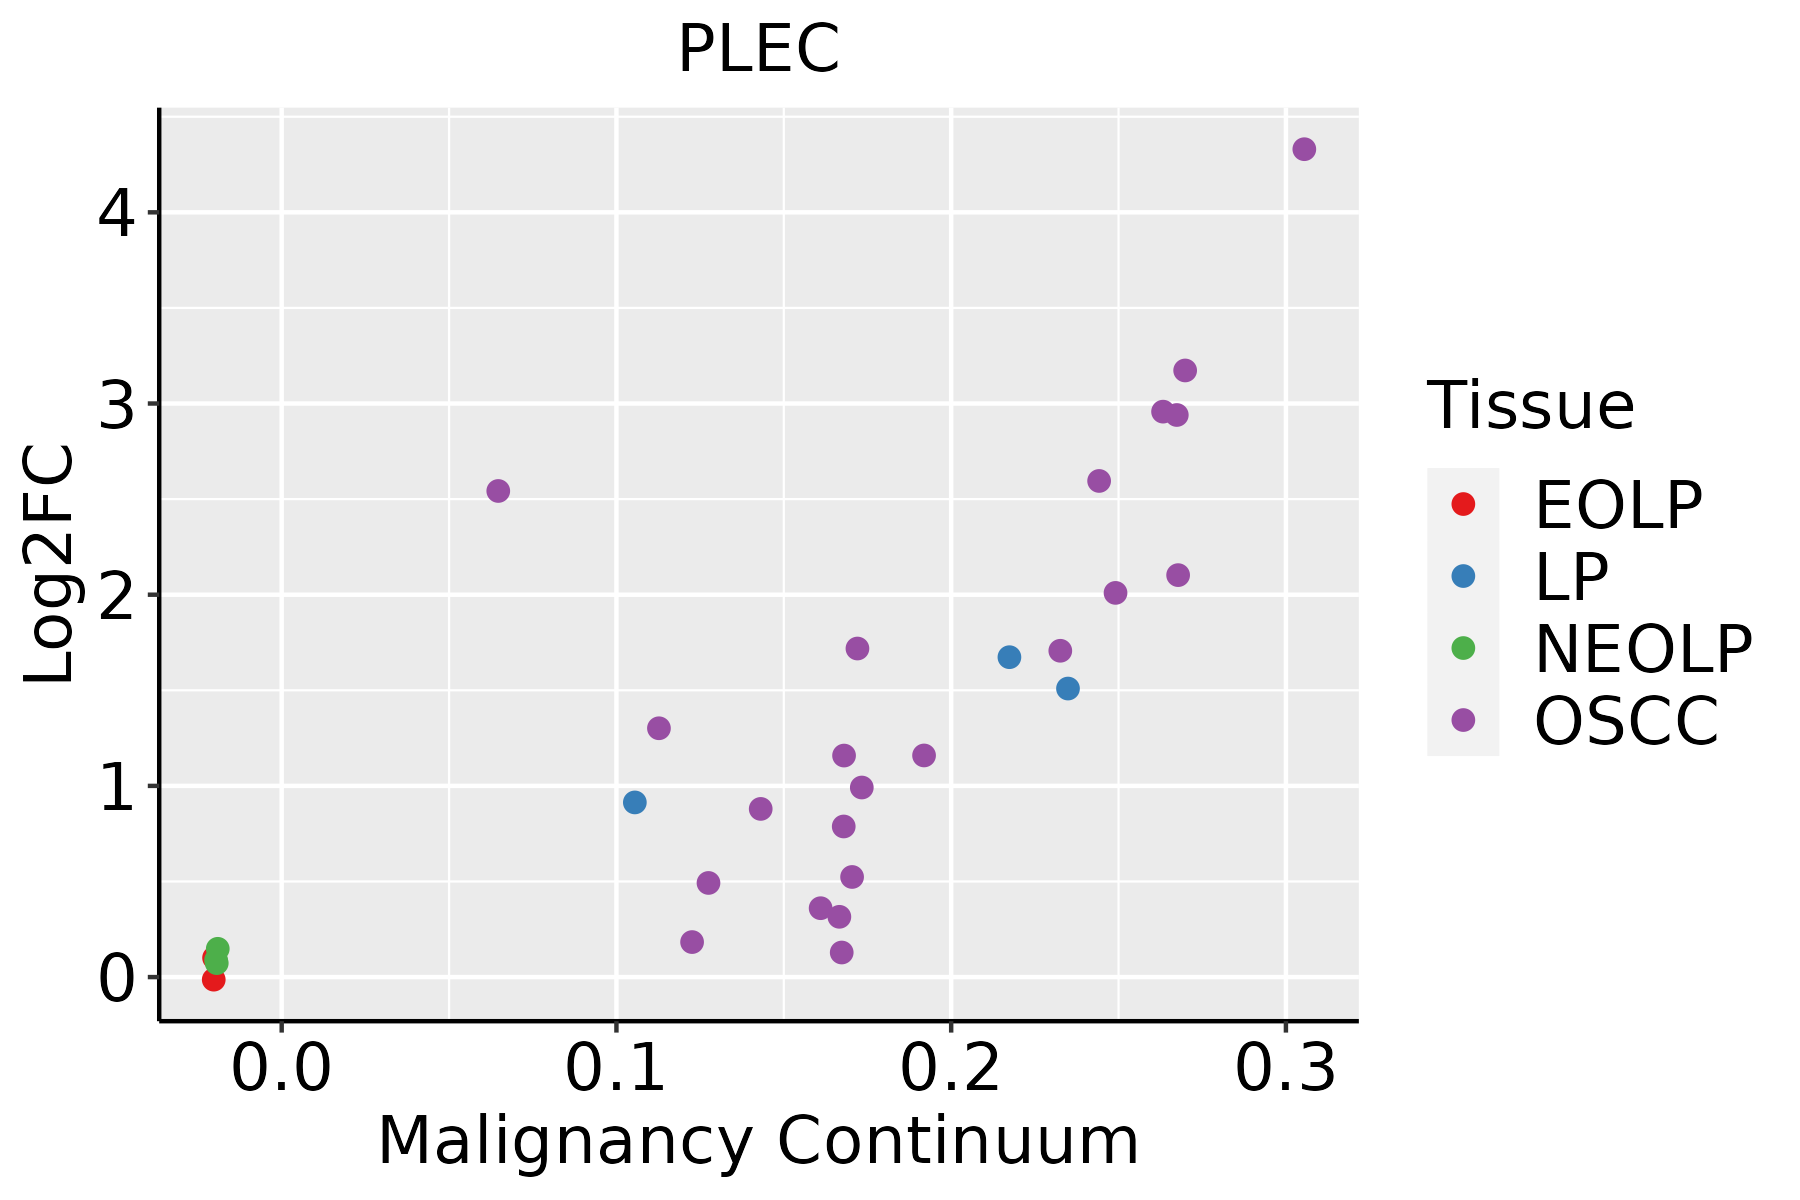
EOLP: Erosive Oral lichen planus
LP: leukoplakia
NEOLP: Non-erosive oral lichen planus
OSCC: Oral squamous cell carcinoma
ProstateThe image shows the transcriptomic changes along malignancy continuum.log2FC in expression of this searched gene in stem-like cells from each diseased tissue sample relative to stem-like cells in normal samples in each tissue plotted against the malignancy continuum. Samples are colored based on if they are from different disease stage.BPH: Benign Prostatic Hyperplasia
SkinThe image shows the transcriptomic changes along malignancy continuum.log2FC in expression of this searched gene in stem-like cells from each diseased tissue sample relative to stem-like cells in normal samples in each tissue plotted against the malignancy continuum. Samples are colored based on if they are from different disease stage.AK: Actinic keratosis
cSCC: Cutaneous squamous cell carcinoma
SCCIS:squamous cell carcinoma in situ
ThyroidThe image shows the transcriptomic changes along malignancy continuum.log2FC in expression of this searched gene in stem-like cells from each diseased tissue sample relative to stem-like cells in normal samples in each tissue plotted against the malignancy continuum. Samples are colored based on if they are from different disease stage.
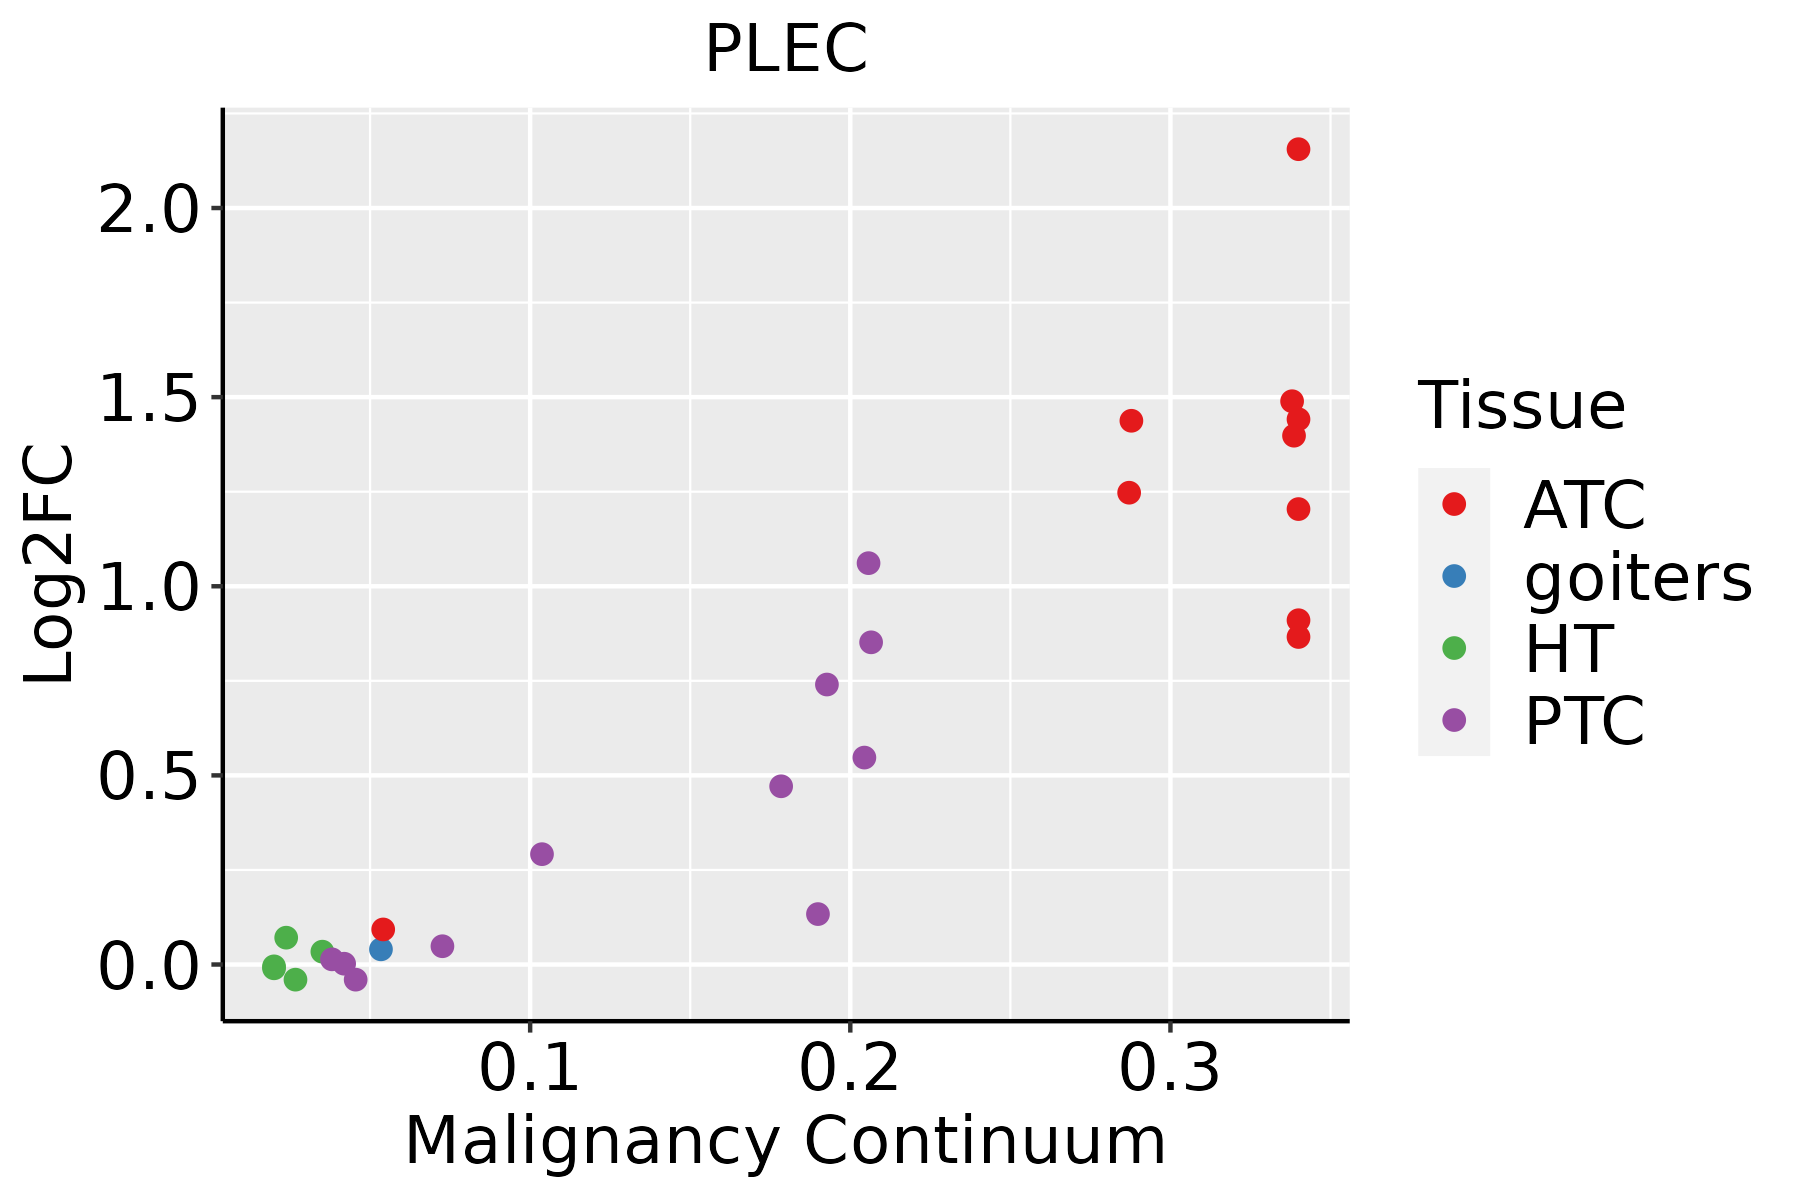
ATC: Anaplastic thyroid cancer
HT: Hashimoto's thyroiditis
PTC: Papillary thyroid cancer
∗log2FC in expression of this searched gene in stem-like cells from each diseased tissue sample relative to stem-like cells in normal samples in each tissue plotted against the malignancy continuum. Samples are colored based on if they are from different disease stage.

Top

Malignant transformation related pathway analysis

check buttonFind out the enriched GO biological processes and KEGG pathways involved in transition from healthy to precancer to cancer
check button Figure of enriched GO biological processes.
TissueDisease StageEnriched GO biological Processes
ColorectumADGO analysis - Figure of enriched GO biological processes: Top 15 enriched GO BP terms are showed in the bar plot of each disease state in each tissue. Each row represents a significant GO biological process which is colored according to the -log10(p.adjust).
ColorectumSERGO analysis - Figure of enriched GO biological processes: Top 15 enriched GO BP terms are showed in the bar plot of each disease state in each tissue. Each row represents a significant GO biological process which is colored according to the -log10(p.adjust).
ColorectumMSSGO analysis - Figure of enriched GO biological processes: Top 15 enriched GO BP terms are showed in the bar plot of each disease state in each tissue. Each row represents a significant GO biological process which is colored according to the -log10(p.adjust).
ColorectumMSI-HGO analysis - Figure of enriched GO biological processes: Top 15 enriched GO BP terms are showed in the bar plot of each disease state in each tissue. Each row represents a significant GO biological process which is colored according to the -log10(p.adjust).
ColorectumFAPGO analysis - Figure of enriched GO biological processes: Top 15 enriched GO BP terms are showed in the bar plot of each disease state in each tissue. Each row represents a significant GO biological process which is colored according to the -log10(p.adjust).
∗Top 15 enriched GO BP terms are showed in the bar plot of each disease state in each tissue. Each row represents a significant GO biological process which is colored according to the -log10(p.adjust).
Page: 1 2 3 4 5 6 7 8 9 

check button Enriched GO biological processes.
GO IDTissueDisease StageDescriptionGene RatioBg Ratiopvaluep.adjustCount
GO:0006091ColorectumADgeneration of precursor metabolites and energy209/3918490/187233.17e-286.61e-25209
GO:0045333ColorectumADcellular respiration119/3918230/187233.21e-254.02e-22119
GO:0015980ColorectumADenergy derivation by oxidation of organic compounds143/3918318/187232.78e-222.49e-19143
GO:0022900ColorectumADelectron transport chain89/3918175/187231.42e-188.91e-1689
GO:0007015ColorectumADactin filament organization167/3918442/187231.65e-167.94e-14167
GO:0022904ColorectumADrespiratory electron transport chain63/3918114/187238.23e-162.45e-1363
GO:0002064ColorectumADepithelial cell development89/3918220/187232.98e-113.52e-0989
GO:0045216ColorectumADcell-cell junction organization80/3918200/187235.57e-104.58e-0880
GO:0034329ColorectumADcell junction assembly136/3918420/187232.02e-081.15e-06136
GO:0150115ColorectumADcell-substrate junction organization44/3918101/187232.38e-079.81e-0644
GO:0062197ColorectumADcellular response to chemical stress109/3918337/187235.33e-071.95e-05109
GO:0007044ColorectumADcell-substrate junction assembly41/391895/187238.20e-072.85e-0541
GO:0042060ColorectumADwound healing128/3918422/187232.73e-067.89e-05128
GO:0031667ColorectumADresponse to nutrient levels138/3918474/187231.22e-052.68e-04138
GO:0010563ColorectumADnegative regulation of phosphorus metabolic process130/3918442/187231.26e-052.76e-04130
GO:0045936ColorectumADnegative regulation of phosphate metabolic process129/3918441/187231.81e-053.76e-04129
GO:0051348ColorectumADnegative regulation of transferase activity85/3918268/187232.07e-054.19e-0485
GO:0001667ColorectumADameboidal-type cell migration137/3918475/187232.17e-054.33e-04137
GO:0031532ColorectumADactin cytoskeleton reorganization41/3918107/187232.81e-055.28e-0441
GO:0120193ColorectumADtight junction organization33/391880/187232.93e-055.42e-0433
Page: 1 2 3 4 5 6 7 8 9 10 11 12 13 14 15 16 17 18 19 20 21 22 23 24 25 26 27 28 29 30 31 32 33 34 35 36 37 38 39 40 41 42 43 44 45 46 47 48 

check button Enriched KEGG pathways.
Pathway IDTissueDisease StageDescriptionGene RatioBg Ratiopvaluep.adjustqvalueCount
Page: 1 

Top

Cell-cell communication analysis

check buttonIdentification of potential cell-cell interactions between two cell types and their ligand-receptor pairs for different disease states
LigandReceptorLRpairPathwayTissueDisease Stage
Page: 1 

Top

Single-cell gene regulatory network inference analysis

check buttonFind out the significant the regulons (TFs) and the target genes of each regulon across cell types for different disease states
TFCell TypeTissueDisease StageTarget GeneRSSRegulon Activity
∗The dot plots of a searched regulon are shown for all cell subpopulations in each disease state of each tissue based on the regulon specific score inferred using pySCENIC and by calculating the average expression.
Page: 1 

Top

Somatic mutation of malignant transformation related genes

check buttonAnnotation of somatic variants for genes involved in malignant transformation
Hugo SymbolVariant ClassVariant ClassificationdbSNP RSHGVScHGVSpHGVSp ShortSWISSPROTBIOTYPESIFTPolyPhenTumor Sample BarcodeTissueHistologySexAgeStageTherapy TypesDrugsOutcome
PLECSNVMissense_Mutationc.4341N>Cp.Glu1447Aspp.E1447DQ15149protein_codingtolerated(1)benign(0)TCGA-A2-A04W-01Breastbreast invasive carcinomaFemale<65I/IIChemotherapycytoxanSD
PLECSNVMissense_Mutationc.10135N>Gp.Pro3379Alap.P3379AQ15149protein_codingtolerated(0.06)benign(0.006)TCGA-A2-A0T0-01Breastbreast invasive carcinomaFemale<65I/IIChemotherapytaxotereSD
PLECSNVMissense_Mutationc.8535G>Cp.Glu2845Aspp.E2845DQ15149protein_codingdeleterious(0.02)benign(0.026)TCGA-A7-A13D-01Breastbreast invasive carcinomaFemale<65I/IIChemotherapycytoxanSD
PLECSNVMissense_Mutationrs368982802c.10961N>Tp.Thr3654Metp.T3654MQ15149protein_codingdeleterious(0)probably_damaging(0.926)TCGA-A8-A09Z-01Breastbreast invasive carcinomaFemale>=65I/IIUnknownUnknownSD
PLECSNVMissense_Mutationc.2672N>Gp.Ser891Cysp.S891CQ15149protein_codingdeleterious(0)benign(0.139)TCGA-AC-A23H-01Breastbreast invasive carcinomaFemale>=65I/IIUnknownUnknownPD
PLECSNVMissense_Mutationnovelc.8752N>Cp.Tyr2918Hisp.Y2918HQ15149protein_codingdeleterious(0.04)possibly_damaging(0.853)TCGA-AO-A128-01Breastbreast invasive carcinomaFemale<65I/IIChemotherapydoxorubicinSD
PLECSNVMissense_Mutationc.1230G>Tp.Arg410Serp.R410SQ15149protein_codingtolerated(0.72)benign(0.001)TCGA-BH-A18G-01Breastbreast invasive carcinomaFemale>=65I/IIUnknownUnknownSD
PLECSNVMissense_Mutationrs782166303c.172C>Tp.Arg58Trpp.R58WQ15149protein_codingdeleterious_low_confidence(0)probably_damaging(1)TCGA-BH-A18G-01Breastbreast invasive carcinomaFemale>=65I/IIUnknownUnknownSD
PLECSNVMissense_Mutationnovelc.934N>Gp.Tyr312Aspp.Y312DQ15149protein_codingdeleterious(0)possibly_damaging(0.615)TCGA-BH-A1FC-01Breastbreast invasive carcinomaFemale>=65I/IIUnknownUnknownSD
PLECSNVMissense_Mutationnovelc.4297G>Tp.Val1433Leup.V1433LQ15149protein_codingtolerated(0.81)benign(0)TCGA-BH-A42T-01Breastbreast invasive carcinomaFemale>=65I/IIUnknownUnknownSD
Page: 1 2 3 4 5 6 7 8 9 10 11 12 13 14 15 16 17 18 19 20 21 22 23 24 25 26 27 28 29 30 31 32 33 34 35 36 37 38 39 40 41 42 43 44 45 46 47 

Top

Related drugs of malignant transformation related genes

check buttonIdentification of chemicals and drugs interact with genes involved in malignant transfromation
(DGIdb 4.0)
Entrez IDSymbolCategoryInteraction TypesDrug Claim NameDrug NamePMIDs
Page: 1