
|
|||||
|
 | |
| |
| |
| |
| |
| |
|
Gene: PLD6 |
Gene summary for PLD6 |
| Gene information | Species | Human | Gene symbol | PLD6 | Gene ID | 201164 |
| Gene name | phospholipase D family member 6 | |
| Gene Alias | ZUC | |
| Cytomap | 17p11.2 | |
| Gene Type | protein-coding | GO ID | GO:0000003 | UniProtAcc | Q8N2A8 |
Top |
Malignant transformation analysis |
| Identification of the aberrant gene expression in precancerous and cancerous lesions by comparing the gene expression of stem-like cells in diseased tissues with normal stem cells |
| Entrez ID | Symbol | Replicates | Species | Organ | Tissue | Adj P-value | Log2FC | Malignancy |
| 201164 | PLD6 | LZE4T | Human | Esophagus | ESCC | 6.35e-03 | 1.06e-01 | 0.0811 |
| 201164 | PLD6 | LZE24T | Human | Esophagus | ESCC | 1.09e-06 | 1.77e-01 | 0.0596 |
| 201164 | PLD6 | LZE21T | Human | Esophagus | ESCC | 8.02e-04 | 2.39e-01 | 0.0655 |
| 201164 | PLD6 | P2T-E | Human | Esophagus | ESCC | 8.40e-04 | 9.38e-02 | 0.1177 |
| 201164 | PLD6 | P4T-E | Human | Esophagus | ESCC | 1.22e-08 | 2.33e-01 | 0.1323 |
| 201164 | PLD6 | P9T-E | Human | Esophagus | ESCC | 2.41e-06 | 1.61e-01 | 0.1131 |
| 201164 | PLD6 | P10T-E | Human | Esophagus | ESCC | 1.23e-20 | 3.83e-01 | 0.116 |
| 201164 | PLD6 | P12T-E | Human | Esophagus | ESCC | 3.95e-30 | 5.22e-01 | 0.1122 |
| 201164 | PLD6 | P15T-E | Human | Esophagus | ESCC | 8.45e-06 | 1.43e-01 | 0.1149 |
| 201164 | PLD6 | P16T-E | Human | Esophagus | ESCC | 7.98e-13 | 2.81e-01 | 0.1153 |
| 201164 | PLD6 | P20T-E | Human | Esophagus | ESCC | 8.62e-07 | 1.51e-01 | 0.1124 |
| 201164 | PLD6 | P21T-E | Human | Esophagus | ESCC | 1.47e-14 | 2.71e-01 | 0.1617 |
| 201164 | PLD6 | P22T-E | Human | Esophagus | ESCC | 3.97e-04 | 1.09e-01 | 0.1236 |
| 201164 | PLD6 | P23T-E | Human | Esophagus | ESCC | 9.87e-03 | 9.65e-02 | 0.108 |
| 201164 | PLD6 | P26T-E | Human | Esophagus | ESCC | 4.30e-10 | 1.78e-01 | 0.1276 |
| 201164 | PLD6 | P27T-E | Human | Esophagus | ESCC | 1.97e-10 | 1.92e-01 | 0.1055 |
| 201164 | PLD6 | P28T-E | Human | Esophagus | ESCC | 1.88e-04 | 1.21e-01 | 0.1149 |
| 201164 | PLD6 | P30T-E | Human | Esophagus | ESCC | 2.89e-13 | 4.01e-01 | 0.137 |
| 201164 | PLD6 | P31T-E | Human | Esophagus | ESCC | 6.56e-15 | 2.83e-01 | 0.1251 |
| 201164 | PLD6 | P32T-E | Human | Esophagus | ESCC | 3.19e-23 | 5.43e-01 | 0.1666 |
| Page: 1 2 3 |
| Tissue | Expression Dynamics | Abbreviation |
| Esophagus | 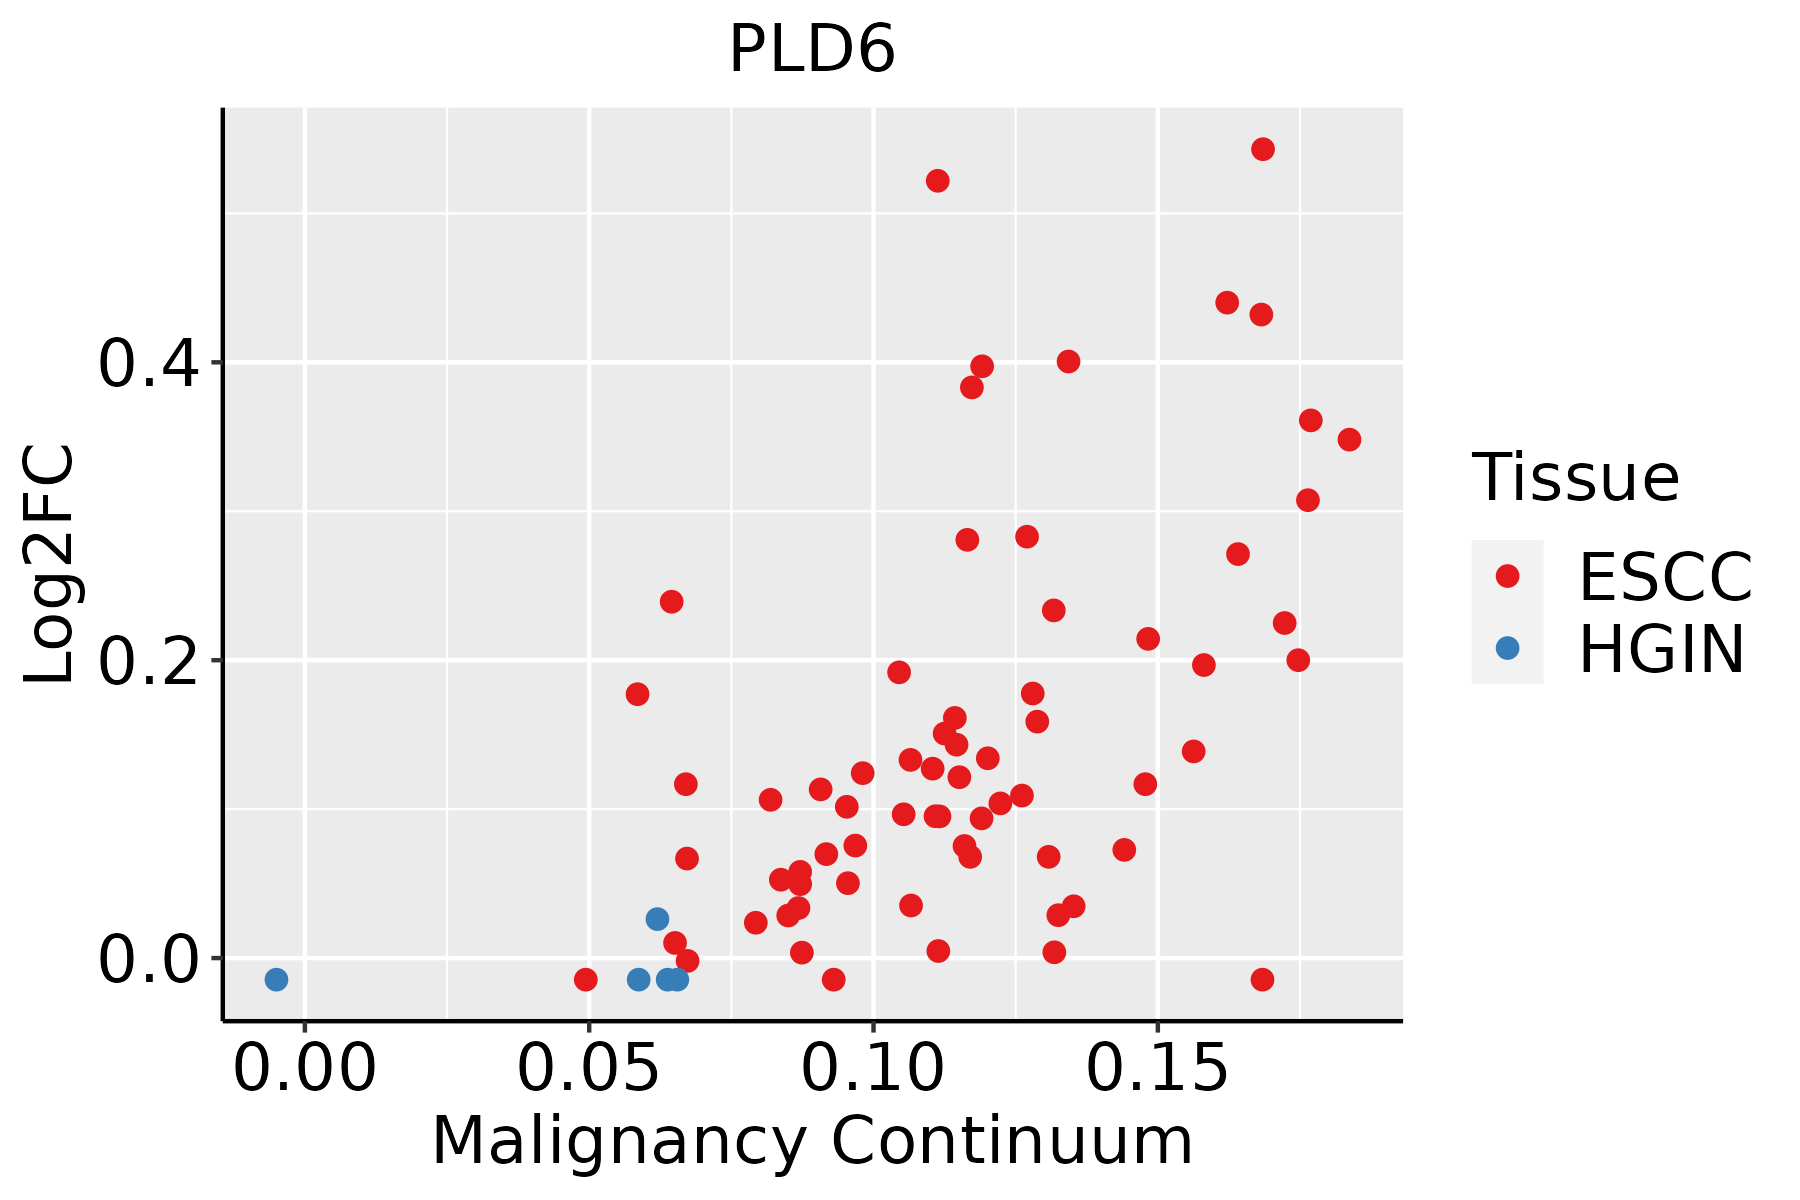 | ESCC: Esophageal squamous cell carcinoma |
| HGIN: High-grade intraepithelial neoplasias | ||
| LGIN: Low-grade intraepithelial neoplasias |
| ∗log2FC in expression of this searched gene in stem-like cells from each diseased tissue sample relative to stem-like cells in normal samples in each tissue plotted against the malignancy continuum. Samples are colored based on if they are from different disease stage. |
Top |
Malignant transformation related pathway analysis |
| Find out the enriched GO biological processes and KEGG pathways involved in transition from healthy to precancer to cancer |
| Tissue | Disease Stage | Enriched GO biological Processes |
| Colorectum | AD |  |
| Colorectum | SER |  |
| Colorectum | MSS |  |
| Colorectum | MSI-H |  |
| Colorectum | FAP |  |
| ∗Top 15 enriched GO BP terms are showed in the bar plot of each disease state in each tissue. Each row represents a significant GO biological process which is colored according to the -log10(p.adjust). |
| Page: 1 2 3 4 5 6 7 8 9 |
| GO ID | Tissue | Disease Stage | Description | Gene Ratio | Bg Ratio | pvalue | p.adjust | Count |
| GO:003466012 | Esophagus | ESCC | ncRNA metabolic process | 346/8552 | 485/18723 | 4.35e-31 | 2.51e-28 | 346 |
| GO:0010821110 | Esophagus | ESCC | regulation of mitochondrion organization | 107/8552 | 144/18723 | 2.31e-12 | 9.41e-11 | 107 |
| GO:00434143 | Esophagus | ESCC | macromolecule methylation | 199/8552 | 316/18723 | 3.44e-10 | 9.57e-09 | 199 |
| GO:00322592 | Esophagus | ESCC | methylation | 222/8552 | 364/18723 | 2.26e-09 | 5.09e-08 | 222 |
| GO:001082215 | Esophagus | ESCC | positive regulation of mitochondrion organization | 58/8552 | 74/18723 | 8.55e-09 | 1.73e-07 | 58 |
| GO:00903053 | Esophagus | ESCC | nucleic acid phosphodiester bond hydrolysis | 163/8552 | 261/18723 | 3.07e-08 | 5.73e-07 | 163 |
| GO:00482844 | Esophagus | ESCC | organelle fusion | 94/8552 | 141/18723 | 3.72e-07 | 5.16e-06 | 94 |
| GO:00080532 | Esophagus | ESCC | mitochondrial fusion | 20/8552 | 27/18723 | 2.61e-03 | 1.11e-02 | 20 |
| GO:00160427 | Esophagus | ESCC | lipid catabolic process | 168/8552 | 320/18723 | 7.97e-03 | 2.84e-02 | 168 |
| GO:0006304 | Esophagus | ESCC | DNA modification | 68/8552 | 120/18723 | 9.95e-03 | 3.42e-02 | 68 |
| Page: 1 |
| Pathway ID | Tissue | Disease Stage | Description | Gene Ratio | Bg Ratio | pvalue | p.adjust | qvalue | Count |
| Page: 1 |
Top |
Cell-cell communication analysis |
| Identification of potential cell-cell interactions between two cell types and their ligand-receptor pairs for different disease states |
| Ligand | Receptor | LRpair | Pathway | Tissue | Disease Stage |
| Page: 1 |
Top |
Single-cell gene regulatory network inference analysis |
| Find out the significant the regulons (TFs) and the target genes of each regulon across cell types for different disease states |
| TF | Cell Type | Tissue | Disease Stage | Target Gene | RSS | Regulon Activity |
| ∗The dot plots of a searched regulon are shown for all cell subpopulations in each disease state of each tissue based on the regulon specific score inferred using pySCENIC and by calculating the average expression. |
| Page: 1 |
Top |
Somatic mutation of malignant transformation related genes |
| Annotation of somatic variants for genes involved in malignant transformation |
| Hugo Symbol | Variant Class | Variant Classification | dbSNP RS | HGVSc | HGVSp | HGVSp Short | SWISSPROT | BIOTYPE | SIFT | PolyPhen | Tumor Sample Barcode | Tissue | Histology | Sex | Age | Stage | Therapy Types | Drugs | Outcome |
| PLD6 | SNV | Missense_Mutation | rs778989094 | c.655N>T | p.Pro219Ser | p.P219S | Q8N2A8 | protein_coding | deleterious(0.03) | benign(0.006) | TCGA-A2-A1FZ-01 | Breast | breast invasive carcinoma | Female | <65 | I/II | Unspecific | Arimidex | SD |
| PLD6 | SNV | Missense_Mutation | c.707N>A | p.Arg236Lys | p.R236K | Q8N2A8 | protein_coding | tolerated_low_confidence(0.35) | benign(0) | TCGA-E2-A1LG-01 | Breast | breast invasive carcinoma | Female | <65 | I/II | Chemotherapy | doxorubicin | SD | |
| PLD6 | SNV | Missense_Mutation | rs756356336 | c.745N>A | p.Glu249Lys | p.E249K | Q8N2A8 | protein_coding | tolerated_low_confidence(0.96) | benign(0.003) | TCGA-DS-A1OB-01 | Cervix | cervical & endocervical cancer | Female | <65 | I/II | Chemotherapy | carboplatin | PD |
| PLD6 | SNV | Missense_Mutation | rs756356336 | c.745G>A | p.Glu249Lys | p.E249K | Q8N2A8 | protein_coding | tolerated_low_confidence(0.96) | benign(0.003) | TCGA-MA-AA41-01 | Cervix | cervical & endocervical cancer | Female | <65 | I/II | Unknown | Unknown | SD |
| PLD6 | SNV | Missense_Mutation | novel | c.601G>C | p.Glu201Gln | p.E201Q | Q8N2A8 | protein_coding | tolerated(0.08) | possibly_damaging(0.573) | TCGA-MA-AA41-01 | Cervix | cervical & endocervical cancer | Female | <65 | I/II | Unknown | Unknown | SD |
| PLD6 | SNV | Missense_Mutation | novel | c.660N>T | p.Lys220Asn | p.K220N | Q8N2A8 | protein_coding | tolerated_low_confidence(0.06) | possibly_damaging(0.601) | TCGA-EI-6917-01 | Colorectum | rectum adenocarcinoma | Male | <65 | III/IV | Chemotherapy | 5fluorouracil+oxaciplatina+l-folinian | SD |
| PLD6 | SNV | Missense_Mutation | c.646N>C | p.Phe216Leu | p.F216L | Q8N2A8 | protein_coding | deleterious(0.01) | benign(0.018) | TCGA-AP-A05N-01 | Endometrium | uterine corpus endometrioid carcinoma | Female | <65 | I/II | Unknown | Unknown | SD | |
| PLD6 | SNV | Missense_Mutation | rs772007129 | c.733N>A | p.Gly245Ser | p.G245S | Q8N2A8 | protein_coding | tolerated_low_confidence(0.59) | benign(0) | TCGA-AX-A2HD-01 | Endometrium | uterine corpus endometrioid carcinoma | Female | >=65 | III/IV | Unknown | Unknown | SD |
| PLD6 | SNV | Missense_Mutation | novel | c.584N>G | p.Val195Gly | p.V195G | Q8N2A8 | protein_coding | deleterious(0) | possibly_damaging(0.667) | TCGA-AX-A2HJ-01 | Endometrium | uterine corpus endometrioid carcinoma | Female | <65 | I/II | Unknown | Unknown | SD |
| PLD6 | SNV | Missense_Mutation | novel | c.552G>T | p.Glu184Asp | p.E184D | Q8N2A8 | protein_coding | deleterious(0) | probably_damaging(0.968) | TCGA-B5-A3FA-01 | Endometrium | uterine corpus endometrioid carcinoma | Female | >=65 | I/II | Unknown | Unknown | SD |
| Page: 1 2 |
Top |
Related drugs of malignant transformation related genes |
| Identification of chemicals and drugs interact with genes involved in malignant transfromation |
| (DGIdb 4.0) |
| Entrez ID | Symbol | Category | Interaction Types | Drug Claim Name | Drug Name | PMIDs |
| Page: 1 |

Copyright 2023-Present -The University of Texas Health Science Center at Houston |