
|
|||||
|
 | |
| |
| |
| |
| |
| |
|
Gene: PLD5 |
Gene summary for PLD5 |
| Gene information | Species | Human | Gene symbol | PLD5 | Gene ID | 200150 |
| Gene name | phospholipase D family member 5 | |
| Gene Alias | PLDC | |
| Cytomap | 1q43 | |
| Gene Type | protein-coding | GO ID | GO:0005575 | UniProtAcc | Q8N7P1 |
Top |
Malignant transformation analysis |
| Identification of the aberrant gene expression in precancerous and cancerous lesions by comparing the gene expression of stem-like cells in diseased tissues with normal stem cells |
| Entrez ID | Symbol | Replicates | Species | Organ | Tissue | Adj P-value | Log2FC | Malignancy |
| 200150 | PLD5 | RNA-P23T2-P23T2-2 | Human | Lung | MIAC | 7.31e-03 | 7.57e-01 | -0.028 |
| 200150 | PLD5 | RNA-P23T2-P23T2-4 | Human | Lung | MIAC | 3.47e-02 | 7.53e-01 | -0.0272 |
| 200150 | PLD5 | RNA-P24T2-P24T2-2 | Human | Lung | IAC | 5.73e-08 | 1.35e+00 | 0.0057 |
| 200150 | PLD5 | RNA-P6T2-P6T2-1 | Human | Lung | IAC | 4.91e-11 | 4.48e-01 | -0.0166 |
| 200150 | PLD5 | RNA-P6T2-P6T2-2 | Human | Lung | IAC | 9.57e-10 | 3.93e-01 | -0.0132 |
| 200150 | PLD5 | RNA-P6T2-P6T2-3 | Human | Lung | IAC | 1.85e-09 | 3.80e-01 | -0.013 |
| 200150 | PLD5 | RNA-P6T2-P6T2-4 | Human | Lung | IAC | 2.42e-12 | 4.95e-01 | -0.0121 |
| 200150 | PLD5 | RNA-P7T1-P7T1-1 | Human | Lung | AIS | 1.36e-03 | 5.29e-01 | -0.0961 |
| 200150 | PLD5 | RNA-P7T1-P7T1-2 | Human | Lung | AIS | 8.94e-07 | 6.48e-01 | -0.0876 |
| 200150 | PLD5 | RNA-P7T1-P7T1-3 | Human | Lung | AIS | 5.60e-06 | 6.34e-01 | -0.0822 |
| 200150 | PLD5 | RNA-P7T1-P7T1-4 | Human | Lung | AIS | 1.58e-07 | 7.04e-01 | -0.0809 |
| Page: 1 |
| Tissue | Expression Dynamics | Abbreviation |
| Lung | 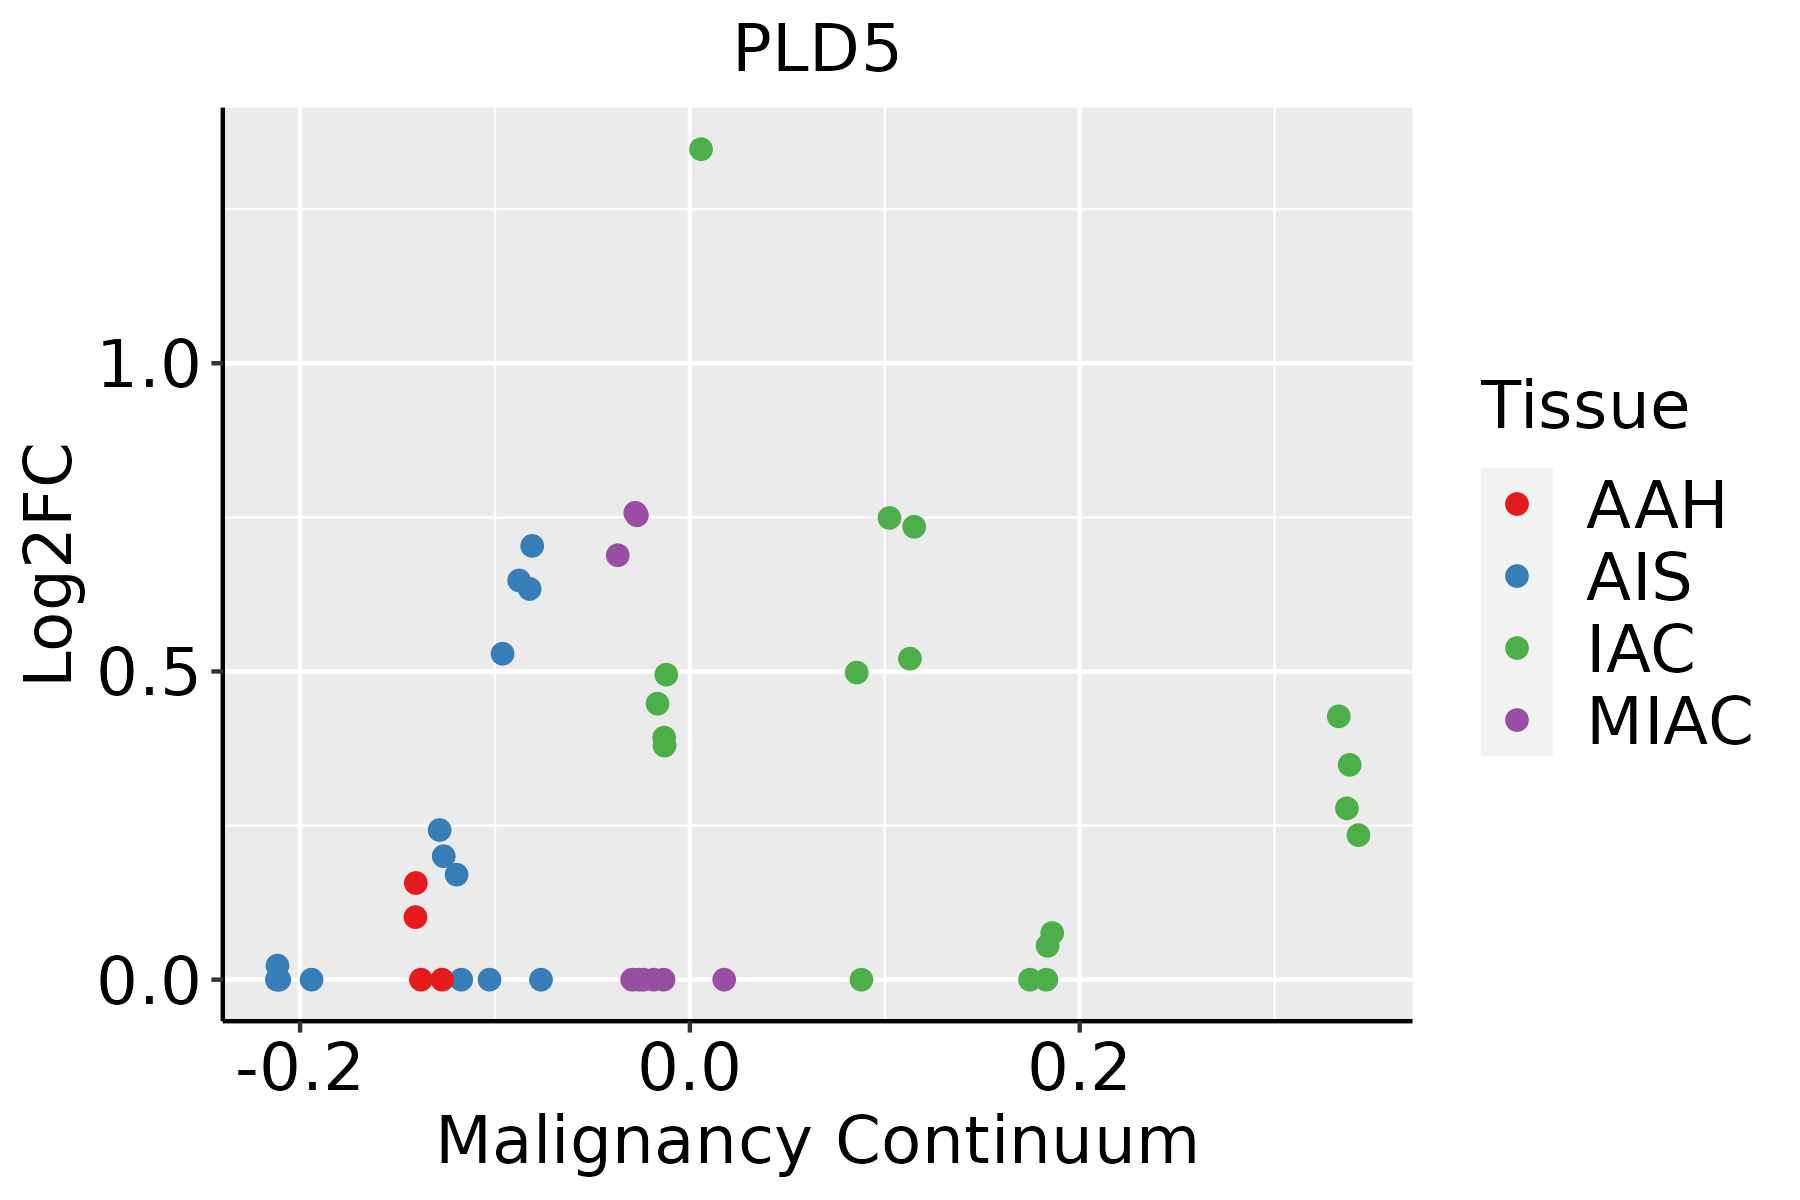 | AAH: Atypical adenomatous hyperplasia |
| AIS: Adenocarcinoma in situ | ||
| IAC: Invasive lung adenocarcinoma | ||
| MIA: Minimally invasive adenocarcinoma |
| ∗log2FC in expression of this searched gene in stem-like cells from each diseased tissue sample relative to stem-like cells in normal samples in each tissue plotted against the malignancy continuum. Samples are colored based on if they are from different disease stage. |
Top |
Malignant transformation related pathway analysis |
| Find out the enriched GO biological processes and KEGG pathways involved in transition from healthy to precancer to cancer |
| Tissue | Disease Stage | Enriched GO biological Processes |
| Colorectum | AD |  |
| Colorectum | SER |  |
| Colorectum | MSS |  |
| Colorectum | MSI-H |  |
| Colorectum | FAP |  |
| ∗Top 15 enriched GO BP terms are showed in the bar plot of each disease state in each tissue. Each row represents a significant GO biological process which is colored according to the -log10(p.adjust). |
| Page: 1 2 3 4 5 6 7 8 9 |
| GO ID | Tissue | Disease Stage | Description | Gene Ratio | Bg Ratio | pvalue | p.adjust | Count |
| Page: 1 |
| Pathway ID | Tissue | Disease Stage | Description | Gene Ratio | Bg Ratio | pvalue | p.adjust | qvalue | Count |
| Page: 1 |
Top |
Cell-cell communication analysis |
| Identification of potential cell-cell interactions between two cell types and their ligand-receptor pairs for different disease states |
| Ligand | Receptor | LRpair | Pathway | Tissue | Disease Stage |
| Page: 1 |
Top |
Single-cell gene regulatory network inference analysis |
| Find out the significant the regulons (TFs) and the target genes of each regulon across cell types for different disease states |
| TF | Cell Type | Tissue | Disease Stage | Target Gene | RSS | Regulon Activity |
| ∗The dot plots of a searched regulon are shown for all cell subpopulations in each disease state of each tissue based on the regulon specific score inferred using pySCENIC and by calculating the average expression. |
| Page: 1 |
Top |
Somatic mutation of malignant transformation related genes |
| Annotation of somatic variants for genes involved in malignant transformation |
| Hugo Symbol | Variant Class | Variant Classification | dbSNP RS | HGVSc | HGVSp | HGVSp Short | SWISSPROT | BIOTYPE | SIFT | PolyPhen | Tumor Sample Barcode | Tissue | Histology | Sex | Age | Stage | Therapy Types | Drugs | Outcome |
| PLD5 | SNV | Missense_Mutation | novel | c.57N>C | p.Gln19His | p.Q19H | Q8N7P1 | protein_coding | tolerated_low_confidence(0.3) | probably_damaging(0.948) | TCGA-5L-AAT1-01 | Breast | breast invasive carcinoma | Female | <65 | III/IV | Hormone Therapy | letrozol | SD |
| PLD5 | SNV | Missense_Mutation | c.472N>A | p.His158Asn | p.H158N | Q8N7P1 | protein_coding | tolerated(0.92) | benign(0.038) | TCGA-A2-A1FX-01 | Breast | breast invasive carcinoma | Female | <65 | III/IV | Chemotherapy | taxotere | SD | |
| PLD5 | SNV | Missense_Mutation | c.1421N>A | p.Ala474Glu | p.A474E | Q8N7P1 | protein_coding | tolerated(0.33) | benign(0.366) | TCGA-AN-A0XR-01 | Breast | breast invasive carcinoma | Female | <65 | III/IV | Unknown | Unknown | SD | |
| PLD5 | SNV | Missense_Mutation | c.664N>C | p.Ser222Pro | p.S222P | Q8N7P1 | protein_coding | tolerated(0.06) | possibly_damaging(0.889) | TCGA-AR-A24M-01 | Breast | breast invasive carcinoma | Female | <65 | III/IV | Hormone Therapy | tamoxiphen | SD | |
| PLD5 | SNV | Missense_Mutation | c.1027N>A | p.Ala343Thr | p.A343T | Q8N7P1 | protein_coding | deleterious(0) | possibly_damaging(0.635) | TCGA-BH-A0B5-01 | Breast | breast invasive carcinoma | Female | <65 | III/IV | Chemotherapy | adriamycin | CR | |
| PLD5 | SNV | Missense_Mutation | c.301N>A | p.Glu101Lys | p.E101K | Q8N7P1 | protein_coding | deleterious(0.01) | probably_damaging(0.98) | TCGA-D8-A1JA-01 | Breast | breast invasive carcinoma | Female | <65 | III/IV | Chemotherapy | adriamycin | PD | |
| PLD5 | SNV | Missense_Mutation | c.1542C>A | p.Phe514Leu | p.F514L | Q8N7P1 | protein_coding | tolerated_low_confidence(0.65) | benign(0) | TCGA-D8-A1Y3-01 | Breast | breast invasive carcinoma | Female | <65 | III/IV | Chemotherapy | doxorubicine+cyclophosphamide | SD | |
| PLD5 | SNV | Missense_Mutation | novel | c.665N>T | p.Ser222Phe | p.S222F | Q8N7P1 | protein_coding | deleterious(0.01) | possibly_damaging(0.84) | TCGA-OL-A5DA-01 | Breast | breast invasive carcinoma | Female | <65 | I/II | Unknown | Unknown | SD |
| PLD5 | SNV | Missense_Mutation | novel | c.1359N>G | p.Asn453Lys | p.N453K | Q8N7P1 | protein_coding | deleterious(0.02) | probably_damaging(0.986) | TCGA-C5-A1MH-01 | Cervix | cervical & endocervical cancer | Female | >=65 | III/IV | Chemotherapy | cisplatin | PD |
| PLD5 | SNV | Missense_Mutation | novel | c.874N>C | p.Asp292His | p.D292H | Q8N7P1 | protein_coding | deleterious(0.01) | possibly_damaging(0.77) | TCGA-C5-A1MH-01 | Cervix | cervical & endocervical cancer | Female | >=65 | III/IV | Chemotherapy | cisplatin | PD |
| Page: 1 2 3 4 5 6 7 8 9 10 11 |
Top |
Related drugs of malignant transformation related genes |
| Identification of chemicals and drugs interact with genes involved in malignant transfromation |
| (DGIdb 4.0) |
| Entrez ID | Symbol | Category | Interaction Types | Drug Claim Name | Drug Name | PMIDs |
| Page: 1 |

Copyright 2023-Present -The University of Texas Health Science Center at Houston |