| Tissue | Expression Dynamics | Abbreviation |
| Cervix | 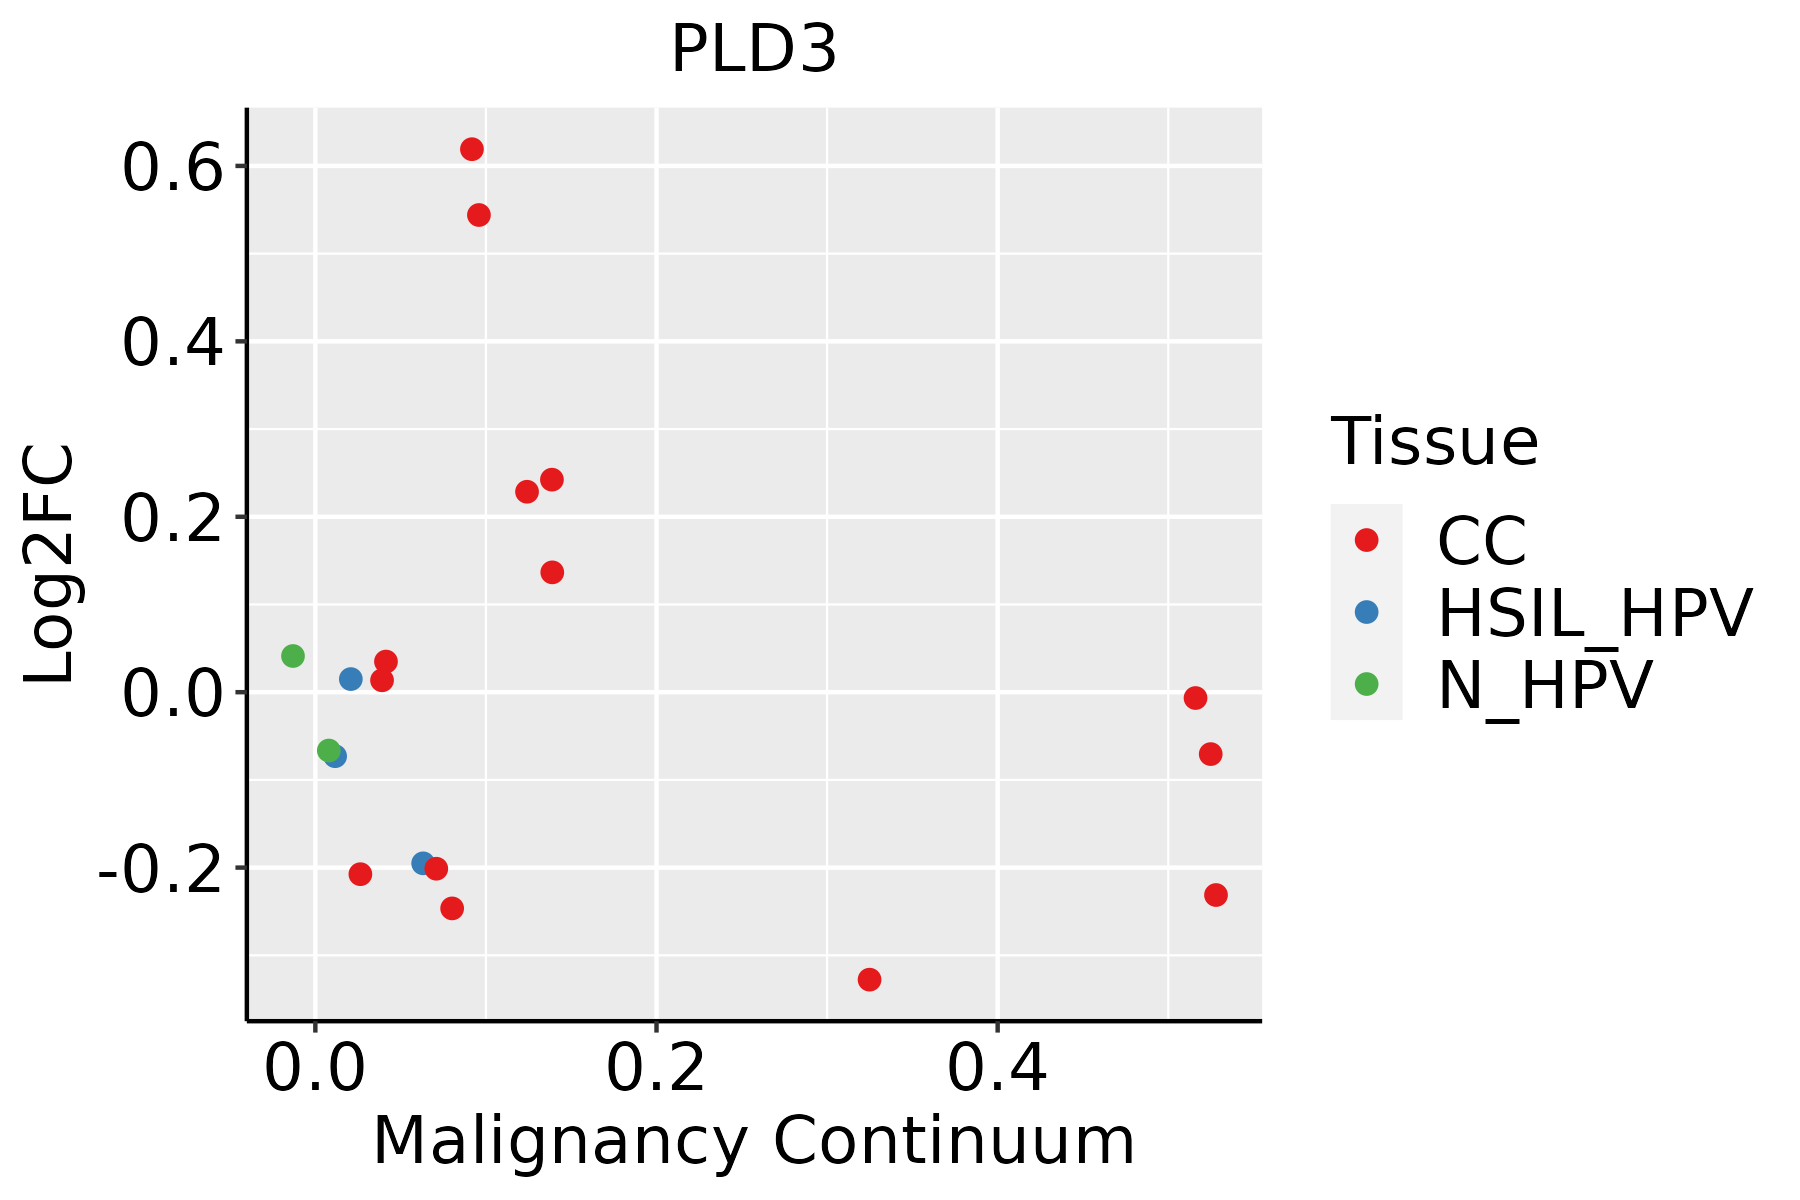 | CC: Cervix cancer |
| HSIL_HPV: HPV-infected high-grade squamous intraepithelial lesions |
| N_HPV: HPV-infected normal cervix |
| Endometrium | 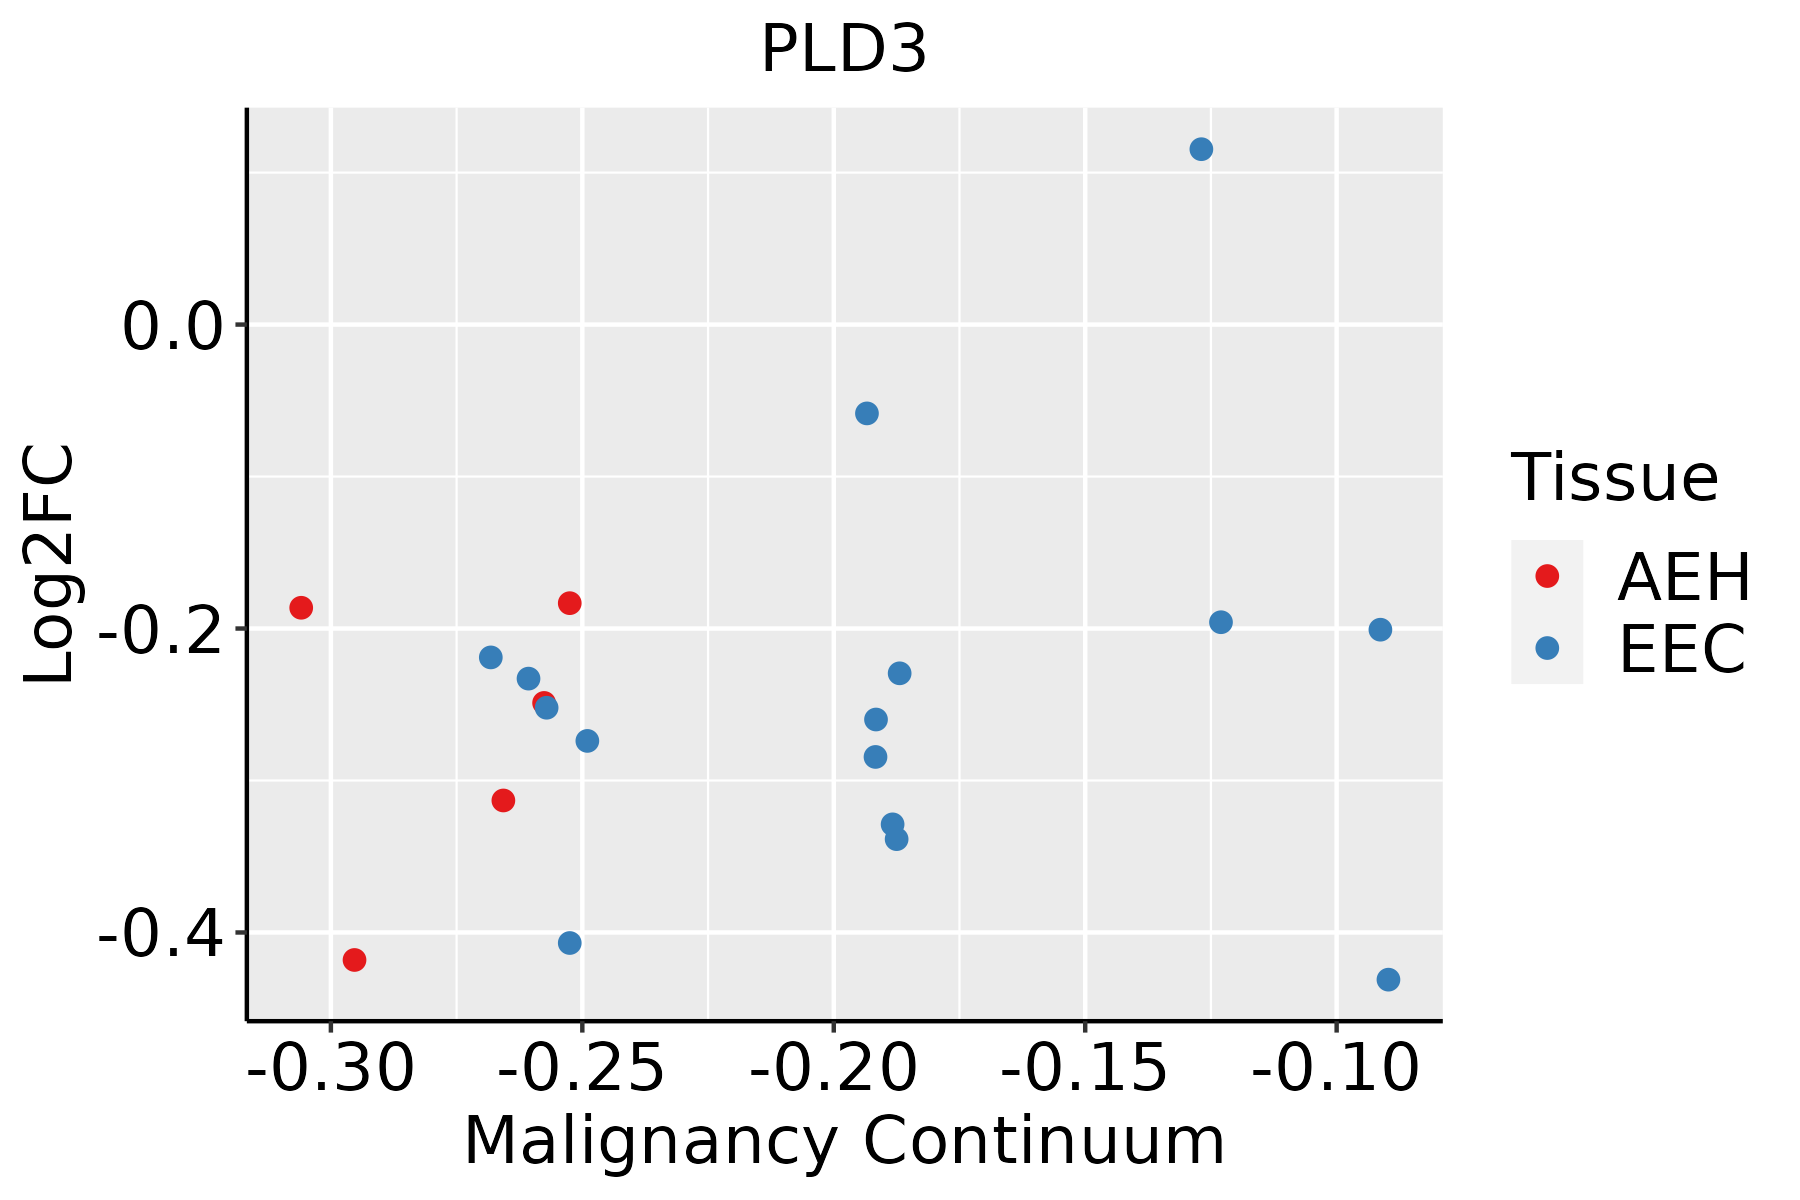 | AEH: Atypical endometrial hyperplasia |
| EEC: Endometrioid Cancer |
| Esophagus |  | ESCC: Esophageal squamous cell carcinoma |
| HGIN: High-grade intraepithelial neoplasias |
| LGIN: Low-grade intraepithelial neoplasias |
| Liver | 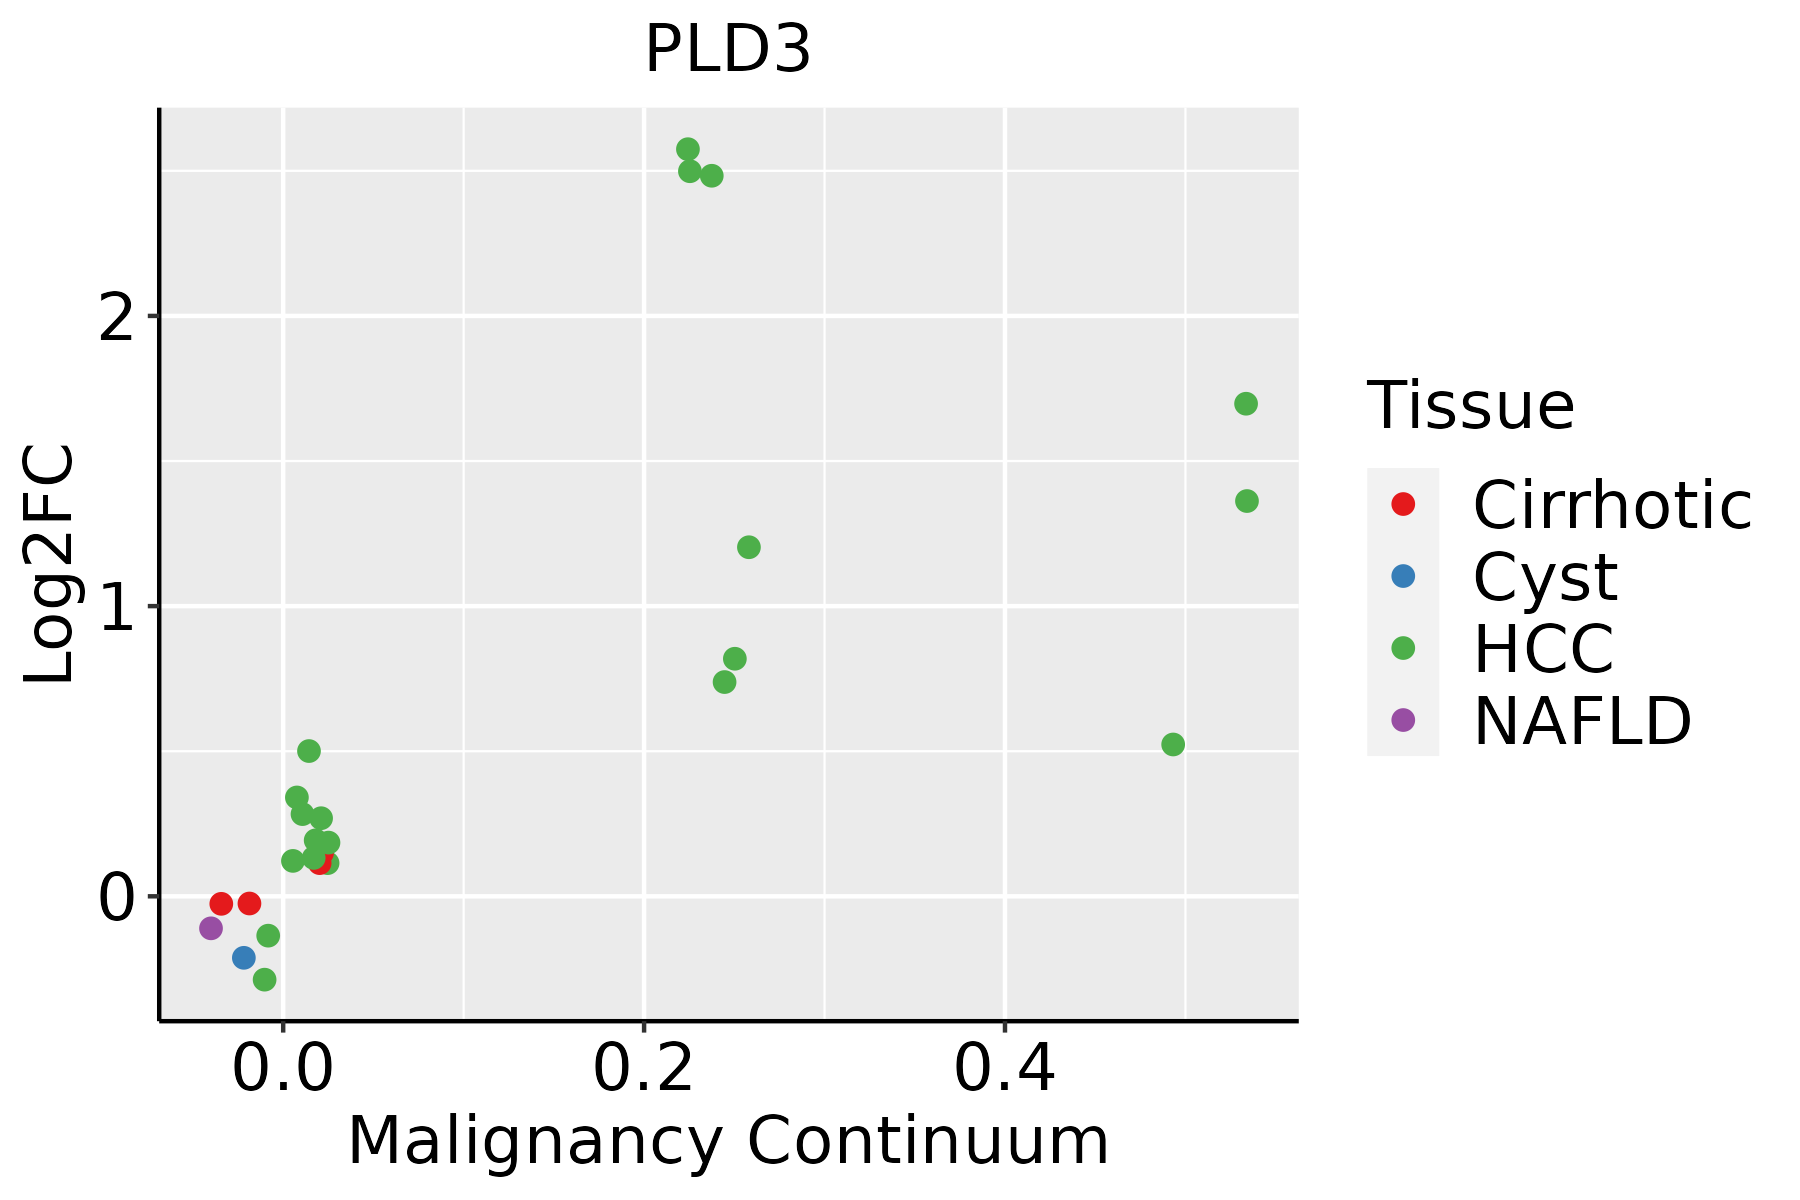 | HCC: Hepatocellular carcinoma |
| NAFLD: Non-alcoholic fatty liver disease |
| Lung | 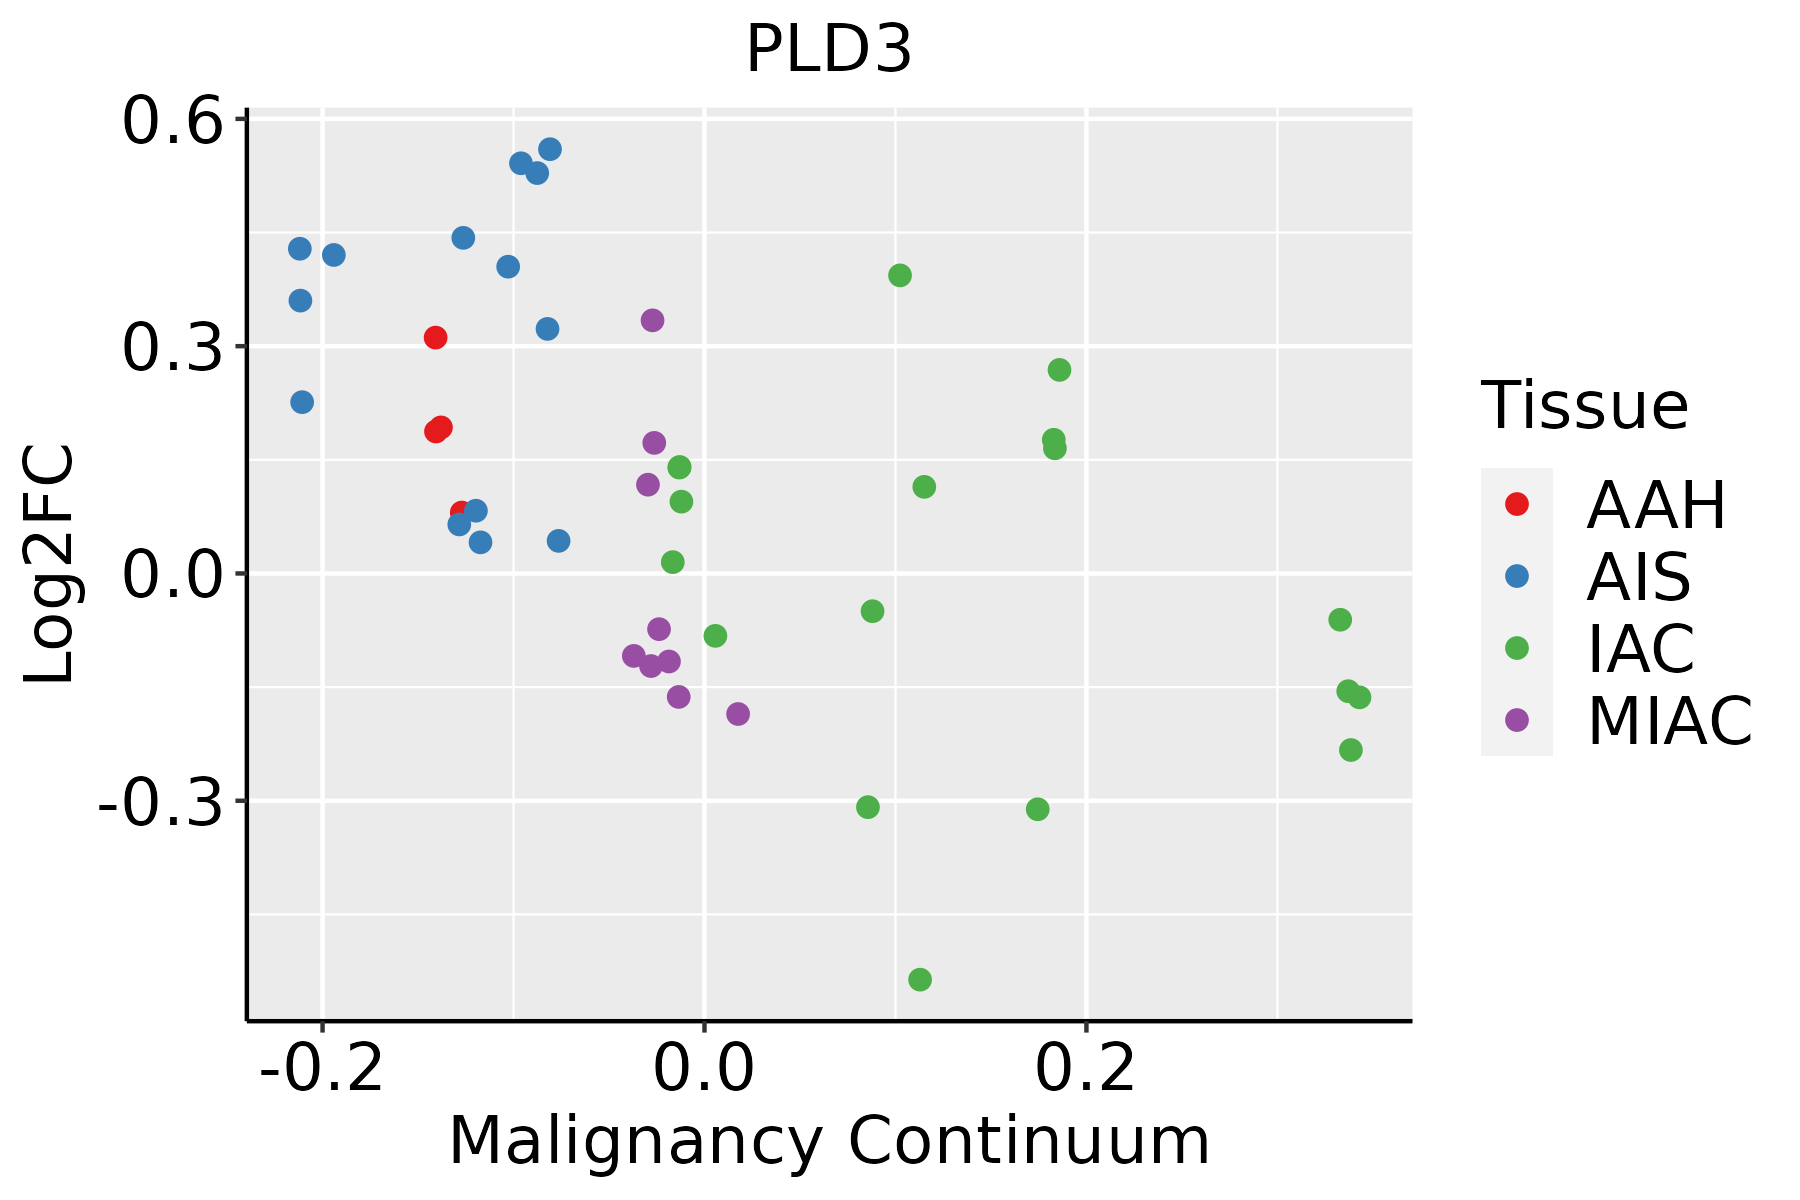 | AAH: Atypical adenomatous hyperplasia |
| AIS: Adenocarcinoma in situ |
| IAC: Invasive lung adenocarcinoma |
| MIA: Minimally invasive adenocarcinoma |
| Oral Cavity | 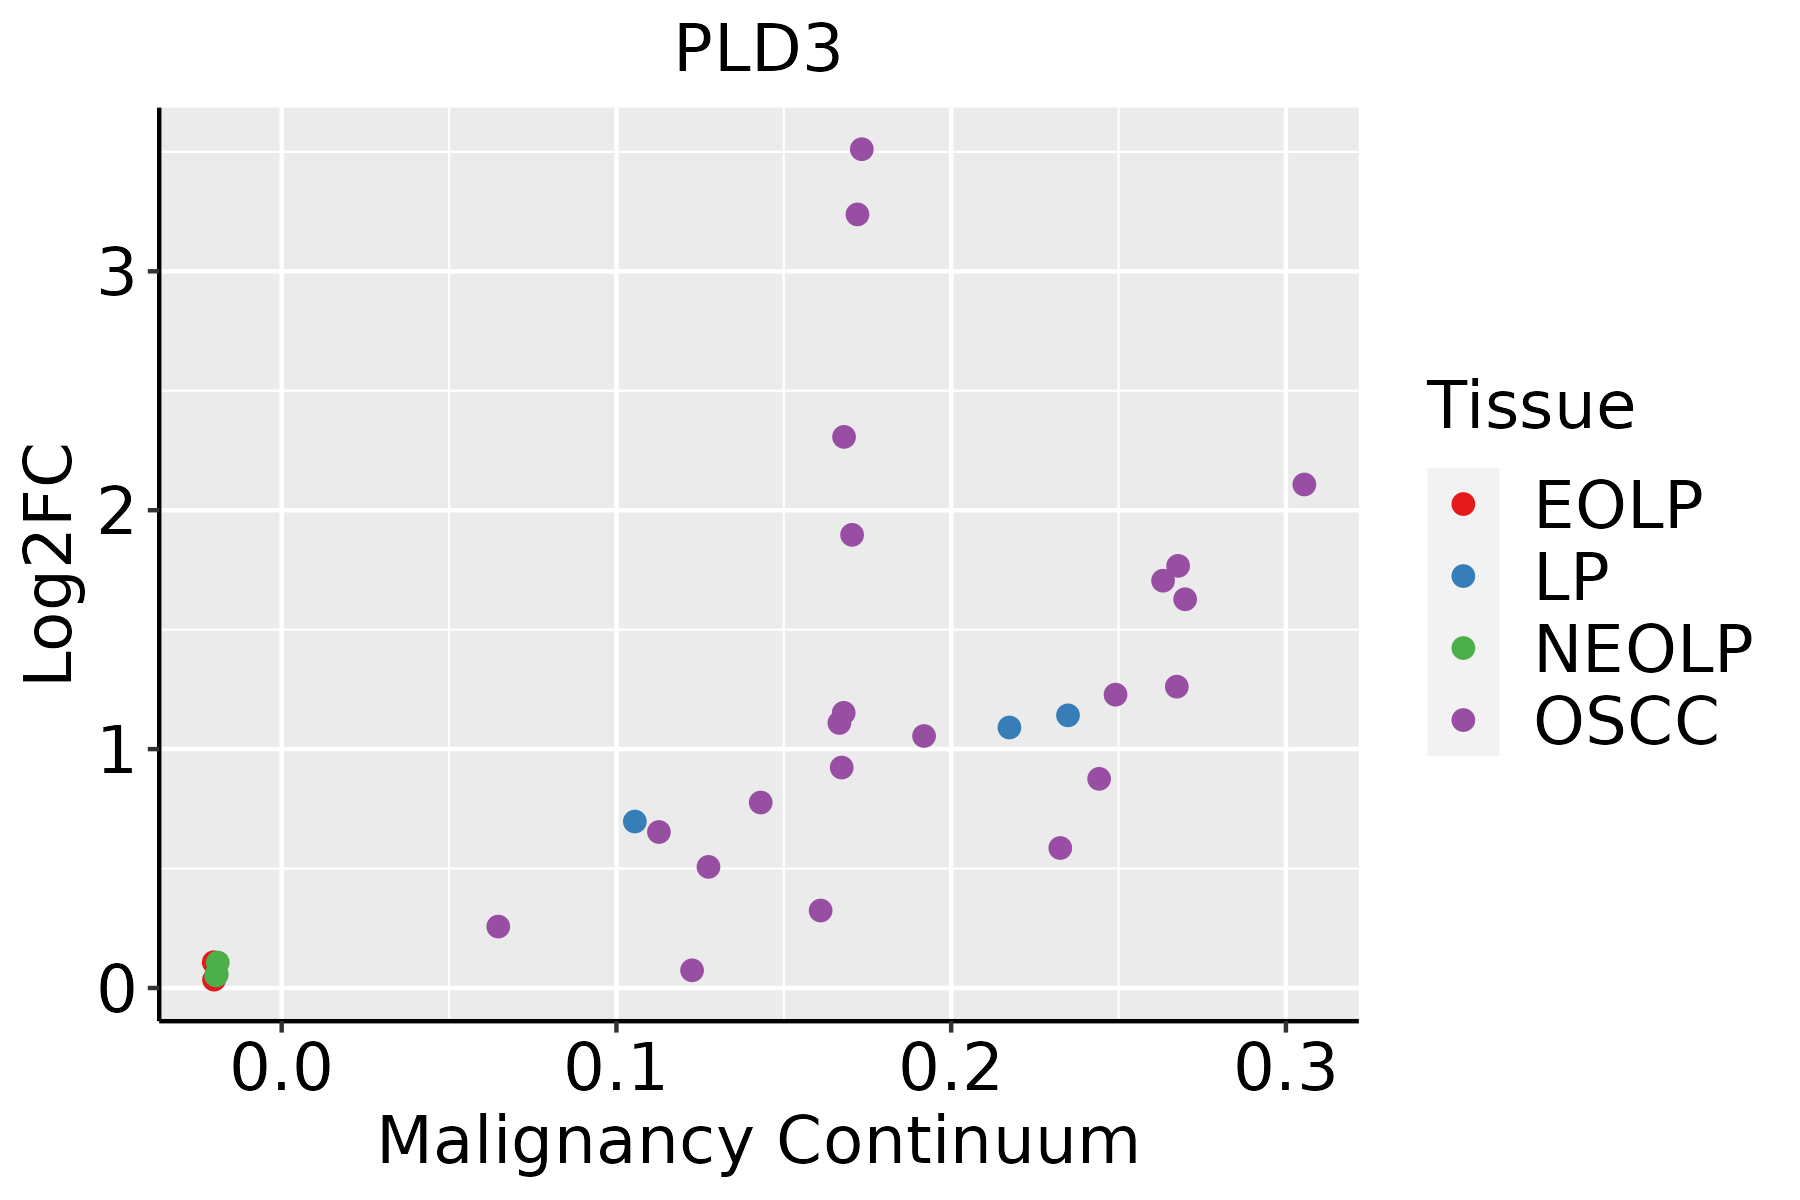 | EOLP: Erosive Oral lichen planus |
| LP: leukoplakia |
| NEOLP: Non-erosive oral lichen planus |
| OSCC: Oral squamous cell carcinoma |
| Prostate |  | BPH: Benign Prostatic Hyperplasia |
| Skin | 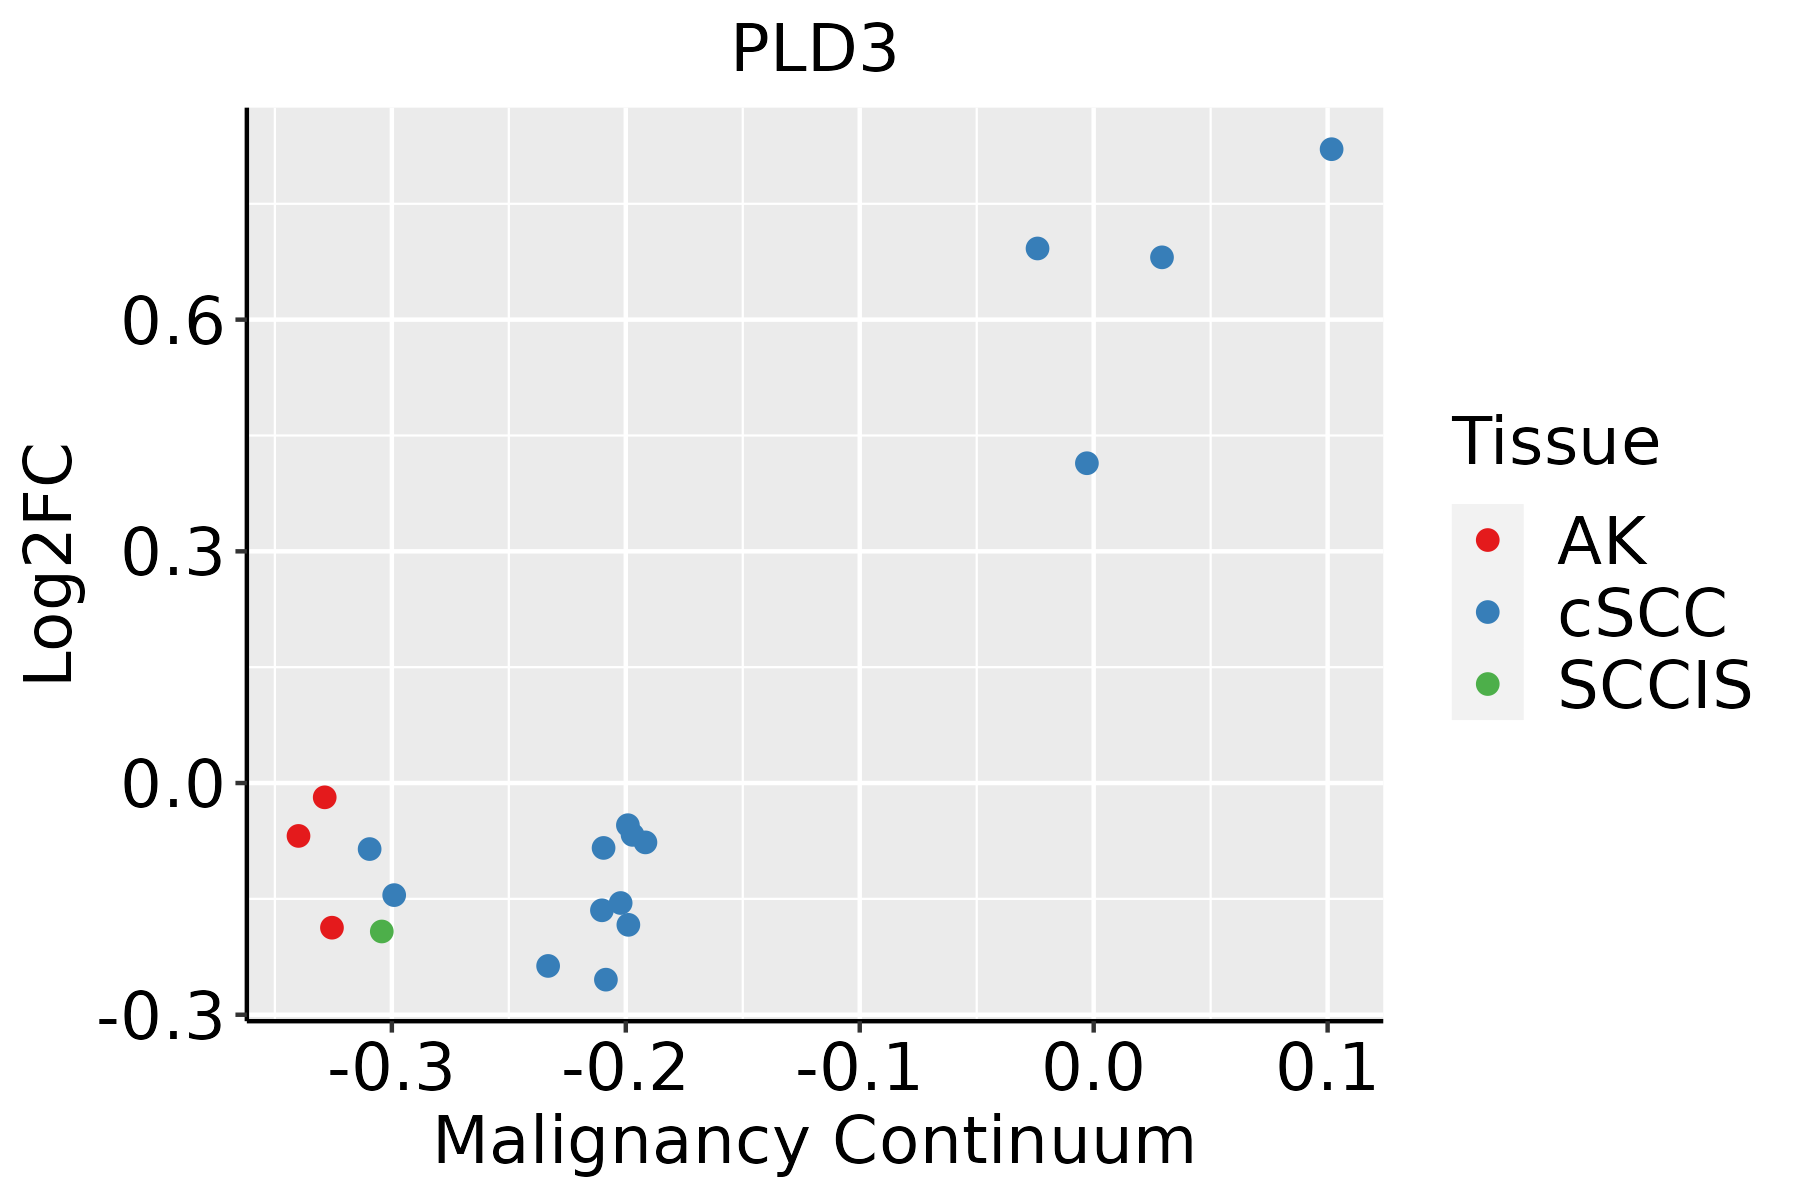 | AK: Actinic keratosis |
| cSCC: Cutaneous squamous cell carcinoma |
| SCCIS:squamous cell carcinoma in situ |
| Thyroid | 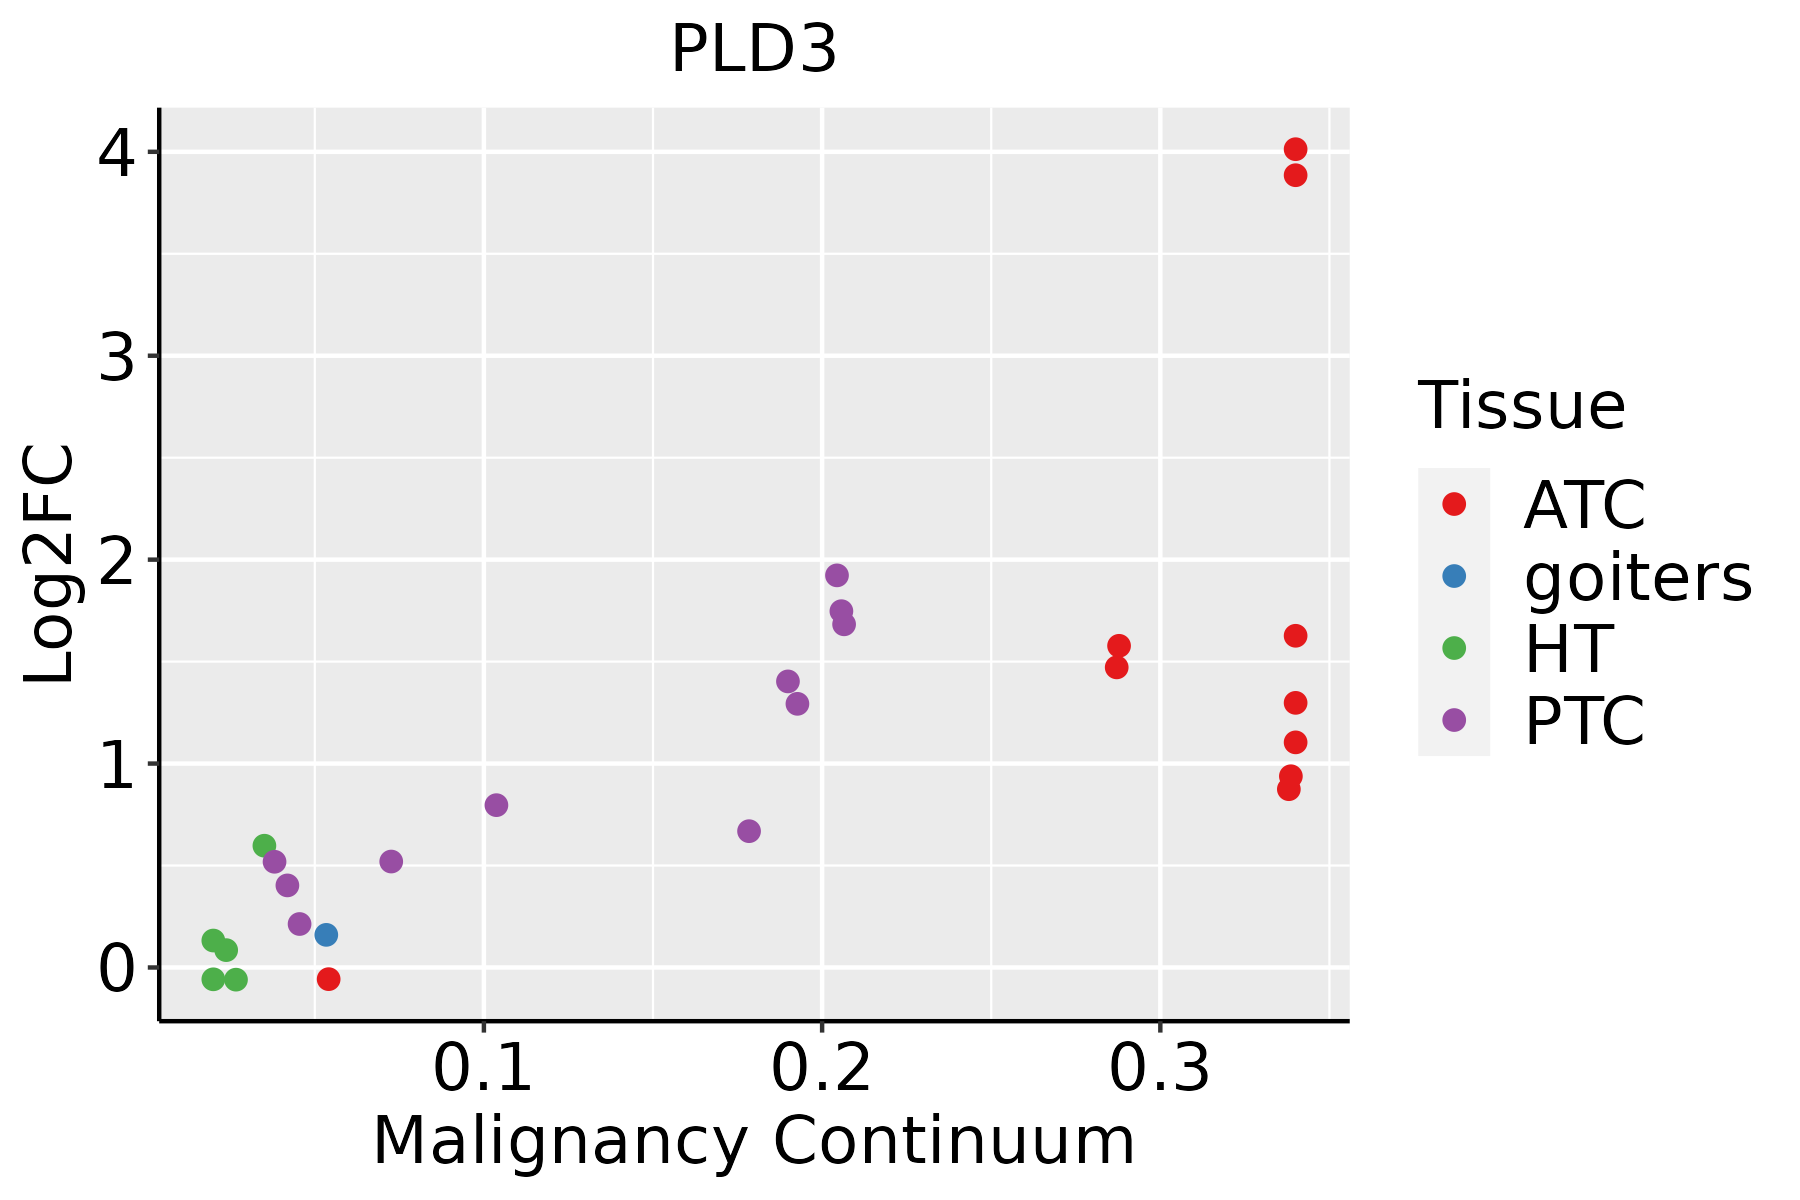 | ATC: Anaplastic thyroid cancer |
| HT: Hashimoto's thyroiditis |
| PTC: Papillary thyroid cancer |
| GO ID | Tissue | Disease Stage | Description | Gene Ratio | Bg Ratio | pvalue | p.adjust | Count |
| GO:00426924 | Cervix | CC | muscle cell differentiation | 69/2311 | 384/18723 | 8.12e-04 | 7.09e-03 | 69 |
| GO:00511464 | Cervix | CC | striated muscle cell differentiation | 50/2311 | 283/18723 | 5.53e-03 | 3.19e-02 | 50 |
| GO:00426925 | Endometrium | AEH | muscle cell differentiation | 68/2100 | 384/18723 | 8.88e-05 | 1.30e-03 | 68 |
| GO:00511465 | Endometrium | AEH | striated muscle cell differentiation | 51/2100 | 283/18723 | 4.20e-04 | 4.46e-03 | 51 |
| GO:004269212 | Endometrium | EEC | muscle cell differentiation | 67/2168 | 384/18723 | 3.87e-04 | 4.12e-03 | 67 |
| GO:005114613 | Endometrium | EEC | striated muscle cell differentiation | 51/2168 | 283/18723 | 8.71e-04 | 7.97e-03 | 51 |
| GO:00903053 | Esophagus | ESCC | nucleic acid phosphodiester bond hydrolysis | 163/8552 | 261/18723 | 3.07e-08 | 5.73e-07 | 163 |
| GO:0090305 | Liver | HCC | nucleic acid phosphodiester bond hydrolysis | 152/7958 | 261/18723 | 1.90e-07 | 3.46e-06 | 152 |
| GO:0042692 | Lung | IAC | muscle cell differentiation | 65/2061 | 384/18723 | 2.75e-04 | 4.54e-03 | 65 |
| GO:00511462 | Lung | IAC | striated muscle cell differentiation | 47/2061 | 283/18723 | 2.66e-03 | 2.45e-02 | 47 |
| GO:00426921 | Lung | AIS | muscle cell differentiation | 58/1849 | 384/18723 | 7.00e-04 | 1.03e-02 | 58 |
| GO:00511461 | Lung | AIS | striated muscle cell differentiation | 42/1849 | 283/18723 | 4.88e-03 | 4.24e-02 | 42 |
| GO:00426922 | Lung | MIAC | muscle cell differentiation | 39/967 | 384/18723 | 4.51e-05 | 2.36e-03 | 39 |
| GO:00903052 | Oral cavity | OSCC | nucleic acid phosphodiester bond hydrolysis | 142/7305 | 261/18723 | 2.90e-07 | 4.43e-06 | 142 |
| GO:00426927 | Oral cavity | OSCC | muscle cell differentiation | 175/7305 | 384/18723 | 4.79e-03 | 1.92e-02 | 175 |
| GO:00903051 | Oral cavity | LP | nucleic acid phosphodiester bond hydrolysis | 92/4623 | 261/18723 | 8.07e-05 | 1.04e-03 | 92 |
| GO:00426926 | Prostate | BPH | muscle cell differentiation | 88/3107 | 384/18723 | 7.59e-04 | 5.01e-03 | 88 |
| GO:00511466 | Prostate | BPH | striated muscle cell differentiation | 62/3107 | 283/18723 | 1.15e-02 | 4.68e-02 | 62 |
| GO:004269213 | Prostate | Tumor | muscle cell differentiation | 93/3246 | 384/18723 | 3.45e-04 | 2.73e-03 | 93 |
| GO:005114614 | Prostate | Tumor | striated muscle cell differentiation | 69/3246 | 283/18723 | 1.56e-03 | 9.54e-03 | 69 |
| Hugo Symbol | Variant Class | Variant Classification | dbSNP RS | HGVSc | HGVSp | HGVSp Short | SWISSPROT | BIOTYPE | SIFT | PolyPhen | Tumor Sample Barcode | Tissue | Histology | Sex | Age | Stage | Therapy Types | Drugs | Outcome |
| PLD3 | SNV | Missense_Mutation | rs145892029 | c.1154N>A | p.Arg385His | p.R385H | Q8IV08 | protein_coding | tolerated(0.17) | benign(0) | TCGA-AO-A0JM-01 | Breast | breast invasive carcinoma | Female | <65 | I/II | Chemotherapy | doxorubicin | SD |
| PLD3 | SNV | Missense_Mutation | | c.916N>G | p.Pro306Ala | p.P306A | Q8IV08 | protein_coding | tolerated(0.82) | benign(0.005) | TCGA-C8-A1HM-01 | Breast | breast invasive carcinoma | Female | >=65 | I/II | Chemotherapy | doxorubicin | CR |
| PLD3 | SNV | Missense_Mutation | novel | c.931C>G | p.Leu311Val | p.L311V | Q8IV08 | protein_coding | tolerated(0.25) | benign(0.079) | TCGA-E9-A3HO-01 | Breast | breast invasive carcinoma | Female | <65 | I/II | Chemotherapy | cyclophosphamide | CR |
| PLD3 | insertion | Frame_Shift_Ins | novel | c.893_894insAG | p.Leu299AlafsTer11 | p.L299Afs*11 | Q8IV08 | protein_coding | | | TCGA-A7-A26I-01 | Breast | breast invasive carcinoma | Female | >=65 | I/II | Chemotherapy | cytoxan | SD |
| PLD3 | insertion | Frame_Shift_Ins | novel | c.894_895insTTTCTGGT | p.Leu299PhefsTer13 | p.L299Ffs*13 | Q8IV08 | protein_coding | | | TCGA-A7-A26I-01 | Breast | breast invasive carcinoma | Female | >=65 | I/II | Chemotherapy | cytoxan | SD |
| PLD3 | insertion | Frame_Shift_Ins | novel | c.893_894insAGCTTTCTGGTCT | p.Leu299AlafsTer52 | p.L299Afs*52 | Q8IV08 | protein_coding | | | TCGA-AC-A3QQ-01 | Breast | breast invasive carcinoma | Female | <65 | I/II | Unknown | Unknown | SD |
| PLD3 | insertion | Nonsense_Mutation | novel | c.1090_1091insCTGAGAAGCTTGGCTGGTATGTGAGCAAATAAACGGAACTAT | p.Ile364delinsThrGluLysLeuGlyTrpTyrValSerLysTerThrGluLeuPhe | p.I364delinsTEKLGWYVSK*TELF | Q8IV08 | protein_coding | | | TCGA-BH-A0E2-01 | Breast | breast invasive carcinoma | Female | <65 | III/IV | Chemotherapy | doxorubicin | SD |
| PLD3 | insertion | Frame_Shift_Ins | novel | c.19_20insCCAGCCTGGGCAAAAGAGCGAA | p.Tyr7SerfsTer21 | p.Y7Sfs*21 | Q8IV08 | protein_coding | | | TCGA-BH-A0HQ-01 | Breast | breast invasive carcinoma | Female | <65 | I/II | Hormone Therapy | arimidex | SD |
| PLD3 | insertion | Frame_Shift_Ins | novel | c.21_22insT | p.Gln8SerfsTer13 | p.Q8Sfs*13 | Q8IV08 | protein_coding | | | TCGA-BH-A0HQ-01 | Breast | breast invasive carcinoma | Female | <65 | I/II | Hormone Therapy | arimidex | SD |
| PLD3 | SNV | Missense_Mutation | novel | c.95N>T | p.Ala32Val | p.A32V | Q8IV08 | protein_coding | deleterious_low_confidence(0.04) | benign(0.006) | TCGA-2W-A8YY-01 | Cervix | cervical & endocervical cancer | Female | <65 | I/II | Chemotherapy | cisplatin | CR |


